Academic Platform Journal of Engineering and Science
journal homepage: http://apjes.com/Effect of the Oscillator Length on the Characteristics of a Feedback Type Fluidic
Oscillator
*1Mehmet N. Tomac
1University of Cincinnati, Cincinnati, OH 45267, USA,
Research Paper Arrival Date: 28.06.2019 Accepted Date: 27.01.2020
Abstract
This work characterizes the various length fluidic oscillators with constant depth and having the same main geometric dimensions. A change in fluidic oscillator's length affects the frequency and sweeping characteristics of the fluidic oscillators. These characteristics were extracted by means of constant temperature anemometry hot-wire measurements and water flow visualizations. A total number of ten fluidic oscillators were compared to the baseline fluidic oscillator design. It was observed that shortening the fluidic oscillator ceases the oscillations after a threshold oscillator length whereas elongating the fluidic oscillator decreases the frequency and sweep angle gradually. Furthermore, the frequency maps obtained from hot-wire measurements for each considered fluidic oscillator design provided overall detail about the frequency of the oscillations for a wide range of flow rate. For a constant supply flow rate where the frequency and the sweep angle of an oscillator is constant, changing the length of a fluidic oscillator will allow varying these characteristics of the oscillator. Thus the oscillator can be tailored for a specific need of an application.
Keywords: Experimental Fluid Mechanics, Aerodynamic Flow Control, Flow Control Actuators, Fluidic Oscillators
1. INTRODUCTION
Fluidic oscillators are useful devices that are capable of generating an oscillating jet by solely employing the fluid dynamics principles without any moving parts. They are the one of the main outcomes of the field of fluidic logic of 1960s and a fluidic oscillator was first designed by Warren [1]. Since then the fluidic oscillators have been used in various applications. The most known application for the fluidic oscillators is their role as automobile windshield washer nozzles [2]. The spreading of the oscillating jet created by these devices are useful to spray windshield washer fluid to a larger area with minimal amount of fluid. Another main application for fluidic oscillators is the flow rate metering [3, 4] since the oscillation frequency of a fluidic oscillator is strictly dictated by the supply flow rate. However, recently fluidic oscillators have started attracting more attention to be used in various aerospace applications in order to obtain aerodynamic, aeroacoustics or aerothermal improvements. Fluidic oscillators have been used for noise reduction [5], combustion control [6], and separation control [7, 8] as the detailed reviews can be found in the literature [9, 10]. A recent flight test completed by Boeing [11] has shown that an array of fluid oscillators can delay the flow separation on an aircraft's tail, which would allow design of smaller tails thus results in reduced drag and improved
overall fuel economy. Although aerodynamic improvements have vital importance for air vehicles, it has also become very important for ground vehicles such as automobiles, trucks, and trains due to the strict regulations and competition. The automobiles move through air and face a force opposing their motion. This force is known as drag and it can be accounted for more than 60% of the power consumed by the vehicle especially at higher speeds at highway travel. Therefore, more studies are focusing on increasing aerodynamic efficiency of automobiles in order to decrease the fuel consumption of these vehicles. The traditional models that are studied for this purpose are known as Ahmed Body model [12] and Generic European Transport System (GETS) model [13]. Various passive and active flow control actuators were used on these models such as an array of small cylinders as vortex generators [14], pulsed jets [15], and fluidic oscillators [17, 18]. The drag reductions reported in these works were as high as 16%. For instance, Woszidlo et al. [17] used fluidic oscillators to control the separation behind a GETS model and reported drag reductions up to 16%. In another study, Metka and Gregory [18] used fluidic oscillators to control the separation behind an Ahmed Body model and reported drag reductions up to 7%. As these results indicate fluidic oscillators are promising flow control actuators for various aerodynamic applications including automobile aerodynamics. Therefore, characterization of the
fluidic oscillators is important subject since various scale oscillators with various characteristics are needed for different applications.
The internal flow field of a fluidic oscillator has a key role in defining the characteristics of the device. Various studies discuss the internal flow fields of different type oscillators [19-24] and recent studies present new approaches to manipulate the internal and external flow fields of the oscillators [25,26] that can dynamically change the characteristics of the oscillators. The fluidic oscillator design used in this work is a feedback type fluidic oscillator and was based on a design by Bray [27] as the geometry of this design is given in Figure 1. As seen in the schematic, pressurized fluid feeds the main jet which is issued into an interaction chamber surrounded by two feedback channels. The main jet attaches to one of the nearby walls due to the Coandă effect. In the vicinity of the throat of the oscillator, the main jet bifurcates into two branches. The first branch leaves the oscillator and constitutes the exiting jet whereas the second branch generates a feedback flow in the feedback channel. This feedback flow enlarges a separation bubble and urges the main jet to attach to the other nearby wall. This process repeats itself as long as the oscillator is fed and continuously changes the flow direction of the exiting jet thus creating oscillating behavior.
Figure 1. The outline of the fluidic oscillator geometry and the schematic of the internal flow field [27].
Various fluidic oscillator applications require various scale oscillator with different characteristics. In this work, effect of fluidic oscillator length on the frequency and sweep angle characteristics was investigated by means of hot-wire measurements and flow visualizations. The performance of the shortened or elongated designs was compared to a baseline design.
2. EXPERIMENTAL SETUPS
2.1. Design of the Fluidic Oscillators
Total of 11 fluidic oscillator designs were built by laser cutting out of acrylic material as one of the actual model is
presented in Figure 2a. Each experimental model was consisted of four pieces glued together with acrylic glue. The depth of the oscillators was fixed at 1.5 mm and the throat exit width was 3.5 mm resulting 2.1 mm of hydraulic diameter. Figure 2a and 2b show three of these 11 models built. D0 is the baseline design whereas -D4 is the shortest (10 mm shorter than D0) and +D6 is the longest design (40 mm longer than D0) that were considered. All 11 designs are shown over the longest +D6 design in Figure 2c. Each dashed green lines correspond to a shorter design whereas each dashed blue lines corresponds to a longer design and red dashed line is the D0 baseline design. Note that, next to each dashed line the name of the design and the physical length of the design compared to D0 baseline design are also provided.
Figure 2. Photo of an actual experimental model for +D6 (a), the geometry of the baseline (D0) and the smallest -D4 designs (b), and schematic indicating the geometrical length of each design (c).
2.2. Frequency Measurements
In order to extract the frequency characteristics of each considered design a Constant Temperature Anemometry (CTA) system from A.A. Lab Systems (LTD AN-1005) was used. The hot-wire probe used for measurements was Dantec Dynamics Type 55R01 probe. This probe's sensor is made out of 70 µm diameter quartz fiber. It is 3 mm long and
covered by thin nickel coating (0.5 µm) to be used in air applications. The probe was located 10mm downstream and 2 mm off the centerline of the oscillator throat for each measurement as shown in Figure 3 for design +D3. The hot-wire probe was not calibrated since the power spectral characteristics of a signal can be accurately obtained from raw voltage data. Probe signal was sampled at 25.6 kHz which allows observation of frequencies up to 12.3 kHz due to the Nyquist Theorem. A mass flow controller (Alicat Scientific MCR-250SLPM-D/10M) was used to measure the mass flow rate through the oscillators. The uncertainty in the measured frequency was calculated to be ±4%.
Figure 3. Location of the hot-wire probe relative to +D3 design.
2.3. Water Flow Visualizations
Water flow visualizations were used to visually monitor the changes in the sweep angle and to quantify the sweep angle of the each fluidic oscillator design. Fluidic oscillators were connected to city water and the flow rate was controlled with a needle valve. Reynolds number (Re) was matched in order to ensure similar flow fields between water flow visualizations and hot-wire measurements in air. Re was based on the exit width as the characteristic length and the bulk velocity calculated by using the volumetric flow rate measured by an Omega Engineering FLR1011ST-D flow meter. The highest flow rate of 50 SLPM chosen for air and the corresponding flow rate for water flow visualizations was 28.3 mL/s. A Sony DSC-TX30 waterproof digital camera was used to record the time-averaged images of the external flow field.
3. RESULTS AND DISCUSSIONS
3.1. Frequency Characteristics
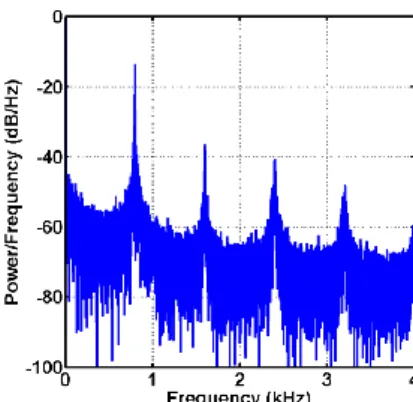
The frequency characteristics for all designs were obtained from hot-wire measurements. Frequency maps were generated by using individual power spectrum for each design. Such power spectrum for baseline D0 design for flow rate of 60 SLPM is provided in Figure 4. The fundamental frequency (first harmonic) corresponding the oscillation frequency of the fluidic oscillator for this flow rate was 800 Hz. Also, harmonics up to fourth are visible in the power spectra. The frequency value corresponding to fourth harmonic was 3206 Hz. The magnitude of the signal was observed to diminish significantly for the higher harmonics.
Figure 4. The power spectrum for the baseline D0 design at flow rate of 60 SLPM.
Figure 5 presents the frequency maps obtained for the baseline D0 design by combining the power spectra for each considered flow rate in the range from 10 SLPM to 60 SLPM. The first plot shows the frequency map for up to 4 kHz. In this figure, the fundamental frequencies (i.e., oscillation frequencies) are visible and higher harmonics are also observable. Higher harmonics up to sixth are visible in the plot for the flow rate of 40 SLPM. In Figure 5, the zoomed-in plot considers the oscillation frequencies observed below 1 kHz. As expected the oscillation frequency increases with the increasing flow rate. The dashed line in this figure follows the changes in the trend and it was seen to exhibit quasi-linear character.
Figure 5. Frequency map for the baseline D0 design for flow rates from 10 SLPM to 60 SLPM.
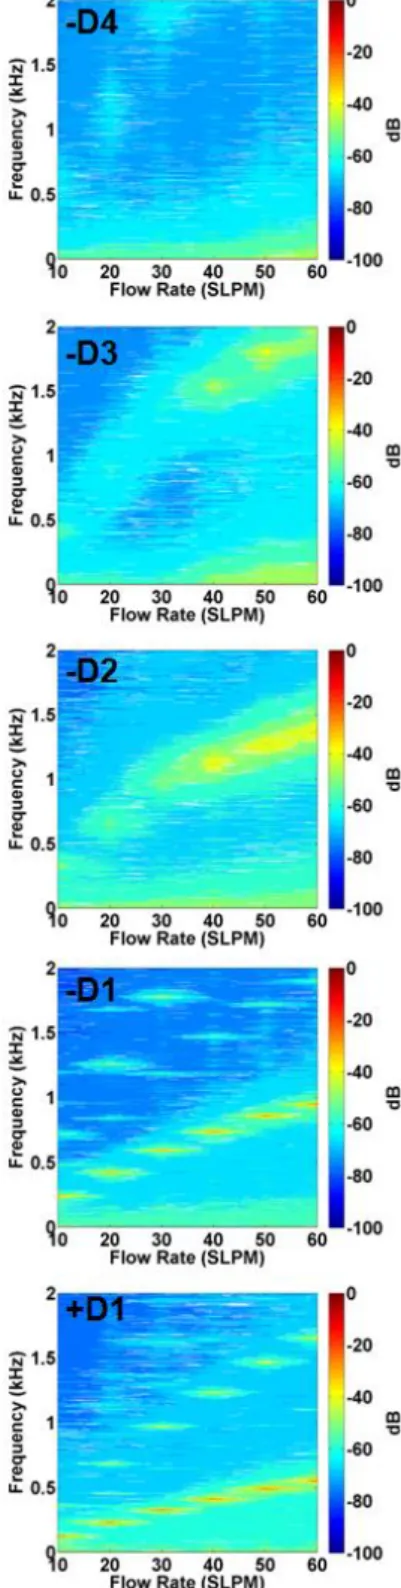
Additional frequency maps for other designs were generated to observe the changes in the frequency characteristics for the considered flow rate range of 10 SLPM to 60 SLPM. Figure 6 and 7 present the frequency maps for the rest of the designs. As can be seen for -D4 and -D3, there is no
observable oscillation frequency i.e., the oscillator geometry is not capable of generating an oscillating jet for these lengths. However, design -D2 exhibits relatively higher magnitude frequencies than the two designs before it but these magnitudes were still in the lower end. On the other hand, -D1 design starts to show distinct oscillation frequencies for all flow rates. Even some higher harmonics also start to appear. Other designs starting with +D1 clearly
show the oscillation frequencies for the considered flow rate range. However, after the design +D1 the higher harmonics was tended to disappear for most of the flow rates. Note that, also after the design +D1 the dark blue contours indicating lower magnitude signal start to change color indicating the overall magnitudes of entire frequency range are increasing beside the fundamental oscillation frequencies.
Figure 6. The frequency maps for designs –D4 to +D1 excluding D0 for a flow rate range from 10 SLPM to 60 SLPM.
Figure 7. The frequency maps for designs +D2 to +D6 for a
Figure 8 was generated in order to isolate the fundamental oscillation frequencies from the frequency maps. In this figure, the oscillation frequency for each design is presented for the considered flow rate range. As seen in here, -D4 and -D3 yielded zero oscillations i.e., the device does not operate as an oscillator. However, starting with +D2 this trend changes and oscillator starts to provide an oscillating jet. As the length of the oscillator is increased oscillation frequencies start to decrease and the trend of the frequency change for a given design becomes more linear. For instance, it is possible to obtain 1371 Hz with -D2 whereas an oscillation frequency of 126 Hz is achievable with design +D6 that are considered in this work. Note that, for both designs and all designs the exit dimensions were fixed and only the length of the oscillator was varied. This also implies that the bulk velocity from each oscillator was constant for a given flow rate.
Figure 8. Comparison of the oscillations frequencies for all designs.
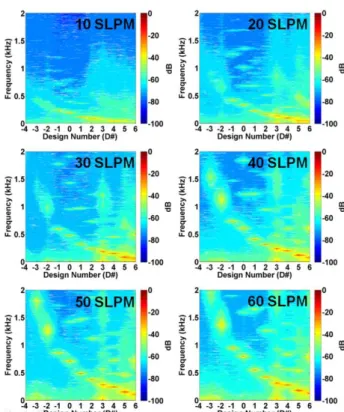
Frequency maps can also be generated to present the changes in the frequency based on the designs. Figure 9 shows these frequency maps. In here, for each plot the flow rate is constant and the oscillation frequencies are compared from one design to another. The nature of the change in the oscillation frequency with the increasing flow rate is rather parabolic than linear. Oscillation frequencies increase as the flow rate is increased as expected.
One of the main observations in here is the fact that when higher flow rates such as 50 SLPM and 60 SLPM are considered, the frequency maps indicate some oscillation frequencies for -D3. But for -D4 no high amplitude frequency can be observed. Furthermore, as the baseline D0 design is elongated up to 40 mm, the oscillation frequency becomes broader and this is clearly visible for designs +D4, +D5, and +D6 from 20 SLPM to 60 SLPM.
Figure 9. Change of frequency characteristics for all designs based on the selected flow rate.
3.2. Sweep Angle Characteristics
The two main components that constitute the characteristics of a fluidic oscillator are the oscillation frequency and the sweep angle. The oscillation frequencies for various length oscillators were measured by means of hot-wire measurements and sweep angles were obtained by Re matched flow visualizations. For this purpose, the flow rate of 50 SLPM chosen and the corresponding flow rate for water flow visualizations was 28.3 mL/s. Figure 10 shows such flow visualization for baseline D0 design. In this figure, the sweeping jet generated by the fluidic oscillator can easily be seen. From this visualization the sweep angle was measured to be 41º and this value was the highest of all considered designs.
Figure 10. Flow visualization for the baseline D0 design showing the sweep angle of the oscillating jet generated by the oscillator.
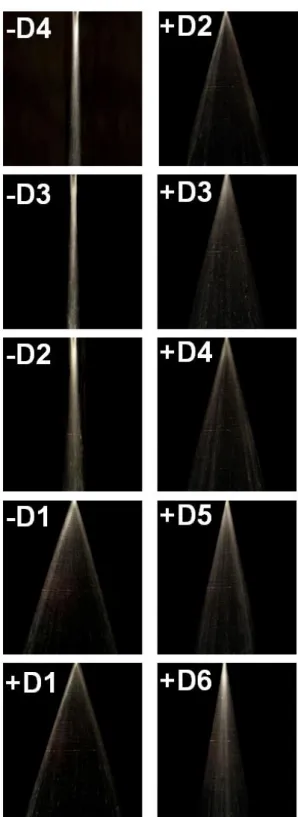
The flow visualizations also used to extract the sweep angle characteristics for the rest of the designs. Figure 11 details the sweep angle of the each oscillator design. As can be seen in the visualizations for -D4 and -D3, the sweeping motion cannot be identified. On the other hand, with design -D2 the sweeping motion becomes clear and measurable from the visualizations. After this design, the sweep angle increases up to 41º for the baseline D0 design and starts to reduce afterwards. The sweep angle goes down to 20º for the longest +D6 design.
Figure 11. Water flow visualizations for all designs.
Table 1 summarizes the sweep angle for each design quantitatively. The measured sweep angle starts from 9º for -D2, goes up to 41º for the baseline D0 design, and goes down to 20º for the longest +D6 design. Therefore, when the exit dimensions are kept constant and the length of the oscillator is changed it is possible to vary the sweep angle from 9º to 41º.
Table 1. Measured sweep angles for all designs.
Design #
Sweep Angle (˚)
-D4 NA -D3 NA -D2 9 -D1 37
D0 41 +D1 38 +D2 34 +D3 31 +D4 29 +D5 25 +D6 20
4. CONCLUSIONS
In this work, the fluidic oscillators having the same depth, throat width, and main geometrical dimensions but various oscillator lengths were characterized. The characterization was consisted of oscillation frequency and sweep angle measurements. The two shortest designs were not observed to generate oscillations. This fact also yielded an external flow field similar to that of regular jet for these two designs. The oscillation frequencies were observed to increase with the increasing flow rate for a given design. Furthermore, it was also seen that as the oscillator is elongated compared to the baseline design, both the oscillation frequency and the sweep angle reduce. However, when the oscillator is made shorter, the oscillation frequency increases while the sweep angle decreases. Furthermore, the oscillator can no longer sustain the oscillations after a certain length.
Existence of the oscillations were found to be more sensitive to shortening than elongating the oscillator. The oscillations were present when the oscillator was elongated by 40 mm but seemed to cease after shortening the oscillator by 5 mm. The data and the approach presented in this work can be used to select a fluidic oscillator with the characteristics that are specific to the application they are intended to be used for.
ACKNOWLEDGMENTS
The author would like to thank Dr. Liran Oren of University of Cincinnati for providing access to the Constant Temperature Anemometry system. The experimental models used in this work was built by using an Accelerator Fast Track funding (Project No. 60065789) awarded by the Ohio State University Technology Commercialization Office.
REFERENCES
[1]. R. W. Warren, U.S. Patent Application for “Fluid Oscillator,” Docket No. 3,016,066, filed 9 Jan. 1962. [2]. R. D. Stouffer, “Liquid Oscillator Device,” U.S. Patent 4,508,267, filed 2 Apr. 1985.
[3]. T. Shakouchi, “Fluidic Oscillator Operated by Gas(Air)-Liquid(Water) Two-Phase Flow (Measurement of Flow Rate of Gas-Liquid Two-Phase Flow in Pipe),” Proceedings of the ASME Fluids Engineering Division Summer Meeting, Vol. 1, American Society of Mechanical Engineers, New York, pp. 895–901, 2001.
[4]. H. Wang, S. B. M. Beck, G.H. Priestman, and R. F. Boucher, “Fluidic Pressure Pulse Transmitting Flowmeter,” Chemical Engineering Research and Design: Transactions of the Institute of Chemical Engineers, Part A, Vol. 75, No. A4, pp. 381–391, 1997.
[5]. G. Raman and S. Raghu, “Cavity Resonance Suppression Using Miniature Fluidic Oscillators,” AIAA Journal Vol. 45, 2608–2612, 2004.
[6]. D. Guyot, B. C. Bobusch, C. O. Paschereit, and S. Raghu, “Active Combustion Control Using a Fluidic Oscillator for Asymmetric Fuel Flow Modulation,” 44th AIAA/ASME/SAE/ASEE Joint Propulsion Conference & Exhibit, AIAA Paper 2008-4956, 2008.
[7]. C. Cerretelli and K. Kirtley, “Boundary Layer Separation Control with Fluidic Oscillators,” Journal of Turbomachinery, Vol. 131, No. 4, pp. 1-9, 2009.
[8]. R. Seele, P. Tewes, R. Woszidlo, M. A. McVeigh, N. Lucas, and I. J. Wygnanski, “Discrete Sweeping Jets as Tools for Improving the Performance of the V-22,” Journal of Aircraft, Vol. 46, No. 6, pp. 2098–2106, 2009.
[9]. J. W. Gregory and M. N. Tomac, “A Review of Fluidic Oscillator Development,” 43rd Fluid Dynamics Conference, AIAA Paper 2013-2474, 2013.
[10].S. Raghu, “Fluidic oscillators for flow control,” Experiments in Fluids, Vol. 54, No.2, pp.1455, 2013. [11].E. A. Whalen, A. Shmilovich, M. Spoor, J. Tran, P. Vijgen, J. C. Lin, and M. Andino, “Flight Test of an Active Flow Control Enhanced Vertical Tail, ” AIAA Journal Vol. 56, 3393–3398, 2018.
[12].S. R. Ahmed, G. Ramm, and G. Faltin, G., “Some Salient Features of the Time Averaged Vehicle Wake,” SAE Technical Paper No. 840300, 1984.
[13].G. M. R. van Raemdonck and M. J. L. van Tooren, “Time-Averaged Phenomenological Investigation of a Wake behind a Bluff Body”. Proc. Bluff Body Aerodynamics & Applications VI, Milan, Italy, 2008.
[14].J.-F. Beaudoin and J.-L. Aider, “Drag and Lift Reduction of a 3D Bluff Body Using Flaps,” Experiments in Fluids, Vol. 44, No.4, pp. 491–501, 2008.
[15].S. Krajnovic, “Large Eddy Simulation Exploration of Passive Flow Control around an Ahmed Body,” ASME Journal of Fluids Engineering, Vol.13, No.12, p. 121103, 2014.
[16].P. Joseph, X. Amandole`se, and J.-L. Aider, “Drag Reduction on the 25° Slant Angle Ahmed Reference Body Using Pulsed Jets,” Experiments in Fluids, Vol. 52, No.5, pp. 1169–1185, 2012.
[17].R. Woszidlo, T. Stumper, C. Nayeri, and C. O. Paschereit, “Experimental study on bluff body drag reduction with fluidic oscillators,” 52nd Aerospace Sciences Meeting, AIAA Paper 2014-0403, 2014.
[18].M. Metka and J.W. Gregory, “Drag reduction on the 25-deg Ahmed model using fluidic oscillators,” Journal of Fluids Engineering, Vol. 13, No.5, p.051108, 2015.
[19].B. C. Bobusch, R. Woszidlo, J. M. Bergada, C. N. Nayeri, and C. O. Paschereit, “Experimental study of the internal flow structures inside a fluidic oscillator,” Experiments in Fluids, Vol. 54, No.6, p.1559, 2013. [20].R. Woszidlo, F. Ostermann, C. N. Nayeri, and C. O. Paschereit, “The time-resolved natural flow field of a fluidic oscillator,” Experiments in Fluids, Vol. 56, No.6, p. 125, 2015.
[21].M. Sieber, F. Ostermann, R. Woszidlo, K. Oberleithner, and C. O. Paschereit, “Lagrangian coherent structures in the flow field of a fluidic oscillator,” Physical Review Fluids, Vol. 1, No. 5, p. 050509, 2016.
[22].M. N. Tomac and J. W. Gregory, “Internal Jet Interactions in a Fluidic Oscillator at Low Flow Rate,” Experiments in Fluids, Vol. 55, No.5, p. 1730, 2014. [23].M. N. Tomac and J. W. Gregory, “Internal Flow Physics of a Fluidic Oscillator Spray in the Transition Regime,” Atomization and Sprays, Vol. 26, No.7, 2016. [24].M. N. Tomac and J. W. Gregory, “Oscillation Characteristics of Mutually Impinging Dual Jets in a Mixing Chamber,” Physics of Fluids, Vol. 30, No. 11, p. 117102, 2018.
[25].M. N. Tomac and J. W. Gregory, “Phase-Synchronized Fluidic Oscillator Pair,” AIAA Journal, Vol. 57, No. 2, pp. 670 - 681, 2019.
[26].M. N. Tomac and E. Sundström, “Adjustable Frequency Fluidic Oscillator with Supermode Frequency,” AIAA Journal, Vol. 57, No.8, pp. 3349 - 3359, 2019. [27].H. C. Bray, “Cold Weather Fluidic Fan Spray Devices and Method,” U.S. Patent 4463904, 1984.
![Figure 1. The outline of the fluidic oscillator geometry and the schematic of the internal flow field [27]](https://thumb-us.123doks.com/thumbv2/123dok_us/8484185.2264672/2.892.544.755.387.902/figure-outline-fluidic-oscillator-geometry-schematic-internal-field.webp)