Minnesota Private College Research Foundation
May 2010
Tuition Trends at Minnesota’s Private
Nonprofit Colleges and Universities
Tuition Trends at Minnesota’s Private Nonprofit Colleges and Universities
2010-2011
Table of Contents
Page(s) Summary
Table 1
Comprehensive Charges for 2010-2011 at Minnesota Private College Council Member Institutions
Chart 1
Comprehensive Charges for Minnesota Private College Council Member Institutions 1999-2000 to 2010-2011
Chart 2
9 Years of Financial Aid to Undergraduates at Minnesota Private College Member Institutions 1999-2007
Chart 3
Minnesota Private College Council Member Institutions: Number of Recipients and Dollars of State Grant
Chart 4
Maximum State Grant as a Percent of Minnesota Private College Council Member Institutions, University of Minnesota and Minnesota State Universities Average Tuition & Fees 1999-2000 to 2010-2011 Chart 5
Maximum Pell Grant as a Percent of Minnesota Private College Council Member Institutions, University of Minnesota and Minnesota State
Universities Average Tuition & Fees 1999-2000 to 2010-2011
1 – 4
5
6
7
8
9
10
Chart 6
Average Tuition & Fees, Room & Board and Comprehensive Charges Compared to the Maximum State Grant and Federal Pell Grant 1999-2000 to 2010-2011
Table 2
State Grant Recipients and Dollars Received at Minnesota Private College Counsel Member Institutions 2002-2009
Chart 7
Percent Change in Average Charges at Minnesota Private College Council Member Institutions, Current Dollars 2000-2001 to 2010-2011
11
12
Tuition Trends at Minnesota’s Private Nonprofit Colleges and Universities
This report summarizes various trends tied to tuition for Minnesota’s private nonprofit colleges and universities. It includes information about prices, including comprehensive charges. A large majority of private college students do not pay the listed tuition price; 92 percent of our students receive aid that lowers their costs. In fact, on average, our students end up paying about half of the full tuition price.
I. Charges for 2010-2011
Tuition and fees for the 17 member institutions of the Minnesota Private College Council (MPCC) for the 2010-2011 academic year have been set and average $30,816. This is an increase of 4.5 percent over the 2009-2010 academic year. At this level, tuition and fees are increasing at the smallest level in more than 30 years, since 1978-79.
This year’s average increase in tuition and fees at MPCC member institutions – as a percentage – is anticipated to be lower than increases at Minnesota’s public four-year institutions. As of April 2010, preliminary information indicates an average increase in tuition of 5.0 percent at Minnesota State Colleges and Universities and 7.5 percent increase in tuition at the University of Minnesota for Minnesota resident
undergraduates.
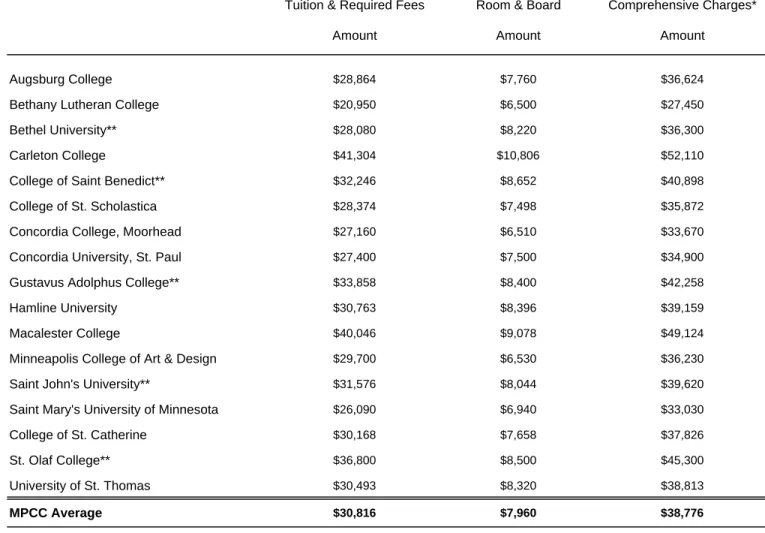
As for charges at individual private colleges and universities, tuitions in 2010-2011 will range from $20,950 to a high of $41,304. Eight institutions charge tuitions that are more than $3,000 above or below the unweighted
average of $30,816. See Table 1 for the 2010-2011 comprehensive charges information for each institution, along with the separate tuition and fees and room and board amounts. These are figures for first-time, full-time, full-year undergraduate students.
Tuition and
fees are
increasing at
the lowest rate
in more than
30 years
Room & Board
Average room and board charges increased from $7,694 to $7,960, or 3.5 percent over the previous year. Room and board charges range from $6,500 to $10,806.
Comprehensive Charges
Average comprehensive charges (tuition and fees plus room and board) will increase from $37,200 to $38,776 for 2010-2011. This is an increase of 4.3 percent over last year’s average.
II. Trends in charges 2000-2001 to 2010-2011
Charges between this academic year and 2010-2011 will grow more slowly than in the past, as noted above. Specifically:
- Tuition and fees: From 2000-2001 to 2010-2011, MPCC member institutions’ average tuition and fees increased by an average annual rate of 6.0 percent, compared to 4.5 percent between 2009-10 and 2010-2011. (Over the last decade the tuition and fees increase has averaged 3.3 percent after adjusting for inflation.)
- Room and board: From 2000-2001 to 2010-2011, MPCC average room and board
between 2009-10 and 2010-2011. (Over the last decade the room and board increase has averaged 2.3 percent after adjusting for inflation.)
- Comprehensive charges: The comprehensive costs have increased by an average annual rate of 5.7 percent since 2000-2001, compared to the increase of 4.3 percent between 2009-10 and 2010-2011. (Over the last decade the comprehensive charges increase has averaged 3.2 percent after adjusting for inflation.)
Chart 1 shows aggregate data for private colleges’ tuition and fees, room and board, and comprehensive charges from 1999-2000 to 2010-2011.
In comparison, the average annual increase for MPCC members – as a percentage – is lower than the percent increases enacted by public institutions in Minnesota.
- At the University of Minnesota, Twin Cities campus, tuition and fees for undergraduates increased by an average annual rate of 9.5 percent for the period 2000-2001 to 2009-2010 or 6.8 percent after adjusting for inflation.
- At MnSCU four-year institutions, undergraduate tuition and fees increased by an average annual rate of 8.1 percent for the period 2000-2001 to 2009-2010, or 5.4 percent after adjusting for inflation.
III. Financial aid considerations
In 2007-2008 (the most recent year for which data are available), more than 94 percent of MPCC undergraduate students received financial aid (including government subsidized loans). The average financial aid package for an undergraduate was approximately $17,100 for 2007-2008. This represents more than one-half of the average tuition and fees charged to students for that year.A majority of MPCC traditional undergraduates (67%) borrow to pay for
educational costs, with an average annual loan amount of $7,040. Institutional Grants
The largest source of financial aid to students at private colleges is gift aid. Member institutions distributed more than $288 million in institutional grants to traditional
undergraduates in 2006-2007 (the most recent data available from the Minnesota Office of Higher Education). According to the winter 2009-2010 Finance Survey from IPEDS, in 2007-2008 MPCC members awarded $368 million in institutional grants – $46.2 million funded and $322 million unfunded grants. Overall, institutional grants are rising at a faster rate than tuition and fees. The average annual increase in the average institutional grant per recipient was 8.4 percent from 2000-2001 to 2007-2008. The rate of increase in institutional grants also can be seen in the rising discount rate for undergraduates at member institutions. Analysis of data collected by Baker Tilly Virchow Krause, LLP shows that the mean undergraduate tuition discount rate has risen 7.9 percentage points from 1999-2000 to 2008-2009.
State & Federal Grants
Due to the impact of the economic recession on Minnesota families, demand for the Minnesota State Grant program exceeds available resources for the current biennium by approximately $42 million. Current law permits the Office of Higher Education to address an appropriation shortfall by assessing a surcharge on the Assigned Student Responsibility and the Assigned Family Responsibility in equal amounts. In an effort to reduce the impact that OHE’s rationing authority would have on the over 95,000 students receiving a State Grant, the Legislature passed and Gov. Pawlenty signed two changes to the program. First, they eliminated the ninth
semester of eligibility. Second, they capped the annual spending on the Summer Transition program at $1 million. These changes reduced the projected deficit to $35 million.
Funding for students who participate in the Achieve Grant program will remain in place for the next academic year (2010-2011). However, eligibility requirements for the following academic year (2011-2012) will include only those students who have a “zero expected family
contribution” as calculated by the FAFSA. Students who qualify will receive a $1,200 grant. If demand exceeds the available funds, the OHE will ration awards to bring spending in line with available resources.
Funding for students who participate in Work Study programs will also be reduced by $1.8 million in the upcoming academic year.
At the federal level, the Higher Education reconciliation bill includes changes to Pell Grant funding that will benefit students. The maximum Pell grant award will increase from $5,350 to $5,550 for the upcoming year (2010-2011) and will remain at the same level through 2012-2013. For the five years that follow, the maximum Pell grant award will be determined by the Consumer Price Index (CPI) yearly increase.
While the maximum values of both the Minnesota State Grant and the Federal Pell Grant have increased substantially during the past decade, the purchasing power of the two programs as a percent of standard charges has declined. Charts 2 to 6 display the change in the purchasing power of the Minnesota State Grant and the Federal Pell Grant.
State Grant by Sector
The average annual increase in the average Minnesota State Grant at a member institution was 0.3 percent for the period 2001-2002 to 2008-2009. The average annual increase was 6.9 percent for State Grant recipients at the University of Minnesota and 4.1 percent for MnSCU students. In 2009-2010, the maximum Minnesota State Grant equaled 32.0 percent of average tuition and fees at member institutions as compared to 43.5 percent in 1999-2000. At the University of Minnesota, the maximum State Grant equaled 155.3
percent of tuition and fees in 1998-1999 and 82.4 percent in 2008-2009. At MnSCU four-year institutions, the State Grant maximum award equaled 235.7 percent of tuition and fees in 1998-1999 and 142.2 percent in 2008-2009.
The value of the
maximum
Minnesota State
Grant has fallen
from almost 60
percent of the
average private
college tuition
to about 32
percent.
In 1983-1984, the first year of the Design for Shared Responsibility, the maximum Minnesota State Grant was equal to almost 60 percent of the average privatecollege tuition. Over the most recent decade, the total allocation of Minnesota State Grant funds to MPCC students has remained at approximately $30 million in the aggregate (1996-1997 $31.0 million; 2005-2006 $29.0 million; 2008-2009 $33.1 million), though the program served 661 fewer students in 2008-2009 (10,011) than in 1996-1997 (10,672). It is important to note that undergraduate enrollments have been increasing (35,868 fall 1997; 42,826 fall 2009; +19.0 percent). As such, Minnesota State Grant recipients as a percent of private college students enrolled has been steadily declining.
Table 2 shows the trends in MPCC State Grant recipients and dollars received by our institutions from 2002 to 2009.
Over the most recent decade, the total allocation of Federal Pell Grant funds to MPCC students has increased by $12.9 million (1999-2000 $13.1 million; 2008-2009 $26.0 million). The program served about 14 percent more students in 2008-2009 (8,420) as compared to 1999-2000 (7,412).The Federal Pell Grant as a percent of tuition and fees has been more stable over the most recent decade in response to federal appropriation increases. The average annual increase in Pell Grant was 5.3 percent for the period 1999-2000 to 2010-2011. In 2009-2010, the maximum Federal Pell Grant equaled 18.1 percent of average tuition and fees as compared to 18.8 percent in 1999-2000. In 2010-2011, the maximum Pell Grant will equal 17.8 percent of average tuition and fees. The percent of Pell recipients at MPCC institutions has
remained at about 18 percent of total enrollment since 1999-2000.
Minnesota State Grant
recipients as a percent
of private college
students enrolled has
been steadily
declining…
…while the federal Pell
Grant program
recipients as a percent
of private college
students has
been stable.
Loans
More than two-thirds of Minnesota private college traditional undergraduates borrow to pay their educational costs. Member
institutions recorded more than $300 million in loan capital to traditional undergraduates in 2006-2007. The average annual increase in the amount of student loan aid received for the 2000-2001 to 2007-2008 time period was 5.1 percent.
According to the Project on Student Debt, the average cumulative debt for students graduating from private not-for-profit institutions in 2008 was $29,268. The average for students
graduating from public four-year institutions was $23,214.
“Tuition Trends at Minnesota’s Private Nonprofit Colleges and Universities” was prepared by the Minnesota Private College Council. This report, along with other research, is posted on our website at www.mnprivatecolleges.org. If you have questions or comments contact Nathan Lassila, Ph.D., vice president for research and policy development, or John Manning, director of communications. The Minnesota Private College Council’s phone number is 651-228-9061 and general e-mails can be sent to colleges@mnprivatecolleges.org.
Amount Amount Amount Augsburg College $28,864 $7,760 $36,624
Bethany Lutheran College $20,950 $6,500 $27,450
Bethel University** $28,080 $8,220 $36,300
Carleton College $41,304 $10,806 $52,110
College of Saint Benedict** $32,246 $8,652 $40,898
College of St. Scholastica $28,374 $7,498 $35,872
Concordia College, Moorhead $27,160 $6,510 $33,670
Concordia University, St. Paul $27,400 $7,500 $34,900
Gustavus Adolphus College** $33,858 $8,400 $42,258
Hamline University $30,763 $8,396 $39,159
Macalester College $40,046 $9,078 $49,124
Minneapolis College of Art & Design $29,700 $6,530 $36,230
Saint John's University** $31,576 $8,044 $39,620
Saint Mary's University of Minnesota $26,090 $6,940 $33,030
College of St. Catherine $30,168 $7,658 $37,826
St. Olaf College** $36,800 $8,500 $45,300
University of St. Thomas $30,493 $8,320 $38,813
MPCC Average $30,816 $7,960 $38,776
Table 1 Comprehensive Charges for 2010-2011 at Minnesota Private College Council Member Institutions
Tuition & Required Fees Room & Board Comprehensive Charges*
NOTE: Comprehensive charges are reduced for many students through financial assistance. Ninety-four percent of private college students receive financial assistance (IPEDS, 2007-2008), with the amounts and types of aid determined in relation to family resources, calculated need, government formulas, financial aid funding and other factors. Typical assistance provided to students includes Federal and State grants (if applicant qualifies), institutional grants, loans and work-study determined in relation to students' needs and other factors.
*These are standard charges for first-time, full time, full-year undergraduate students, including fees assessed on all undergraduates.
**Several colleges have differential tuition for upper-level students or other policies that result in some variation across class levels. The College of St. Benedict, Gustavus Adolphus College, Saint John's University and St. Olaf College implemented a differential tuition policy for returning seniors in 2010-2011. Bethel University did not increase room rent charges for students who continue to reside in campus housing.
Chart 1
Comprehensive Charges at Minnesota Private College Council Member Institutions
1999-2000 to 2010-2011
$0 $5,000 $10,000 $15,000 $20,000 $25,000 $30,000 $35,000 $40,000 $45,000
1999-2000
2000-2001
2001-2002
2002-2003
2003-2004
2004-2005
2005-2006
2006-2007
2007-2008
2008-2009
2009-2010
2010-2011
Academic Year
A
ver
age C
h
ar
ges
Room & Board Tuition & Fees
Average Standard Student Charges, 1999-2000 to present
1999-2000 2000-2001 2001-2002 2002-2003 2003-2004 2004-2005 2005-2006 2006-2007 2007-2008 2008-2009 2009-2010 2010-2011 Tuition and Fees $16,588 $17,448 $18,109 $19,166 $20,427 $21,800 $23,246 $24,744 $26,358 $28,137 $29,506 $30,816 Room and Board $4,807 $5,012 $5,200 $5,421 $5,664 $5,995 $6,374 $6,696 $7,051 $7,344 $7694 $7,960 Comprehensive Charges $21,395 $22,460 $23,309 $24,587 $26,091 $27,795 $29,620 $31,440 $33,409 $35,481 $37,200 $38,776
Chart 2
9 Years of Financial Aid to Undergraduates at
Minnesota Private College Member Institutions
$-$50 $100 $150 $200 $250 $300 $350
1999
2001
2003
2005
2007
Aid
Op
tio
n
s
in
M
illio
n
s
$-$2,000 $4,000 $6,000 $8,000 $10,000 $12,000 $14,000 $16,000
N
e
t Tui
ti
on
Federal Grants State Grants Institutional Grants Loans Net Price MPCC
Source: Minnesota Private College Research Foundation Analysis of Minnesota Office of Higher Education Report: Financial Aid Awarded to Minnesota Undergraduates (1999-2007).
Percent Change 1999 to 2007
105% 94.6%
37.2%-6.4%
MPCC Net Tuition Trend
Chart 3
Minnesota Private College Council Member Institutions
Number of Recipients and Dollars of State Grant
$-$5,000,000 $10,000,000 $15,000,000 $20,000,000 $25,000,000 $30,000,000 $35,000,000 $40,000,000
2002 2003 2004 2005 2006 2007 2008 2009
Fiscal Years
State Grant Dollars Funded
0 2,000 4,000 6,000 8,000 10,000 12,000
M
N
St
at
e Grant
R
ecipient
s
Total MN State Grant $ Received
Total Recipients
Source:Minnesota Private College Research Foundation Analysis of Minnesota Office of Higher Education Report Minnesota State Grant Program End-of-Year Statistics (FY 2002-09).
Chart 4
Maximum State Grant as a Percent of Tuition and Fees at
Minnesota Private College Council Member Institutions,
University of Minnesota and Minnesota State Universities
1999-2000 to 2010-2011
0% 50% 100% 150% 200% 250%
1999-2000
2000-2001
2001-2002
2002-2003
2003-2004
2004-2005
2005-2006
2006-2007
2007-2008
2008-2009
2009-2010
2010-2011 (est.)
MPCC Maximum State Grant U of M Maximum State Grant MnSCU Maximum State Grant
Chart 5
Maximum Pell Grant as a Percent of Tuition and Fees
at Minnesota Private College Council Member Institutions,
University of Minnesota and Minnesota State Universities
1999-2000 to 2010-2011
0% 20% 40% 60% 80% 100% 120%
1999-2000
2000-2001
2001-2002
2002-2003
2003-2004
2004-2005
2005-2006
2006-2007
2007-2008
2008-2009
2009-2010
2010-2011 (est.) MPCC Maximum Pell Grant
U of M Maximum Pell Grant MnSCU Maximum Pell Grant
Chart 6
Average Tuition & Fees, Room & Board and Comprehensive Charges
Compared to the Maximum State Grant and Federal Pell Grant
at Minnesota Private College Council Member Institutions
1999-2000 to 2010-2011
$0 $5,000 $10,000 $15,000 $20,000 $25,000 $30,000 $35,000 $40,000 $45,000
1999-2000
2000-2001
2001-2002
2002-2003
2003-2004
2004-2005
2005-2006
2006-2007
2007-2008
2008-2009
2009-2010
2010-2011
Tuition & Fees Room & Board Comprehensive Charges
Maximum State Grant Maximum Pell Grant
Table 2
State Grant Recipients and Dollars Received at Minnesota Private College Council Member Institutions
2002-2009
Fiscal Years: MPCC
Schools
Total Recipients
Percentage Change
Total MN State Grant $
Received
Percentage
Change
2002
11,166
$36,628,000
2003
10,396
-6.90%
$33,383,000
-8.86%
2004
10,769
3.59%
$31,980,000
-4.20%
2005
9,883
-8.23%
$30,322,000
-5.18%
2006
9,250
-6.40%
$28,991,000
-4.39%
2007
9,751
5.42%
$33,491,000
15.52%
2008
9,841
0.92%
$33,160,000
-0.99%
2009
10,011
1.73%
$33,066,000
-0.28%
Chart 7
Percent Change in Average Charges
at Minnesota Private College Council Member Institutions
Current Dollars
2000-2001 to 2010-2011
0% 1% 2% 3% 4% 5% 6% 7% 8%
2000-2001 2001-2002 2002-2003 2003-2004 2004-2005 2005-2006 2006-2007 2007-2008 2008-2009 2009-2010 2010-2011
P
e
rcent Change
Tuition and Fees Room and Board Comprehensive Charges
The 4.5 % increase in tuition and fees between 2009-2010 and 2010-2011 is the smallest since 1978-1979