1
Why do we tenure?
Analysis of a long standing risk-based explanation
Jonathan Brogaard, Joseph Engelberg , Edward Van Wesep
First Draft: May 2016
Current Draft: May 2016
Abstract: Using a sample of all academics that pass through top 50 economics and finance departments between 1996 and 2014, we study whether the granting of tenure leads faculty to pursue riskier ideas. We use the extreme tails of ex-post citations as our measure of risk and find that both the number of publications and the portion that are “home runs” peak at tenure and fall steadily for a decade thereafter. Similar patterns holds for elite (top 10) institutions, for faculty with longer tenure cycles, and for promotion to Full Professorship. We find the opposite pattern among poorly-cited publications: their numbers steadily rise after tenure. The decline in both the quantity and quality of publications points to tenure incentivizing less effort in publishing rather than more risk-taking.
Keywords: Tenure, Incentives, Contracting, Compensation, Publication
JEL: J24, J33, J44, M12, M52
* We thank seminar participants at University of Colorado Boulder. We also are grateful for research support from Kothai Priyadharshini Alagarsamy, Jonathan Bannick, Hadley Evarts, Rui Han, Tarun Patel, Ryan Skorupski, Maia Szafer, and Che Zhang.
2 1. Introduction
The granting of tenure has been enshrined since at least 1940 as a basic tenet of academic contracting,1 and is now pervasive among American universities: every one of U.S. News and World Report’s top 500 colleges in the United States has some kind of tenure-granting system. But is tenure part of an optimal contract? The costs of tenure should be clear: employment guarantees remove one of the strongest incentives for effort that workers face. But there are potentially many benefits: academic freedom allows faculty to research and teach what they consider important, without fear of firing. If this allows for more innovative research, as theory suggests that it might, then tenure may be optimal, even in the face of the loss of effort incentives.
The argument is simple: if society benefits most from “home run” ideas – e.g., Ackerlof (1970)’s market for lemons or Einstein (1905)’s theory of special relativity – then academic contracts should provide incentives for risk-taking, whether it takes the form of (i) arguing for ideas that run contrary to popular or academic opinion, (ii) writing about novel topics, which may die in obscurity or may be seminal, or (iii) simply working on a difficult problem for which effort and talent are no guarantee of success. Tenure protects researchers from dismissal that might accompany the ridicule or, more likely, the lack of citations and publications that accompany failed risks. As shown in Manso (2012), motivating innovation requires rewarding success, but also protecting researchers in the case of failure. In the absence of tenure, academics have an incentive to “play it safe”, which may be personally optimal, but will rarely lead to ground-breaking ideas.
To determine the effect of tenure on academic effort and risk-taking, we measure both the quantity and quality of academic publications in the years surrounding tenure. We hand collect a sample of all academics who pass through economics or finance departments at top 50 US schools between 1996 and 2014. From this sample of over 2000
3
faculty we consider two variables in the years before and after each academic receives tenure: the number of publications, and the number of “home run” publications, where a home run is a paper that is among the 10% most cited of all papers published that year.2 The number of publications is a measure of the quantity of output, and the number of home run publications is a measure of the quantity of highly influential output, which is presumably more likely to result from risky ventures.
We find that both variables have values that peak at tenure and decline thereafter. The average number of annual publications falls approximately 25% within five years of tenure, a statistically and economically significant drop of approximately a quarter of a publication per year. The average number of home runs falls by more than 30% per year over the same span. Further, the probability that any given publication is a home run falls post-tenure as well. This likelihood also peaks in the tenure year, and falls by two to five percentage points within five years of tenure. Given that only 20% of papers in the sample are home runs, this is a highly significant drop in quality.3
Together, these numbers suggest that, if risk-taking does increase post-tenure, these risks are not successful in producing home run papers. Instead, the results are most consistent with academics increasing effort over time up to the tenure year, and reducing their efforts thereafter. Further, the reduction in effort is not driven by reducing the number of lower quality publications, and focusing upon higher quality work. Instead, it appears that academics can exert effort toward both quantity and quality, and reduce both post-tenure.
To support this (dismal) conclusion, we evaluate three alternative explanations for the publication and citation data. A first possibility is that productivity naturally increases post-PhD for some number of years before declining, and that the year tenure is granted just happens to be the natural peak in productivity. Perhaps the length of a typical tenure clock was chosen specifically to match peak academic productivity. This possibility seems unlikely, as people finish their PhDs at a variety of ages, and the peak age for productivity
2 Using 1%, 5%, or 20%, yield similar results. A threshold closer to zero makes the papers labeled “home runs” more aptly named, but also increases noise due to a reduced count of home runs.
4
likely depends upon the discipline, but the tenure clock is set at the university level.4 Theoretical problems aside, we want to more precisely evaluate this possibility, and separate the sample into academics who received tenure five, six, seven, etc., years after finishing their PhDs. The number of observations in each group are much smaller than for the full sample, so there is considerably more noise in our estimates. Nonetheless, within each sub-group, productivity, measured both with the production of papers and the production of home run papers, peaks in the years surrounding the granting of tenure, and declines thereafter. Academics who receive tenure after five years see their productivity fall starting in year six, while those who receive tenure in 10 years see their productivity fall starting in year 11. These results are hard to reconcile with an explanation that does not relate specifically to tenure. Given that those receiving tenure only five years after getting a PhD are probably superior researchers, one would not expect their productivity to be falling at a time when the productivity of less talented researchers is rising.
A second possibility is that the reduction in productivity post-tenure may be due to the fact that tenured faculty face more teaching or service obligations that sap time. This would naturally reduce the number of papers that they could write. Presumably, however, faculty could identify higher and lower quality opportunities, and focus their limited time on higher quality opportunities. Therefore, even if there were no change in risk-taking, the probability that a published paper is a home run should increase post-tenure, even as the number of papers decreases. Even assuming that researchers couldn’t tell the difference between a paper that is likely to be a home run and one that is not, we certainly should not see a decrease in the probability that a publication is a home run. We do not see this occurring: both the number of home runs and the probability that a paper is a home run decrease post-tenure.
A third possibility is that publications around tenure rise either because (i) people time their publications to arrive when they are put up for tenure and delay work on projects that will not succeed by that date, or (ii) many people are granted early tenure
5
after a string of successful publications.5 These possibilities are almost certainly at work in the data. However, we document a steady decline in the number of publications, the number of home run publications, and the fraction of publications that are home runs from two years to ten years after tenure. This decline cannot be attributed to either of these explanations.
We attribute the decline in the quantity and quality of research output post-tenure to a reduction in effort incentives, but the threat of termination is by no means the only incentive that academics face. To find support for our explanation, we consider another publicly observable event around which there is likely to be a significant change in incentives: the promotion to Full Professor. Full Professorship is often associated with a substantial increase in pay, as well as rights to contribute to university decision-making. We therefore expect a similar effect of promotion to Full Professor on the number and quality of publications. We find that the number of publications per year rises until two years prior to a professor attaining the rank of Full Professor, and falls steadily over the next 12 years. The same pattern is apparent for the number of home runs per year. The percentage decrease in each variable is nearly identical to the post-tenure period, and doubly significant.
These results collectively suggest that the primary effects of tenure and promotion to Full Professor are a reduction of a professor’s efforts toward the quantity and quality of publications. We do not find an increase in risk-taking or a concentration on high-value projects post-tenure. While these results are largely negative toward the granting of tenure, we note that there are potential benefits that we have not evaluated. These range from the traditionally economic – the carrot of tenure can incentivize effort pre-tenure, allow for lower salaries, or induce risk-averse but talented individuals to choose academia over other, less socially beneficial, industries – to the more philosophical. Therefore, this paper should not be seen as making a broad case against tenure.
6 2. Literature review
There is a substantial theoretical literature on the purpose of tenure, and a smaller empirical literature. Perhaps the oldest, and best known to both academics and non-academics, is that tenure supports academic freedom. The “philosophical birth cry” (Metzger, 1973) of academic tenure was the 1915 statement of the American Association of University Professors (AAUP). It was formalized in the 1940 Statement of Principles on Academic Freedom and Tenure, a joint statement of the AAUP and the Association of American Colleges (AAC), that “[t]enure is a means to certain ends; specifically: (1) Freedom of teaching and research and of extramural activities and (2) a sufficient
degree of economic security to make the profession attractive to men and women of
ability. Freedom and economic security, hence, tenure, are indispensable to the success
of an institution in fulfilling its obligations to its students and society.”
Among economists looking for alternative explanations, Ito and Kahn (1986) identify tenure as an example of wage floor, which is useful in reducing the risk that workers face. As this explanation is not particularly specific to academia or other settings with tenure (e.g., professional partnerships), other explanations have since been put forth. Most important is that of Carmichael (1988), which argues that the people at a university most able to identify high quality hires are existing faculty, who could fear losing their jobs if they hire too well. Protecting them from job loss allows them to hire the best. This argument has been extended in various ways since it was first made, notably by Friebel and Raith (2004), who show how requiring information to flow through “chains of command” can mitigate the problem without tenure.6 Siow (1988) further extends Carmichael (1988) by adding specialization of knowledge and research obsolescence to the information asymmetry between faculty and the administration to find that other distinctive features of academic contracting arise.
Brown (1997) argues that universities, as non-profits, have unusual organizational needs. Specifically, somebody must monitor university leaders. Tenure, which both
7
protects senior faculty from dismissal and makes them residual claimants, gives senior faculty the incentive to properly monitor university leadership.
Finally, Manso (2012) considers a model in which agents are faced with three options: they can undertake a task with a known payoff, attempt to innovate, or shirk. Because shirking and failing at innovation look the same to the principal, some incentives are required to prevent shirking. However, some protection from punishment is necessary to induce innovation over playing it safe. Tenure can arise as optimal in this setting. We consider many of the analyses in this model to be tests of Manso (2012).7
There has been limited empirical work on the effect of tenure across a variety of disciplines, and no consistent results. To the best of our knowledge, the three studies that most specifically address the effect of tenure on productivity are Holley (1977), Li and Ou-Yang (2010), and Nikolioudakis, Tsikliras, Somarakis, and Stergiou (2015). Holley (1977) evaluates the productivity, both in terms of quantity and quality, of 97 sociologists surrounding their tenure dates. He finds decreased performance on both dimensions post-tenure. Nikolioudakis, Tsikliras, Somarakis, and Stergiou (2015) evaluate a sample or approximately 2,000 current Full Professors in the sciences and find that annual publication rates increased across subjects, geographies, and university ranks. However, this study contains only post-tenure productivity, so it is difficult to make inferences about the effect of tenure on productivity. Further, if the sciences are similar to Economics and Finance, publication rates have been rising over time, so we should not be surprised by increasing publication rates over time for Full Professors. Li and Ou-Yang (2010) focus on economics and finance faculty from top twenty-five schools, and find no statistically significant difference in impact pre- and post-tenure. This result is substantially different from what we find, and we discuss the likely basis for that difference in Section 5, but, briefly, our sample is considerably larger and more comprehensive. We include more schools, more journals, and more professors.
There is a much more substantial literature on the effect of age on research productivity. Oster and Hamermesh (1998) find that economists’ productivity declines
8
sharply with age, both for top researchers and those who publish less frequently. Levin and Stephan (1989) find a hump shaped productivity among academic scientists, where productivity first rises and then falls. These studies do not account for researchers’ tenure dates, so do not disentangle whether the hump shape is truly due to age or to incentives.
Other empirical work considers the effect of tenure on other aspects of the contracting problem. Ehrenberg and Zhang (2005) find that the recent trend toward increased use of non-tenure-track faculty has hurt graduation rates, especially at public masters level institutions. Ehrenberg, Pieper, and Willis (1998) find that economics departments with lower tenure probabilities pay less to assistants and more to tenured faculty, suggesting compensation for the assistants, and positive sorting for tenured professors.
3. Data and methodology
To construct our sample, we hand collected employment and publishing data. We include all faculty who were employed at any of the top 50 economics or finance departments in the United States in any year between 1996 and 2014. To determine the top 50 departments, we rely on the rankings of Conroy, Dusansky, Drukker, and Kildegaard (1995). Table 1 reports the schools, listed in alphabetical order.
Insert Table 1 About Here
We use a department ranking created before the sample period so as to minimize any bias due to a department growing or falling in prestige during the period of study.
9
to archiving all content on the internet. Waybackmachine.org collects data periodically back to 1996. Most schools in the sample have websites going back to 1996, although several start in later years. This allows us to construct a sample of nearly all faculty employed at these schools in any year from 1996 to 2014. For each faculty member, we use an internet search to find her most recent CV, so that we have data for appointments even if she left the top 50 prior to 2014. In total, we collect 2,763 names, 2,092 of whom are eventually granted tenure at some point prior to 2014. In our work below, we require a researcher to be in academia at least five years prior to tenure, and five or ten years after tenure. This reduces our sample to 1,331 researchers who are in academia at least five years after being granted tenure, and 980 who are in the sample for at least ten years post-tenure.
In addition to the faculty name, school, and year, we collect data on the position of the faculty member. The categories include Assistant, Associate, Full, Visiting, and Emeritus. Typically schools grant tenure at the same time that a faculty member is promoted to Associate Professor, though there are exceptions at each school, and some regularly grant tenure several years after promotion to Associate (and, in the case of Harvard, tenure is only granted at promotion to Full Professor). To determine when a faculty member was granted tenure, we employed a multi-step process.
First, we determined the prevailing policy for when tenure is granted at each school. This required finding faculty who disclosed the year that they were granted tenure on their CVs. If all disclosing faculty from a single school received tenure at the same position (for example, immediately upon appointment to Associate professor), then we determined that this was the standard for the school. This accounts for the vast majority of schools in the sample. Next, we contacted department representatives, most often faculty, to inquire about the standard at each school. The standards resulting from this process matched the standards determined from CVs.
10
appointment to Associate Professor (e.g., University of Chicago), we contacted department faculty who were aware of the professor’s date of tenure.
Third, for a random sample of faculty, we contacted either them or their colleagues to confirm the assigned tenure year. This process was surprisingly consistent, with few examples where our tenure time assignment was incorrect. If it was incorrect, it typically was an instance in which (i) a faculty member moved to a new school and was simultaneously promoted from Assistant to Associate Professor, (ii) the new school tenures internal candidates at the Associate level, and (iii) the new faculty member received tenure only after one or two years at the new school. It is not possible to fully correct for this potential error in the data, but the number of observations subject to this potential problem is well under 1/10 of the sample, and the fraction of those observations that are likely to be in error is small. Further, this error can only serve to weaken our results.
After collecting the set of faculty and their tenure years, we match this database with a database of publications and citations for 30 leading economics and finance journals. The collection and composition of this database is described in Brogaard, Engelberg and Parsons (2014). Merging the datasets requires standardizing school and faculty names. The former is straightforward but, because we cannot systematically distinguish publications among faculty members with common names (e.g. Beth Allen, Belinda Allen, Brandon Allen, Bryant Allen and Bryon Allen all share a Web of Science name Allen, B) we remove those faculty who have the same name as each other. There is some discretion here: William J Adams of University of Michigan shares a Web of Science name with Walter Adams, but William has many publications and Walter has one, in 1951. In cases like this, the error from assigning the name to William is less than the loss to data from excluding him from the sample, so we keep his observations.
The data-collection process leaves some errors in the data, but the number is likely to be small, and any errors in the tenure date are likely to be one year, or two at most. These errors, when present, will weaken our results, not strengthen them.
11
In this section, we describe our basic results. We show that the rates of publication of papers and home run papers increase up to a researcher’s tenure date, and decline for ten years thereafter. We then investigate the cause of this phenomenon, and show that results are most consistent with researchers reducing effort toward both the quantity and quality of publications after getting tenure. We reject that the results can be fully explained by a natural learning/aging process, by an increase in other opportunities or obligations post-tenure, and by the endogenous timing of the tenure and publication decisions (though each of these may be relevant as well).
a. Baseline results
We begin by evaluating a subset of faculty who are present in our data for at least five years prior to their tenure year, as well as ten years after. We require pre- and post-tenure data to avoid spurious results. Some faculty were granted tenure less than five years from their first appearance in our sample. This was usually because they began their careers at government agencies in which they may not have been expected to publish to the same degree as in academia. Some faculty left academia less than ten years post-tenure, or received tenure after 2004, and were unlikely to publish as often post-tenure. Therefore, to avoid including people who would mechanically strengthen the increase in observed publication rates prior to tenure and the decrease post-tenure, we exclude them.
This subset contains 980 faculty, all of whom received tenure prior to 2004. Figure 1, presents the number of papers published by this set of faculty in event time, where the event is the receipt of tenure.
Insert Figure 1 About Here
12
We also calculate the number of “home run” publications, which are publications that were among the 10% most cited, as of 2014, of all papers published in a given year. The plot of the number of home runs is largely similar to the plot of publications, peaking in the tenure year and falling thereafter. We can also calculate the likelihood that any given paper becomes a home run by, in each year, dividing the number of home runs by the number of publications. This series is volatile, but shows some increase prior to tenure, rising from approximately 20% in the years prior to tenure to 22% in the year of tenure. The likelihood of a publication becoming a home run then falls steadily, to nearly 16% ten years after tenure.
Together, these facts provide suggestive evidence that tenure is associated with peak academic production, in terms of the quantity of publications, the quantity of home run publications, and the likelihood that a given publication becomes a home run.
These plots simply display the number of publications without any adjustment for the number of authors on a publication. One way to change one’s effort without having a large effect on publication rates is to co-author with more faculty. In Figure 2, Panel A, we plot the average number of co-authors in event time, where the event is a researcher’s year of tenure.
Insert Figure 2 About Here
Because the average number of authors per paper has increased substantially over time, we calculate the average abnormal authors per publication, where we subtract the average number of co-authors of all papers published in a given year from the number of co-authors on a given paper.
13
To calculate an author’s contribution to her papers, we define her contribution to a publication to be 1/N, where N is the number of authors on the publication. If she is part of a three-authored publication, she is credited with 1/3 of a publication. If she is part of a two-authored home run publication, then she is credited with ½ of a home run. Figure 2, Panel B, reproduces the data from Figure 1, Panel B, with two adjustments. First, we plot the author-adjusted publications per year, rather than the raw publications per year, in tenure time. Second, we plot the total author-adjusted home runs per year. Note that this is not the fraction of publications that become home runs, as in Figure 1, but the total number of author-adjusted home runs.
We see that, as in the un-adjusted plot, production of both publications and home run publications peaks in the year of tenure, falling consistently for ten years after. Interestingly, adjusting by number of authors removes much of the noise shown in Figure 1 – some authors have particularly good years by producing several papers with a large number of co-authors, so when this practice is properly discounted, we lose much of the noise in our sample.
Table 2 shows the results of regressions designed to estimate the statistical significance of the changes in publication rates shown in Figure 2, Panel B.
Insert Table 2 About Here
We estimate variants of the following linear model:
ܲݑܾ,௧ = ߙ + ߚ௧+ ߛ+ ߜ,௧ିହ,ିଵܫ,௧ିହ,ିଵ+ ߜ,௧ାଵ,ାହܫ,௧ାଵ,ାହ+ ߜ,௧ା,ାଵܫ,௧ା,ାଵ+ ߝ,௧
where ߚ௧ is a year fixed-effect designed to capture differential publication rates over time, ߛ is a researcher fixed-effect designed to capture differential publication rates across researchers, ܫ,௧, is a dummy variable taking a value of 1 if, in year t, researcher i is between m and n years from tenure (with positive values of m and n representing
14
The excluded year for researcher i is her tenure year, so all coefficients are average publication rates relative to a professor’s tenure year. Depending on the regression, ܲݑܾ,௧
may represent the overall author-adjusted number of publications, or the author-adjusted number of home run publications for researcher i in year t.
In Column 1 of Table 2, we perform a simple analysis with no year or author fixed effects. This regression ignores the facts that publication rates have increased over time, and that some authors publish more than others. We see that, on average, 0.155 fewer author-adjusted publications occur in the five years prior to tenure, 0.178 occur in the five years after, and 0.237 occur in the five years following that. Publications are lower before and after tenure, and even lower the farther after tenure one gets.
In Column 2 of Table 2, we add year fixed effects to account for the fact that publication rates have increased over time, and in Column 3 we add year and researcher fixed effects. The inclusion of year fixed effects alone does little to affect the coefficients on years from tenure dummy variables. The inclusion of researcher fixed effects, however, has a substantial effect on both coefficients and R-squared values from the regressions. These findings are notable: by design, researcher fixed effects will absorb substantial variation in publication rates, as shown by the substantial increase in R-squared from Column 2 to 3. The effect of time post-tenure is substantially strengthened, perhaps by a reduction in measurement error leading to less attenuation bias.
In Columns 4-6 of Table 2, we repeat the analyses of the first three columns, and find substantial reductions in the rate at which authors produce home run papers, both in periods before and after tenure. As in Columns 1-3, the number of home runs produced decreases in the five years after tenure, and continues to decrease in the five years after that.
15
In order to assess whether tenure is associated with greater risk-taking, we go beyond the likelihood that a given paper is a home run: risk can lead to low citations as well as high. In Figure 3, we assign each paper a category based upon its citations – if it was in the top 10% of citations for papers published in that year, it is still called a home run.
Insert Figure 3 About Here
If it is in the lowest 10%, we call it a bomb. We further split papers into 10th to 25th percentile, 25th to 50th percentile, 50th to 75th percentile, and 75th to 90th percentile groups. We calculate the number of papers published by authors from five years before to 10 years after tenure. To make the comparison clearest, we divide those numbers by the number of papers in each citation bucket in the year of tenure.
Figure 3 shows that publication rates of all paper types increase in tandem up to the year of tenure, but there is substantial divergence afterward. The number of bombs continues to increase post-tenure, while the number of papers that end up in the 10th to 50th percentiles are relatively constant. Above median papers are less and less common the farther the author is from her tenure date. If tenure led to more risk-taking, we would expect to see the frequency of both bombs and home runs increase, while middling categories would fall, post-tenure. Instead, we see that above-median publications fall and below-median publications are flat or increasing. We interpret this as evidence that, if risk-taking increases post-tenure, it is outweighed by lower effort toward quality.
b. Alternative explanations for productivity declines post-tenure
In this section we consider three alternative explanations for the patterns shown thus far that could help explain our findings. We will show that none of the three, nor the three collectively, can fully explain the patterns that we see. While they all are likely at work, a reduction in effort seems to be relevant as well.
16
It has been shown that academic productivity increases post-PhD for some time before decreasing (e.g., Oster and Hamermesh, 1998). This may be due to aspects of the profession: for example, learning-by-doing may cause a researcher’s productivity to increase over time, while a shift in skills and interests of the profession causes productivity to decline. This may also be due to aspects of the human brain: for example, a researcher’s knowledge and wisdom may increase with time, while her “processing power” decreases. In either case, there may be a natural point at which the positive and negative aspects offset, making productivity peak at some time. Perhaps it is the case that tenure tends to be granted at that natural peak.
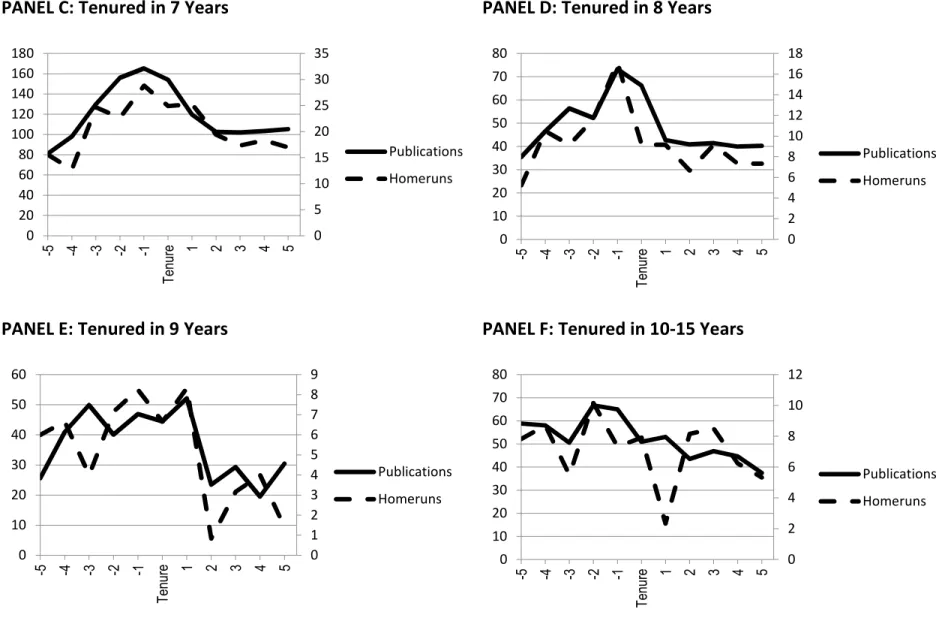
In order to investigate this possibility, we split the sample by whether a researcher was granted tenure in her fifth year, sixth year, etc. The sample in each case is substantially smaller than for the full sample, adding noise to our plots, so we make two adjustments that will improve the sample. First, we adjust our sample to include faculty who are in the sample for at least five years after tenure, as opposed to ten. This increases the sample size nearly 40%, to 1,331 members, relative to requiring that faculty must be in the sample for 10 years post-tenure. Second, the number of faculty receiving tenure many years after a PhD is too low to meaningfully describe in a plot, so we group all faculty who receive tenure after 10-15 years together. Note that the number of faculty differs by tenure year, so the fact that faculty tenured in six years publish more papers than those tenured in five should not suggest that they are more productive, on a per-researcher basis. Figure 4 displays the results.
Insert Figure 4 About Here
17
but the general shape persists: people publish more and better papers in the run-up to tenure, and fewer after.
These facts suggest that it is not simply aging that is causing the patterns observed in Figures 1 and 2: the year of tenure itself is special, not the years since graduate school.
ii. Service, teaching, and non-academic obligations increase post-tenure
It is possible – even likely – that many faculty in our sample experience increased expectations of university service after tenure, whether it be in a leadership (e.g., dean, department chair) or administrative (e.g., committee member) capacity. It is also common for senior faculty to have more difficult teaching loads, teaching more classes and fewer sections of each class. Finally, tenured faculty often have more opportunities for consulting, book-writing, etc., after tenure. All of these factors would reduce publication rates, even if the researcher’s aggregate career effort increased post-tenure.
We therefore do not take a strong stand in this manuscript as to whether tenure, per se, reduces overall effort. It reduces research output, but perhaps because tenure is
associated with other opportunities or obligations, not because tenure causes slothfulness.
18
as we do for non-author-adjusted numbers, we see a ratio falling from 20% in the year of tenure to nearly 14% ten years later. These are economically substantial declines.
Note that this discussion assumes simply that researchers abandon projects that are, in expectation, less likely to be successful. The increase that we should see in the likelihood of a publication being a home run need not be related toward risk-taking or effort toward quality. Even if it is not possible, ex ante, to distinguish a future home run from a future bomb, we should see the fraction of publications that become home runs stay flat after tenure. Yet we see a decrease. This suggests that, while non-research post-tenure obligations may affect productivity, there is more to the story.
iii. Tenure is given when publications hit a certain threshold
Many schools grant tenure early. Schools with a long tenure clock, or that allow ways for researchers to extend their tenure clocks (for example, by delaying their official date of PhD receipt or by having a baby), may have substantial leeway in when to grant tenure. If an Assistant Professor begins with the expectation of going up for tenure at the start of year seven after graduation, and has a run of successful publications in the first four years of her career, it would not be uncommon for her department to put her up for tenure early, in year five. Therefore, a string of successes, which is, in part, random, can result in an early tenure. As there is a lag between when a paper is accepted for publication and when it is in print, we may see a spike in publications in the year of tenure more because of randomness in the publication process than because of effort. Lazear (2004) described this as a theoretical explanation for the Peter Principal.
This process almost certainly occurs in our dataset, and it may account for all or part of the spike in publication in the year before and year of tenure. However, it cannot explain the drop in publications and home runs from two to 10 years after the tenure year shown in Figure 2, Panel B. Regression evidence confirms this in Table 2, where in all six regressions, publication rates are lower in years six to 10 after tenure than years one to five. Granting tenure as a consequence of a run of publications cannot explain this drop.
19
It is possible that a researcher times her publications so that they arrive in the year she comes up for tenure. For example, somebody who has to submit a tenure packet in one year might delay work on a paper which is likely to be published in two years, and focus instead on a paper that could be published this year if it is given appropriate attention. We would expect to see a spike in publications in the year she comes up for tenure and, because of publication lags, her first year tenured.
As in the discussion of possibility (iii) above, this process almost certainly occurs in our dataset, and it may account for all or part of the spike in publication in the year before and year of tenure. However, it cannot explain the drop in publications and home runs from two to 10 years after the tenure.
Taken together, each of these four alternative explanations is consistent with an aspect of our results, but inconsistent elsewhere. Tenure causing a decrease in effort toward both quantity and quality stands as a likely element of the facts we document.
c. Results for a Subset of Elite Faculty
The preceding results are disappointing, in that they support the case that faculty exert less effort toward the quantity and quality of research after getting tenure, but it may be the case that this is true only for a subset of faculty. Perhaps faculty at the most prestigious departments, who produce the lion’s share of truly influential papers, exhibit a different pattern of publication after tenure.
In Figure 5, we perform the same analysis as in Table 2, Panel B, and plot author-adjusted publications and author-author-adjusted home runs for five years pre- to 10 years post-tenure, but restrict the sample to faculty who begin their careers at a subset of particularly prestigious schools: University of California, Berkeley, University of Chicago, Columbia University, Harvard University, Massachusetts Institute of Technology, Northwestern University, University of Pennsylvania, Princeton University, Stanford University, and Yale University.
20
As in each of our sub-samples thus far, publications and home runs peak in the year the researcher is up for tenure, and in her first year of tenure. Both fall consistently for 10 years post-tenure. There is more noise than for the full sample, but the pattern is striking. Faculty who begin their careers at elite schools have the same publication pattern as those who begin elsewhere.
d. Promotion to Full Professor
Our results are most consistent with faculty reducing their effort toward the quantity and quality of publications once they are granted tenure. While we do not have any proof of causation, these reductions are consistent with standard agency theory: when incentives for effort go down, one should expect effort to decrease as well.
In order to further test this claim, we repeat our analysis for faculty who are promoted to Full Professor. This promotion is often accompanied by a substantial pay raise, and achieving it removes an incentive for further effort. In Figure 6, we repeat the analysis of Figure 2, Panel B, and plot author-adjusted publications and home runs for five years before to 10 years after promotion to Full Professor.
Insert Figure 6 About Here
The sample is simply a subset of our earlier sample who are promoted to Full Professor at least ten years before 2014, when our panel ends.
The pattern of publications and home runs is similar to our previous figures, but with one notable difference: the peak in publications and home runs occurs two years prior to promotion to Full Professor. We do not have an explanation for the early peak, but the general pattern appears similar to the patterns around tenure. We believe that this is further evidence that incentives matter – remove them and effort is likely to fall.
21
Our results concerning the decrease in production post-tenure are in contrast to Li and Ou-Yang (2010)’s working paper, which finds that publication and citation rates are unaffected by tenure. Their result is surprising, in light of fairly standard agency theory, so to better understand why our results differ from theirs, it is worth a discussion of the differences in our approach from theirs. There are four major differences.
Li and Ou-Yang (2010) construct a sample of faculty currently tenured, as of 2002, at top 25 schools, who started their careers between 1965 and 1987. The restriction to the top 25 schools selects for superior faculty, and limiting the sample to faculty employed in 2002 both limits the number of faculty included, and selects for faculty that remain in academia post-tenure. To get tenure dates for most faculty in the sample, they emailed faculty and had response rates of approximately 44% for the 296 Economics faculty emailed, and 44% for the 154 Finance faculty emailed.
This sample construction differs from ours in three potentially important ways. First, the sample is small: they have 249 faculty, while our analyses have as many as 1,331. Second, they restrict attention to faculty at top 25 schools in 2002. Our faculty must pass through a top 50 school at some point between 1996 and 2014. We therefore select for less elite faculty, both because 50>25 and because our faculty can even be at a non-top-50 school by the end of our sample period. Third, to get tenure dates, Li and Ou-Yang (2010) relies on voluntary responses. The response decision plausibly correlates with whether a queried professor is still active in research. That is, faculty may be more likely to respond if they are research-active, and this selection will naturally show less of a drop-off in production post-tenure.
The fourth difference between their work and ours is the method of analysis. In order to estimate the effect of tenure on production, Li and Ou-Yang (2010) estimate a Poisson arrival model, and include a dummy variable which takes a value of one if the researcher has tenure. The null is that the coefficient on this dummy variable is zero: publication rates pre- and post-tenure are no different.
Ou-22
Yang (2010)’s sample includes 249 faculty, relative to 1,331 in our largest sample. Nearly all of their analyses find negative effects of tenure on output and the quality of output, but the effects are, more often than not, statistically insignificant. Given the standard errors they report, it appears likely that with our sample size, they would have found statistical significance (assuming that the incremental faculty are statistically similar to their sample).
Second, their regressions estimate a Poisson arrival model and include a dummy variable for whether the researcher has tenure. As we show, there is a significant increase in productivity in the years prior to tenure and a somewhat weaker decrease after. If we simply take an average of publication rates in the five years prior to tenure and the five years after tenure, we would find higher rates after, simply because the run-up in production pre-tenure is steeper than the drop-off in production post-tenure. It is therefore important not just to capture averages pre- and post-tenure, but slopes as well. We do this by comparing averages pre- and post-tenure to the tenure date itself, and allowing for a larger change the farther one gets from tenure.
We do not believe that the inclusion of more elite faculty is the source of the difference. Figure 5 in our paper shows the same basic publication pattern for faculty who begin their careers at elite schools as for everyone else. While Li and Ou-Yang (2010) consider only faculty who are tenured at elite schools – a more stringent requirement than simply starting a career at one – the lack of a difference for faculty who start at top-10 schools and everyone else suggests that this is not the source of the difference in results.
Finally, there is likely selection into responses to their emails requesting tenure dates. Responding to emails asking about one’s career plausibly is associated with the type of career one has had. However, they find consistently negative point-estimates of the effect of tenure on publication rates. With our sample size, these would likely have been significant. Therefore, it is unclear whether this selection was important.
23 6. Conclusion
We have presented a series of figures showing that rates of publications and home run publications rise to the year of tenure and fall for a decade thereafter. This is especially true when between-professor variation is removed with researcher fixed effects in a regression framework. We show that this is true whether faculty are tenured in five, six, seven, etc., years, suggesting that it is tenure, not simply the passage of time that accounts for these results. We show a similar pattern surrounding promotion to Full Professor, which is further evidence against the “passage of time” explanation.
We show that the decline happens for at least 10 full years after tenure is granted, which means that it can be accounted for neither because tenure might be granted when researchers happen to be doing well, nor because publications may be timed to arrive in a pre-set tenure year.
We believe that the most likely explanation is that the granting of tenure is the removal of an incentive to work hard, and effort responds to incentives. This should not be surprising. We also, however, find that faculty do not appear to increase their risk-taking after becoming tenured. The rate of publications of bombs, which are in the bottom 10% of citations in a given year, increases substantially, which is consistent with greater risk-taking, but the rate of publication of home runs falls, which is not. Instead, these facts seem most consistent with a reduction in effort toward quality.
24 References
Brown, William O. Jr. (1997) University Governance and Academic Tenure: A Property Rights Explanation, Journal of Institutional and Theoretical Economics 153 (3), pp. 441-461
Carmichael, Lorne H. (1988) Incentives in Academics: Why is there Tenure? Journal of Political Economy 96 (3), pp. 453-472
Demougin, Dominique and Aloysius Siow (1994) Careers in Ongoing Hierarchies, American Economic Review 84, pp. 1261-1277
Ehrenberg, Ronald G., and Liang Zhang (2005) Do Tenured and Tenure-Track Faculty Matter? The Journal of Human Resources 40 (3), pp. 647-659
Ehrenberg, Ronald G., Paul J. Pieper, and Rachel A. Willis (1998) Do Economics Departments with Lower Tenure Probabilities Pay Higher Faculty Salaries? The Review of Economics and Statistics 80 (4), pp. 503-512
Friebel, Guido, and Michael Raith (2004) Abuse of Authority and Hierarchical Communication, RAND Journal of Economics 35 (2)
Holley, John W. (1977) Tenure and Research Productivity, Research in Higher Education 6, pp. 181-192
Ito, Takatoshi, and Charles Kahn (1986) Why is there Tenure? Center for Economic Research Discussion Paper, No. 228
Kahn, Charles, and Gur Huberman (1988) Two-sided Uncertainty and “Up-or-Out” Contracts, Journal of Labor Economics 6, pp. 423-444
Lazear, Edward P. (2004) The Peter Principle: A Theory of Decline, Journal of Political Economy 112 (1), pp. 141-163
Levin, Sharon G., and Paula E. Stephan (1989) Age and Research Productivity of Academic Scientists, Research in Higher Education 30 (5), pp. 531-549
Li, Si, and Hui Ou-Yang (2010) Explicit Incentives, Implicit Incentives, and Performance: Evidence from Academic Tenure, SSRN Working Paper
McPherson, Michael S. and Morton O. Shapiro (1999) Tenure Issues in Higher Education, Journal of Economic Perspectives 13, pp. 85-98
Nikolioudakis, Nikolaos, Athanassios C. Tsikliras, Stylianos Somarakis, and Konstantinos I. Stergiou (2015) Tenure and Academic Deadwood, Ethics in Science and Environmental Politics 15, pp. 87-93
25
Sengupta, Sarbajit (2004) Delegating Recruitment Under Asymmetric Information, International Journal of Industrial Organization 22 (8-9), pp. 1327-1347
Siow, Aloysius (1998) Tenure and Other Unusual Personnel Practices in Academia, Journal of Law, Economics & Organization 14 (1), pp. 152-173
26 Figure 1: Publications and Home runs around Tenure
This figure plots both the number of publications and the number of those publications which were “home runs” in event time, where the event is tenure. A home run is a publication in an economics or finance journal which has more citations than 90% of all economics and finance publications published in the same year. The sample is 980 faculty for whom we observe at least 5 years before tenure and 10 years after tenure. Publications are the sum of the cohort’s publications (in event time).
60 80 100 120 140 160 180 200
300 400 500 600 700 800 900 1000
-5 -4 -3 -2 -1 Tenure 1 2 3 4 5 6 7 8 9 10
Publications
27 Figure 2: Adjusting for Number of Authors
Panel A plots the abnormal number of authors per publication as a function of tenure. For each article in the dataset we calculate the abnormal number of authors as the number of authors on the publication minus the average number of authors per publication in that year (e.g. if an article had two authors and the average for the year was 1.5 then abnormal number of authors would equal .5). Panel A plots the average number of abnormal authors as a function of tenure. Panel B reproduces Figure 1, but now adjusts the total publication count by dividing each publication by the number of authors (e.g., an article with four authors counts as .25 of a publication).
PANEL A: Average Abnormal Authors per Publication
0 0.05 0.1 0.15 0.2 0.25 0.3 0.35 0.4 0.45 0.5
-5 -4 -3 -2 -1 Tenure 1 2 3 4 5 6 7 8 9 10
28 Figure 2 Continued
PANEL B: Publications and Home runs Adjusted for Number of Authors
25 50 75 100 125
250 350 450 550
-5 -4 -3 -2 -1 Tenure 1 2 3 4 5 6 7 8 9 10
Author-Adjusted Publications
29 Figure 3: Publications around Tenure by Citation Percentile
The figure plots the relative frequency of publications by citation percentile around tenure. Home runs (Bombs) are those above the 90th (below the 10th) percentile of all economics and finance papers in the same year. Pubs: 75th – 90th, Pubs: 50th – 75th and Pubs: 10th-25th are similarly defined. For each percentile group, a plotted observation is the ratio of publications published in that event year relative to the year of tenure (so that by construction the ratio = 1 for each group in the year of tenure).
0% 20% 40% 60% 80% 100% 120% 140% 160% 180% 200%
-5 -4 -3 -2 -1 Tenure 1 2 3 4 5 6 7 8 9 10
Homeruns
Pubs: 75th - 90th
Pubs: 50th - 75th
Pubs: 25th - 50th
Pubs: 10th - 25th
30 Figure 4: Publications and Home runs by Year of Tenure
Each figure plots both the number of author-adjusted publications and home runs in event time, where the event is tenure. A home run is a publication in an economics or finance journal which has more citations than 90% of all economics and finance publications published in the same year. Each panel considers a different time to tenure: 5, 6, 7, 8, and 9 years. The final panel considers all faculty tenured in 10-15 years. The sample includes 1,331 faculty who were tenured before 2009.
PANEL A: Tenured in 5 Years
PANEL B: Tenured in 6 Years
0 5 10 15 20 25 30 35 40 0 20 40 60 80 100 120 140 160
-5 -4 -3 -2 -1
T
e
n
u
re 1 2 3 4 5
Publications Homeruns 0 5 10 15 20 25 30 35 40 45 0 50 100 150 200 250
-5 -4 -3 -2 -1
T
e
n
u
re 1 2 3 4 5
Publications
31
Figure 4 Continued
PANEL C: Tenured in 7 Years
PANEL D: Tenured in 8 Years
PANEL E: Tenured in 9 Years
PANEL F: Tenured in 10-15 Years
0 5 10 15 20 25 30 35 0 20 40 60 80 100 120 140 160 180
-5 -4 -3 -2 -1
T
e
n
u
re 1 2 3 4 5
Publications Homeruns 0 2 4 6 8 10 12 14 16 18 0 10 20 30 40 50 60 70 80
-5 -4 -3 -2 -1
T
e
n
u
re 1 2 3 4 5
Publications Homeruns 0 1 2 3 4 5 6 7 8 9 0 10 20 30 40 50 60
-5 -4 -3 -2 -1
T
e
n
u
re 1 2 3 4 5
Publications Homeruns 0 2 4 6 8 10 12 0 10 20 30 40 50 60 70 80
-5 -4 -3 -2 -1
T
e
n
u
re 1 2 3 4 5
Publications
32 Figure 5: Publications and Home runs around Tenure for Elite Schools
This figure reproduces Figure 2, Panel B, for faculty that initially placed in a top school: Chicago, Yale, Princeton, Stanford, Northwestern, Penn, Columbia, Berkeley, MIT and Harvard.
20 30 40 50 60 70
100 150 200 250
-5 -4 -3 -2 -1 Tenure 1 2 3 4 5 6 7 8 9 10
Author-Adjusted Publications
33 Figure 6: Publications and Home runs around Promotion to Full
The figure considers the subset of tenured faculty which also were promoted to Full Professors and considers the same variables in event time as in Figure 2, Panel B.
30 40 50 60 70 80 90 100
240 290 340 390 440
-5 -4 -3 -2 -1 Full 1 2 3 4 5 6 7 8 9 10
Author-Adjusted Publications
34 Table 1: Schools
Table 1 list the schools used in this research. To determine the top 50 departments, we rely on the rankings of Conroy, Dusansky, Drukker, and Kildegaard (1995). The schools are listed in in alphabetical order.
Boston College SUNY-Stony Brook
Boston U. Texas A&M
Brown U. U. of Arizona
Cal Tech U. of California, Berkeley
Carnegie Mellon U. of California, Davis
Columbia U. U. of California, Los Angeles
Cornell U. U. of California, San Diego
Duke U. U. of California, Santa Barbara
Harvard U. U. of Chicago
Houston U. U. of Colorado, Boulder
Iowa State U. U. of Florida
Johns Hopkins U. U. of Illinois, Urbana
Michigan State U. U. of Indiana, Bloomington
MIT U. of Iowa
New York U. U. of Maryland
North Carolina State U. U. of Michigan
Northwestern U. U. of Minnesota
Ohio State U. U. of North Caroina, Chapel Hill
Penn State U. U. of Pennsylvania
Pittsburgh U. U. of Rochester
Princeton U. U. of Texas, Austin
Rice U. U. of Virginia
Rutgers U. U. of Washington
Southern Methodist U. U. of Wisconsin, Madison
35 Table 2: Publications and Home runs around Tenure
The dependent variable in the first (last) three columns is author-adjusted publications (home runs). Years – 1 to -5, Years +1 to +5 and Years +6 to +10 are the five years before tenure, the first five years after tenure and the next five years after tenure, respectively. The final row reports the p-value from a linear restriction test which tests the equality of coefficients on Years +1 to +5 and Years +6 to +10.
Dependent Variable Publications Publications Publications Home runs Home runs Home runs
Years -5 to -1 (Pre-tenure) -0.155*** -0.168*** -0.092*** -0.040*** -0.046*** -0.032***
(0.028) (0.028) (0.027) (0.112) (0.011) (0.011)
Years +1 to +5 (Post-tenure) -0.178*** -0.153*** -0.226*** -0.046*** -0.038*** -0.052***
(0.028) (0.028) (0.027) (0.011) (0.011) (0.011)
Years +6 to +10 (Post-tenure) -0.237*** -0.186*** -0.373*** -0.065*** -0.049*** -0.085***
(0.028) (0.028) (0.037) (0.011) (0.011) (0.015)
Observations 15680 15680 15680 15680 15680 15680
Year Fixed Effects NO YES YES NO YES YES
Person Fixed Effects NO NO YES NO NO YES
R-Squared 0.0072 0.0233 0.2780 0.0037 0.0161 0.2164
P-value for Test: