ISSN 1479-4403 1 ©ACPIL
Perceptions on ICT Integration Barriers
Lantip Diat Prasojo
1, Akhmad Habibi
2, Mohd Faiz Mohd Yaakob
3, Amirul Mukminin
2,
Septu Haswindy
4and Muhammad Sofwan
21
Universitas Negeri Yogyakarta, Yogyakarta, Indonesia
2Universitas Jambi, Jambi, Indonesia
3
Universiti Utara Malaysia, Kedah, Malaysia
4
Research and Development Agency of Jambi Province, Indonesia
[email protected]
[email protected]
[email protected]
[email protected]
[email protected]
[email protected]
Abstract: This explanatory sequential study investigated secondary school on barriers regarding the Information and Communication Technology (ICT) integration in a developing country, Indonesia. For the quantitative phase, we administered a survey instrument to 250 Indonesian secondary school principals. The survey instrument was developed based on previous related literature validated through content validity and piloted before being distributed. Following the quantitative process, three Focus Group Discussions (FGDs) with 30 participants were conducted to obtain more in-depth information. Each FGD was attended by 10 participants. The findings revealed that the most highly identified barriers are ICT ICT, traditional teaching style, professional development, as well as district and school culture. Recommendations are offered for the improvement of technology integration for educational purpose.
Keywords: barriers, Indonesia, technology integration, secondary school principals, developing country
1.
Introduction
In teaching, the role of technology is currently transforming and is becoming one of the most important influential factors. The role has been widely discussed in some current educational policy studies (Charbonneau-Gowdy, 2018; Nortvig, Petersen and Balle, 2018). If technology had been properly integrated in instructional activities, it would have led to great expectation in the improvement of teaching and learning, and shaping opportunities for future workforce (Mishra and Koehler, 2006). Through the history of technology integration, technology illiteracy is now considered as the new form of illiteracy (Rosen and Michelle, 1995). This fact has lead policy makers in every country in the world to gain a new strong intention and effort to equip schools and universities with Information and Communicating Technology (ICT) infrastructures such as computers and internet access as well as providing qualified staff, teachers and administrators to produce quality students as the next generation who are proficient in technology use for every opportunity in the future. There is no dispute that computers and internet use have been able to aid the teaching and learning process as well as to provide proper opportunities to facilitate stude M
underlined positive integration effects of technology in instructional processes (e.g. Ertmer and Ottenbreit-Leftwich, 2010; Deng, et al., 2014; Kimmons, et al., 2015).
In addition to the positive effects of integration, breaking down barrier should also be considered and any strategy that seeks to change teaching practice should consider the social and cultural context of the school organization (Hargreaves, et al., 2001; Tondeur, et al., 2009). One common issue when implementing new strategies with ICT is that the stakeholders tend to focus on adopting the technology, without providing the appropriate conditions for the social and cultural learning that is required for such an innovation (Hargreaves, et al., 2001). Among these circumstances, all school members who are involved should adopt a common approach, including school administrators or principals. This common approach includes their perception towards barriers of ICT integration in an educational setting (Alghamdi and Prestridge, 2015).
For school administrators, the logical approach is one of the most vital things regarding barriers of ICT integration in schools. The principals are very important in creating the conditions required for a school reform to be finally beneficial for ICT integration (Hargreaves, et al., 2001; Korumaz, 2016). Studies have revealed that principals who have capacities in supporting and guiding their school teachers in technology integration in teaching practice obtain a clear vision of how the technology will contribute to improving projects in shaping the ways students learn in current technological development in education (Chang, 2012; Korumaz, 2016). The ement in the integration of technology is crucial for the program sustainability.
Fewer studies were conducted to investigate ICT more
especially in developing countries (Tondeur, et al., 2009). Therefore, this current study was conducted to comprehensively understand barriers experienced by secondary school principals regarding technology integration in education in Indonesia as one of the developing countries. The two guiding questions are:
1. What and how are ICT integration external barriers perceived by Indonesian secondary school principals?
2. What and how are ICT integration internal barriers perceived by Indonesian secondary school principals?
2.
Literature review
2.1
Barriers of ICT integration
Challenges towards ICT integration have been inspiring educational researchers to cover and overcome the barriers to produce successful ICT integration into teaching (Ertmer, 1999). Barriers to ICT integration was defined as conditions which provide difficulties to the successful process of ICT integration in educational setting (Ertmer, 1999; Bingimlas, 2009; Koh, et al., 2013; Tsai & Chai, 2012). Researchers have discussed barriers in ICT integration in various ways, conditions and settings however, two underlined classifications consistently were categorized and these are external barriers (resources and institutions) and internal barriers (teachers and their attitudes). In early studies, Ertmer (1999) described these barriers with terms of first-order and second-order to ICT integration. She discussed first- and second-order barriers as a comparison to ICT (Ertmer, 1999). While researchers such as (Bingimlas, 2009; Koh et al., 2013) hypothesized that the barriers interact in various ways however, there has been no evidence to show which barriers are the most influential in ICT integration into instruction.
2.2
External barriers of ICT integration
Studies have revealed that the external or original first-order barrier of ICT integration, having access to computers and the internet, has been lifted in almost every public school classroom in developed countries (Gray, Thomas and Lewis, 2010). However, in developing countries such as Indonesia, the barrier regarding computer and internet facility is still prevalent (Habibi, et al., 2018). In addition, some teachers state that limited access to computers and internet is still a main barrier to full integration of ICT (Cuban and Jandric, 2015). Other external barriers are inferior hardware or software, limited peer, and technical support, lack of training and a lack of time to improve skills to use computers and the Internet (Ertmer, Ottenbreit-Leftwich and York, 2007; Kim, et al., 2013; Kilinc, Tarman and Aydin, 2018). Researchers in educational technology have revealed that these barriers will probably always emerge with the changing of technology including innovation and development as well as the current design of the school system (Hermans, et al., 2008). Reducing first-order barriers or external barriers requires costly funding and the reforming of pre-service teacher training models at university level (Ertmer, et al., 2012; Lim, et al., 2013; Machado and Chung, 2015).
2.3
Internal barriers
In addition to external barriers, researchers have found that second-order barriers or internal barriers are more difficult to overcome (Alkhawaldeh and Menchaca, 2014; Collins and Halverson, 2009; Cui and Vowell, 2013; Ertmer, et al., 2012). For example, teachers as practitioners in the teaching and learning process were found to have many external or first-order barriers, as well as personal or second-order barriers (Alkhawaldeh and Menchaca, 2014; Ertmer, et al., 2012). Even those who have had positive attitudes towards ICT integration would eventually develop negative attitudes towards ICT integration because of the first-order barriers they found (Collins and Halverson, 2009). The most common second-order barriers include pedagogical beliefs, motivation, established practices and cultures and personal beliefs about computers (Ertmer, et al., 2012; Mueller, et al., 2008).
3.
Methodology
This study was a sequential explanatory design characterized by the collection and analysis of quantitative data in the first phase of the research, followed by the collection and analysis of qualitative data in the second phase (Brannen, 2005; Creswell 2014). A sequential explanatory strategy was used because this study sought to use quantitative research. To obtain further information about the results, the phase was followed by qualitative research (Brannen, 2005). This approach emphasized how the qualitative findings helped elaborate or extend the quantitative results (Creswell, 2014).
This study was financially supported by the Indonesian Ministry of Higher Education, Technology and Research which took almost a whole year to complete. The authors are from three universities of two countries and one research institution, Universitas Negeri Yogyakarta, Jambi University, and Jambi Agency of Research and Development (Indonesia) and Universiti Utara Malaysia (Malaysia).
3.1
Quantitative phase
We used survey design which provides numeric description using questionnaires for data collection. Survey research aimed to describe the situation and the characteristics of a population (Fraenkel & Wallen, 2009). The population of this study was more than 1000 secondary school principals in one Indonesia. Using random sampling, we distributed the survey instrument to 250 principals; however, only 210 principals returned the survey. Two hundred and one surveys were completed and assessed.
The first step in developing the barriers survey was to review relevant methods literatures instruments (Avidov-Ungar and Shamir-Inbal, 2017; Claro, et al., 2017; Kilinc, Tarman andAydin, 2018; Serhan, 2007) that were already being used for assessing barriers of technology integration in educational settings. Most of these instruments focused on the way in which internal and external barriers were constructed regarding technology integration. All authors contributed in developing and revising every item in three sessions of discussion. Following the discussion, the instrument was sent to a panel of experts; three experts in educational technology and two experts with degrees in educational policy and management as part of a content validity process (Lawshe, 1975). Each expert was requested to rate the extent to which each question measured using a 10-point scale (with 1 being the least measure and 10 being the greatest measure). The experts were also asked to provide some comments and suggestions for each question and, in some cases, suggested their own possible question list for either internal or external constancy.
After being reviewed by the panel of experts, 32 items were set. However, six items were eliminated because they were not reliable after being piloted with 35 principals. The remaining 26 items were measured with a four-level likert scale: 1. Strongly disagree, 2. Disagree, 3. Agree, and 4. Strongly agree. In addition to the main instruments, demographic information namely gender, age, and experience, as well as educational qualification were also distributed. We collected the data through a printed questionnaire. After obtaining the data, we measured the consistency reliability or coefficient alpha (.79 for internal barriers and .86 for external barriers). According to George and Mallery (2001), the alpha is considered to be acceptable. We used descriptive statistics (Ross, 2010) measuring the mean and standard deviation of the research for the data elaboration.
3.2
Qualitative phase
After the analysis of the quantitative data, Focus Group Discussions (FGD) were conducted to obtain in-depth information regarding barriers in ICT integration using a case study (Creswell, 2014; Stake, 1995). Creswell (2014) argued that a case study is appropriate if the researcher wants to produce a high-quality theory because a single case study explores and creates deeper theories. He also stated that the researcher would have better understanding of the explored object namely the research. Choosing a qualitative case study approach in this sequential explanatory design was in order that the findings of this study might not be generalized in the other places or participants (Creswell, 2014).
During the distribution of the survey instrument, we asked the respondents to fill in an availability form confirming whether they were willing to attend the FGDs. Fifty-seven respondents agreed to participate. However, only 30 participants were chosen. The choice was made regarding the representative area, financial
matter, and other important factors (Fraenkel and Wallen, 2009). W in symbols
contacted by phone calls and short messages and asked to come to the FGD sessions. All costs including transportation, accommodation, and consumption were paid by the authors using the research funding. The FGDs were divided into three sessions; each FGD was attended by 10 participants. Discussions lasting about 120 minutes were recorded and video-taped. The survey instrument provided the set of guiding questions for the semi-structured discussion or interview. Semi-structured questions were applied to understand how some interventions work and how they can be improved. This allows interviewers to discuss issues that may not be considered (Creswell, 2014). During the FGDs, the participants were free to argue but limited to certain rules introduced at the beginning of the discussion. We used Google docs Voice Typing to transcribe the recording, an online application for data transcription that needs clear sound in the process.
We analyzed the data using within-case and cross-case analysis that consists of thematic conceptual-ordered analysis, causal network analysis, and partially ordered analysis (Stake, 1995). We processed the data analysis with equal methods although the participants' background and experience varied. The first activity that the researchers did after obtaining the data from focus group discussion was to transcribe the data. Using the latest invention from Google, the data was processed through Google docs voice typing. The next step was to compile this transcription. After compiling the data, we printed the files in order to examine the data. We read and re-read the transcripts to highlight and examine any connections and omissions. This activity was lead by one of the researchers. The coding was manually done followed by the translation process which resulted in themes and sub-themes. In relation to the research aim, we focused on the topic in accordance with the survey results; to discover any emerging information in line with the barriers of ICT integration from the
perspectives.
To ensure the trustworthiness of the study, we included verbatim examples from the transcribed interviews (Lincoln and Guba, 1985). We also carried out member checking (Creswell, 2014). We checked not only all participants of the FGDs but also all co-researchers serving as member checking. In this stage, we returned all the data of the FGDs and our findings to all participants in order to get their feedback and agreement. This step was taken to ensure that our data presentation was without bias. All participants of the FGDs gave consent for us to use the data for our study.
4.
Findings
Two hundred and one measurable responses were received out of 250 distributed printed questionnaires, of which, male samples almost quadrupled female samples. The largest age group was 40 50 years, accounting for 43.28%. Regarding the educational qualification, most of the participants (62.69%) graduated from postgraduate schools, Masters levels. Only one of them was Doctor of Education. Ninety-three participants had experience from 1 to 10 years in being a school principal. Only 7 participants had experience of above 30 years. Table 1 shows the detailed sample demographics.
Table 1: Demographic questionnaire (n. 201)
Information Frequency Percent (%)
Gender (1) Male (2) Female
164 37
81.59 18.41 Age
(1) Below 30 (2) 30-40 (3) 40-50 (4) Above 50
2 48 87 64 1 23.88 43.28 31.84 Experience as school principals
(1) 1-10 (2) 11-20 (3) 20-30 (4) Above 30
93 79 22 7 46.27 39.30 10.95 3.48 Educational qualification
(1) Undergraduate (2) Master (3) Doctoral
74 126 1 36.82 62.69 0.48
4.1
Quantitative phase
To ICT arriers, we calculated descriptive statistics
(frequency, percentage, mean, and standard deviation) for each item. In the survey, we included items from an external barrier perspective (Q1 Q14) and an internal perspective (Q16 Q26). Table 2 depicts the frequency and percentage for each answer and the mean and standard deviations for each of the 14 indicators of
external barriers. Based on the mean scores, principals agreed professional
development courses provided by the authorities were irrelevant to school needs for technology integration there is inability to provide computers in classroom , and there is no support to refresh programmes for older
computers and other devices. H on
some items such as technology integration spends too much time for teaching , the school curriculum does not allow much time for technology integration , the condition of classrooms is not suitable for integrating technology
Table 2: External barriers mean and SD
Item Mean SD
Professional development courses provided by the authorities were irrelevant to school needs for technology integration.
3.45 .53
There is inability to provide computers in classroom 3.45 .60 There is no support to refresh program for older computers and other devices 3.45 .61 There is no support from district authority for ICT needs 3.44 .61 The ICT is easily damage because the school culture is not supportive 3.41 .60 There is inability to provide Internet in classrooms 3.41 .61
There is inability to provide Internet in school 3.38 .60
There is insufficient technical support to solve technological problems 3.29 .59 There is inability to provide computers in school 3.15 .80 Technology integration requires too much time for teaching 2.15 .51 The school curriculum does not allow much time for technology integration 2.00 .64 The condition of classrooms is not suitable for integrating technology 1.98 64
High-stake test restricts the use of technology 1.97 .56
Teachers cannot access softwares that they can utilize for their class 1.95 .60
C .79
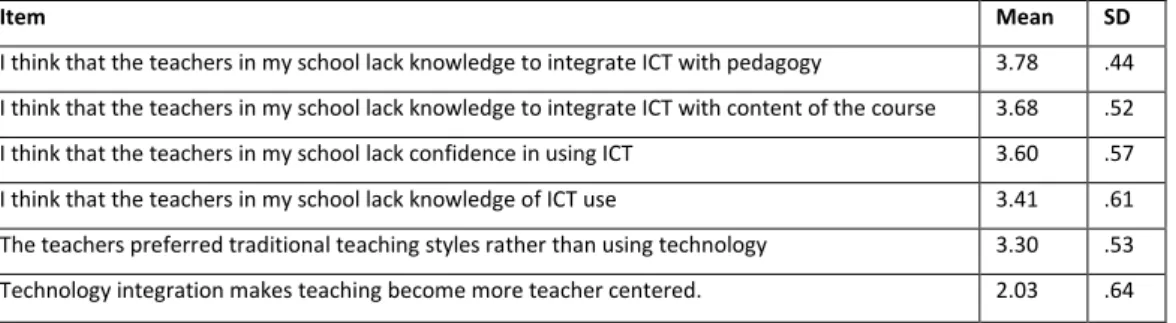
For the internal barriers (see Table 3), I think
that the teachers in my school lack knowledge to integrate ICT with pedagogy I think that the teachers in my school lack knowledge to integrate ICT with the content of the course I think that the teachers in my school lack confidence in using ICT I think that the teachers in my school lack knowledge of ICT use O
other hand, more than seven statements The integration of
technology decreases students
’
attention and concentration Technology integration limits teachers’
role in the classroom Technology integration makes teaching become more teacher centered .Table 3: Internal barriers mean and SD
Item Mean SD
I think that the teachers in my school lack knowledge to integrate ICT with pedagogy 3.78 .44 I think that the teachers in my school lack knowledge to integrate ICT with content of the course 3.68 .52 I think that the teachers in my school lack confidence in using ICT 3.60 .57 I think that the teachers in my school lack knowledge of ICT use 3.41 .61 The teachers preferred traditional teaching styles rather than using technology 3.30 .53 Technology integration makes teaching become more teacher centered. 2.03 .64
Item Mean SD
I don t believe teachers would know how to effectively integrate technology into the teaching process
2.00 .62
Rapid developments of technology makes me worried 1.94 .92
Technology integration make classroom management become less effective 1.87 .53 Technology integration limits teachersrole in the classroom. 1.86 .66
Technology integration limits student centered learning. 1.83 .67
The integration of technology decreases studentsattention and concentration to the lesson. 1.83 .66
C .86
5.
Qualitative phase
We presented all 30 in the focus group discussions to determine the sub-themes of the
study. We categorized the sub-themes based on two main themes as previously discussed in the quantitative phase namely external barriers and internal barriers. We established the sub-themes identified by 50% or more of the participants in the FGDs. Four sub-themes for the external barriers and three sub-themes for internal barriers emerged from this study (see Table 4).
Table 4: Themes and sub-themes from FGDs about barriers of ICT integration
Themes Sub-themes Number of
participants
Frequency of responses
External barriers Lack of funding 30 75
Lack of professional development 25 67
School culture 23 59
District culture 15 35
Internal barriers lack of ICT and its integration for active learning
29 87
lack of of ICT and its
integration
29 84
Traditional teaching styles 22 74
External barriers
There are four sub-themes for external barriers which include Lack of funding, Lack of professional development, School culture, and district culture. 75 responses in the FGDs indicated that the lack of funding for ICT was one of the barriers to successfully integrating ICT in their school. Participants revealed that schools need to purchase new ICT devices for educational purposes, connect the wireless network for the Internet and replace older ICT devices. These needs should be supported by sufficient funding. Two of the participants stated (Quoted verbatim),
When we want to increase our ICT integration in schools, we need more devices such as computer, projector, and more importantly the Internet. Inter (P1)
I state that there are plenty of older device in our schools that need to be replaced by the
new ones. However, we have not P
The second external barrier discussed in the FGDs was lack of professional development. More than 83% of the participants had the perception that there were significant barriers to integrating ICT in line with the lack of professional development for teachers to improve both their knowledge of ICT skill and ICT integration into teaching. One of the participants stated that although there had been good ICT devices available in the school for teaching and learning processes, there was insufficient training or workshops to support the ICT integration performance. Another participant indicated that many ICT-based professional development programmes did not have adequate follow-up training, workshops, or field practices on how to effectively use ICT for
instruction. P12 noted that many programmes offered by either public or private institutions did not support, not only teachers to extend the use of ICT during teaching and learning processes and the significant advantages using technology compared to traditional teaching styles, but also principals to manage the administration and do supervision in relation to ICT integration in education.
The third external barrier found in this study was school culture. Twenty-three participants perceived that the culture of schools could also be a significant barrier for ICT integration in their school. One participant reported that when teachers were told that there would be new ICT devices for instructional activities, they made comments such as W purchase ICT devices, then the irresponsible students damage them. It is so annoying that the situation might happen in our school . In addition to broken devices caused by a few students, some school principals believed that school cultures including the way teachers in the classroom are ingrained, prevent or hinder ICT integration during teaching and learning processes. One of the participants noted,
I the government want to make ICT integration become a success story. It needs to establish school culture that embraces the use of such technologies (P15)
Half of the participant (15 principals) with thirty-five responses mentioned that the district culture was also a barrier to technology integration in this study. Five participants shared in the discussions that the culture of district became one of the competitive challenges for limited ICT resources in their school. One of the participants, (P6) said that the head of the department in charge for operational stuff in his district was a barrier because he neither supported the ICT integration nor purchased ICT devices for the school in his district.
Internal barriers
The internal barriers revealed in this qualitative phase our were lack of ICT and its integration for active learning, lack of understanding of ICT and its integration and traditional teaching styles (see Table 4). The first internal barrier identified was lack of ICT and its integration for active learning perceived by most participants in the FGDs. One participant (P10) reported that the barrier was related the teachers understand technology in general and how good they integrate ICT into their classroom routines A (P13) declared that this lack of knowledge of
ICT and its integration was
ICT
L understanding of ICT and ICT integration was another sub-theme revealed from the
qualitative analysis. We identified this sub-theme from twenty- FGD O
P “ -efficacy of the teachers is a significant barrier for ICT integration in my school. I have even talked to some of them and they informed me that they lack have lack confidence teaching ICT A P said that understanding for ICT integration was not the only barrier, but also understanding using the ICT devices as a barrier informed in this study.
Twenty-two participants indicated that the traditional teaching style was another barrier to ICT integration in the school they lead. Participants took the view that the uneasy shift from the teacher-centred teaching class to student-centred learning was a barrier. O ne participant (P28) said that teachers, especially senior teachers, have had many years of training and practices to conduct instructional activities in a specific way where students just listen to their lecture with no innovation in the teaching and learning processes.
6.
Discussion
The preliminary findings of this study indicated that the most highly identified external barriers were mainly related to lack of funding such as inability to provide computers and the Internet in classrooms, no support to refresh programmes for older computers and other devices as well as insufficient technical supports to solve technological problems. This result is somewhat surprising because the Indonesian government has spent 20 % of the national budget on educational funding including the cost of ICT implementation and its support (Sofwan and Habibi, 2016; Luschei, 2017). The results agree with some previous related studies in other developing countries (Kilinc, Tarman and Aydin, 2018), which maintained that teachers perceived a lack of
integration. Another study by Wachira and Keengwe (2011) reported that Japanese schools found formidable barriers, specifically the absence of media specialists/ technology technicians similar to this study result. Professional development regarding ICT integration for effective and efficient teaching and learning processes is an essential component to promote the use of ICT during instruction (Derbel, 2017). However, professional development programmes can be, in some circumstances condition, be perceived as one of the significant barriers for ICT integration when the programmes are not in relation to actual teaching practices or merely focused on ICT skill development (Tarman and Chigisheva 2017). This study also revealed similar results, the Indonesian school principals stated that the professional development courses that teachers need to attend were not relevant to their needs for integrating ICT. They perceived insufficient technology-related professional developments as one of the barriers. Briefly, the conclusion can be drawn that the perceived barriers of school principals to ICT integration in instructional activities show similarities across time, space, and culture.
From the survey and FGDs, it is revealed that the participants of this study believed knowledge of ICT and its integration, lack of confidence in using ICT integration delete, and beliefs in traditional teaching styles were the external barriers for ICT integration T ICT
confidence were predicting factors and had a significant influence on the quantity of ICT integration used to support teaching and learning processes (Cui and Vowell, 2013; Alkhawaldeh and Menchaca, 2014 ). One of the significant findings revealed that the lack of necessary knowledge is an unavoidable barrier to ICT integration in education (Mackenzie 2013).
In addition and confidence of ICT and its integration, traditional teaching styles were also revealed as a barrier that could not easily be overcome. This barrier is very complicated and has been rooted in school teaching cultures background, education and experiences, and thus it is difficult to overcome (Tondeur, et al., 2009; Cuban and Jandric, 2015;). Most principals that participated in the FGDs believed that the traditional teaching style was a lasting barrier for many teachers, particularly older teachers. This finding is in alignment with previous studies (Ertmer, et al., 2012; Kim, et al., 2013; Mueller, et al., 2008).
7.
Implication
This study recommends that district-level educational authorities should provide and develop professional development training programmes for principals and teachers to improve effective ICT plans with an emphasis on ICT integration in schools. This training programme is crucial for principals to comprehend and evaluate the significance of collaborating to establish set specific goals regarding ICT integration, setting an appropriate budget plan for ICT purchases and updating old technological devices, and recognizing supports for teachers, as well as including balanced professional development opportunities. When principals are trained, they will be able to start the process of revision or development, and finalisation of a technology plan with real effectiveness for the school.
Principals should be committed to working in collaboration with short and
long term ICT integration plan. Early steps would be developing the current inventory of technologies, teachers , and annual objectives for a computer ratio for students. In addition, schools should move towards a programme of one device per student. They should plan to utilize and organize computer labs to support academic activities. This plan should include the proposal of funding sources and the potential funding capacity to purchase new technological devices, renew old and slow devices and support the maintenance of
the wireless capacity within their school sites. T al authorities should be
invited to get involved, or at least to have a discussion and consultation when the plan is established and implemented.
References
Alghamdi, A. and Prestridge, S., 2015. Alignment between principal and teacher beliefs about technology use. Australian Educational Computing, [online] Available at: <http://journal.acce.edu.au/index.php/AEC/article/view/52> [Accessed 3 January 2018].
Alkhawaldeh, N.I. and Menchaca, M., 2014. Barriers to utilizing ICT in education in Jordan. International Journal on E-Learning, [online] Available at: <https://www.learntechlib.org/p/39525/> [Accessed 2 January 2018].
Avidov-Ungar, O. and Shamir-I T ICT TPACK-based leadership knowledge in their roles as agents of change. Journal of Information Technology Education: Research, [online] Available at:
<https://www.informingscience.org/Publications/3699> [Accessed 5 May 2018].
Bingimlas, K.A., 2009. Barriers to the successful integration of ICT in teaching and learning environments: A review of the literature. Eurasia Journal of Mathematics, Science & Technology Education, [online] Available at:
<http://www.iserjournals.com/journals/eurasia/download/10.12973/eurasia.2009.00146a> [Accessed 30 December 2018].
Brannen, J., 2005. Mix-method research: Discussion paper. NCRM research review paper.
C I H T technological literacy and teaching
effectiveness in Taiwanese elementary schools. Educational Technology & Society, [online] Available at: <https://www.j-ets.net/ETS/journals/15_2/28.pdf> [Accessed 3 January 2018].
Charbonneau-Gowdy, P., 2018. Beyond Stalemate: Seeking Solutions to Challenges in Online and Blended Learning Programs. The Electronic Journal of e-Learning, [online] Available at: <http://www.ejel.org/volume16/issue1> [Accessed 25 August 2018].
Claro, M., Nussbaum, M., López, X. And Díaz, A., 2013. Introducing 1:1 in the classroom: A Large scale experience in Chile. Educational Technology & Society, [online] Available at: <https://www.j-ets.net/ETS/journals/16_3/24.pdf> [Accessed 3 January 2018].
Collins, A. and Halverson, R., 2009. Rethinking education in the age of technology: The digital revolution and schooling in America(technology, education connections TEC series). New York, NY: Teachers College Press.
Creswell, J.W., 2014. Research design: qualitative, quantitative, and mixed methods approaches. Thousand Oaks, CA: Sage. Cuban, and Jandric, P., 2015. The dubious promise of educational technologies: Historical patterns and future challenges.
E-Learning and Digital Media, [online] Available at:
<https://journals.sagepub.com/doi/10.1177/2042753015579978> [Accessed 10 January 2018].
Cui, G. and Vowell, R., 2013. Leadership issues concerning instructional technology. In S. Wang & T. Hartsell (Eds.), Technology integration and foundations for effective leadership (pp. 261-277). Hershey, PA: Information Science Reference.
Deng, F., Chai, C.S., Tsai, C.C. and Lee, M. H., 2014. The relationships among Chinese practicing
pedagogical beliefs and their beliefs about the use of ICT. Journal of Educational Technology & Society, [online] Available at: <https://www.j-ets.net/ETS/issues3221.html?id=63> [Accessed 2 January 2018].
Derbel, F., 2017. Technology-capable teachers transitioning to technology-challenged schools. Electronic Journal of e-Learning, [online] Available at: <http://www.ejel.org/issue/download.html?idArticle=598> [Accessed 5 May 2018]. Ertmer, P.A. and Ottenbreit-Leftwich, A.T., 2010. Teacher technology change: How knowledge, confidence, beliefs, and
culture intersect. Journal of Research on Technology in Education, [online] Available at:
<https://www.tandfonline.com/doi/abs/10.1080/15391523.2010.10782551> [Accessed 3 January 2018]. Ertmer, P.A., 1999. Addressing first-and second-order barriers to change: Strategies for
technology integration. Educational Technology Research and Development, [online] Available at: <https://link.springer.com/article/10.1007/BF02299597> [Accessed 21 January 2018].
Ertmer, P.A., Ottenbreit-Leftwich, A. and York, C. S., 2007. Exemplary technologyusing teachers: Perceptions of factors influencing success. Journal of Computing in Teacher Education, [online] Available at:
<https://www.tandfonline.com/doi/abs/10.1080/10402454.2006.10784561> [Accessed 2 January 2018]. Ertmer, P.A., Ottenbreit-Leftwich, A. T., Sadik, O., Sendurur, E. and Sendurur, P., 2012. Teacher beliefs and technology
integration practices: A critical relationship. Computers & Education, [online] Available at:
<https://www.sciencedirect.com/science/article/pii/S0360131512000437?via%3Dihub> [Accessed 2 January 2018]. Fraenkel, J. and Wallen, N., 2009. How to design and evaluate research in education. New York, NY:McGraw-Hill.
George, D. and Mallery, P., 2001. SPSS for Windows. Needham Heights: Allyn & Bacon.
Gray, L., Thomas, N., and Lewis, L., 2010. Educational technology in U.S. public schools: Fall 2008. [online]. NCES 2010-034. Available at: <http://nces.ed.gov/pubs2010/2010034.pdf> [Accessed 2 January 2018)
Habibi, A., Mukminin, A., Riyanto, Y., Prasojo, L.D., Sulistiyo, U., Saudagar, F. and Sofwan, M., 2018. Building an online
“
education program. Turkish Online Journal of Distance Education, [online] Available at:
<http://tojde.anadolu.edu.tr/yonetim/icerik/makaleler/1599-published.pdf> [Accessed 3 September 2018]. Hargreaves, A., Earl, L., Moore, S. and Manning, S., 2001. Learning to change. Teaching beyond subjects and standards.
California: Jossey-Bass.
Hermans, R., Tondeur, J., van Braak, J. and Valcke, M. (2008). The impact of primary the classroom use of computers. Computers & Education, [online] Available at:
<https://www.sciencedirect.com/science/article/pii/S0360131508000377> [Accessed 3 January 2018].
Kilinc, E., Tarman, B. and Aydin, H., E T “ “ T B fs About Barriers toTechnology Integration. TechTrend. [online] Available at: <https://link.springer.com/article/10.1007%2Fs11528-018-0280-y> [Accessed 29 September 2018].
Kim, C., Kim, M.K., Lee, C., Spector, J.M. and DeMeester, K., 2013. Teacher beliefs and technology integration. Teaching and Teacher Education, [online] Available at: <https://www.sciencedirect.com/science/article/pii/S0742051X1200131X> [Accessed 2 January 2018].
Kimmons, R., Miller, B.G., Amador, J., Desjardins, C.D. and Hall, C., 2015. Technology integration coursework and finding meaning in pre- ctice. Educational Technology Research and Development, [online] Available at: <https://link.springer.com/article/10.1007/s11423-015-9394-5> [Accessed 2 January 2018].
K J H L C C “ T C C E
knowledge (TPACK) pathways: a structural equation modeling approach. Instructional Science, [online] Available at: <https://link.springer.com/article/10.1007/s11251-012-9249-y> [Accessed 3 January 2018].
Korumaz, M., 2016. Invisible barriers: The loneliness of school principals at Turkish elementary schools. South African Journal of Education. [online] Available at:
<http://www.sajournalofeducation.co.za/index.php/saje/article/view/1302/659> [Accessed 5 May 2018]. Lawshe, C.H., 1975. A quantitative approach to content validity. Personnel Psychology, [online] Available at
<https://onlinelibrary.wiley.com/doi/pdf/10.1111/j.1744-6570.1975.tb01393.x> [Accessed 13 May 2017].
Lim, C.P., Zhao, Y., Tondeur, J., Chai, C.S. and Tsai, C.C., 2013. Bridging the gap: Technology trends and use of technology in schools. Educational Technology & Society, [online] Available at <https://www.j-ets.net/ETS/issues37ab.html?id=59> [Accessed 5 January 2018].
Lincoln, S.Y. and Guba, G.E., 1985. Naturalistic inquiry. New York: SAGE Publications.
Luschei, T., 2017. 20 years of TIMSS: Lessons for Indonesia. Indonesian Research Journal in Education |IRJE|, [online] Available at <https://online-journal.unja.ac.id/index.php/irje/article/view/4333> [Accessed 5 May 2018].
M L J C C J I T International Education
Studies, [online] Available at:
<http://www.iserjournals.com/journals/eurasia/download/10.12973/eurasia.2009.00146a> [Accessed 30 December 2018].
Mackenzie, T. (2013). What are the Barriers to Tech Integration in the Classroom? Retrieved from
https://trevmackenzie.wordpress.com/ 2015/10/19/what-are-the-barriers-to-tech-integration-in-theclassroom/ Mishra, P. and Koehler, M.J., 2006. Technological pedagogical content knowledge: A framework for teacher knowledge.
Teachers College Record, [online] Available at <https://www.tcrecord.org/content.asp?contentid=12516> [Accessed 3 January 2018].
Mueller, J., Wood, E., Willoughby, T., Ross, C. and Specht, J., 2008. Identifying discriminating variables between teachers who fully integrate computers and teachers with limited integration. Computers & Education, [online] Available at <https://www.sciencedirect.com/science/article/pii/S0360131508000390> [Accessed 3 January 2018].
Nortvig, A.M., Petersen, A.K., and Balle, S.H., 2018. A Literature Review of the Factors Influencing ELearning and Blended Learning in Relation to Learning Outcome, Student Satisfaction and Engagement. The Electronic Journal of e-Learning, [online] Available at <http://www.ejel.org/volume16/issue1> [Accessed 2 January 2018].
Rosen, L. and Michelle, W., 1995. Computer availability, computer experience and technophobia among public school teachers. Computer in Human Behaviour, [online] Available at
<https://www.sciencedirect.com/science/article/pii/074756329400018D> [Accessed 2 January 2018]. Ross, S.M., 2010. Introductory statistics. Academic Press.
Serhan, D., 2007. School principals' attitudes towards the use of technology:
United Arab Emirates technology workshop. The Turkish Online Journal of Educational Technology, [online] Available at <http://www.tojet.net> [Accessed 2 January 2018].
Sofwan, M. and Habibi, A., 2016. Problematika Dunia Pendidikan Islam Abad 21 dan Tantangan Pondok Pesantren di Jambi. Jurnal Kependidikan: Penelitian Inovasi Pembelajaran, [online] Available at:
<https://journal.uny.ac.id/index.php/jk/article/view/9942> [Accessed 2 May 2018]. Stake, R.E., 1995. The Art of case study research. Thousand Oaks: Sage.
Tarman, B. and Chigisheva, O., 2017. Transformation of educational policy, theory and practice in post-soviet social studies education. Journal of Social Studies Education Research, [online] Available at:
<http://dergipark.gov.tr/download/article-file/375107> [Accessed 3 May 2018].
Tondeur, J., Devos, G., Van Houtte, M., van Braak, J. and Valcke, M., 2009. Understanding structural and cultural school characteristics in relation to educational change: The Case of ICT integration. Educational Studies, [online] Available at: <https://www.tandfonline.com/doi/abs/10.1080/03055690902804349> [Accessed 3 January 2018].
Wachira, P. and Keengwe, J., 2011. Technology integration barriers: Urban school mathemati
Journal of Science Education Technology, [online] Available at: <https://link.springer.com/article/10.1007/s10956-010-9230-y> [Accessed 3 January 2018].
ISSN 1479-4403 11 ©ACPIL
Learning Package in a Hong Kong University
Dennis Foung and Julia Chen
English Language Centre, The Hong Kong Polytechnic University, Hong Kong, China
[email protected]
Abstract: In recent years, research using learning analytics to predict learning outcomes has begun to increase. This emerging field of research advocates the use of readily-available data to inform teaching and learning. The current case study adopts a learning analytics approach to evaluate the online learning package of an academic English course in a university in Hong Kong. This study aims to (1) explore the completion pattern of use of the online learning package by students in a generic undergraduate academic skills course; and (2) predict student outcomes based on their online behaviour patterns. Over three academic years, the study
examined usage logs for 7000+
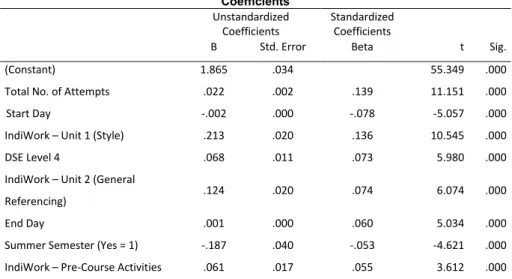
Student assessment component scores, online activity completion rates, and online behavioural patterns were identified and examined using descriptive analysis, bivariate correlation analysis, and multiple regression analysis. The findings reveal insights into different online learning behavioural patterns that would benefit blended course designers. For instance, some students started using the online learning package early in the semester but fulfilled only the minimum required online work, whereas others greatly exceeded the basic requirement and continued doing activities in the online package even after the semester had finished. The relationship between learning activities in the online package and assessment component grades was found to be weak but meaningful. A regression model was developed drawing on the completion rates to predict overall student scores, and this model successfully identified several specific factors, such as total number of attempts and performance in individual online learning activities, as predictors of the final course grade.
Keywords: learning analytics, blended learning; online learning package, English for academic purposes, Hong
Kong, course design
1.
Introduction
W H K in 2012 from a three-year structure (British system) to a
four-year one (American system), the university in question seized the opportunity to introduce a substantial blended learning component to its new English subjects via a Learning Management System (LMS). The introduction of the LMS was primarily driven by two considerations. First, the new English courses were offered in the form of one 3-hour session per week (instead of one 2-hour session and one 1-hour session), a change that gave students considerable time to study and complete their work before their next class. Second, since blended learning approaches around the globe have proven successful,
built on studies that identified the benefits of blended learning for students in a higher education context over the last decade (e.g. Fischer, 2007; Huon, et al., 2007), in order to include a blended learning component in their new English for Academic Purposes (EAP) courses.
When the first four-year curriculum cohort was in their final year of study, it was felt that a more comprehensive curriculum review was warranted. Despite receiving excellent feedback from stakeholders such as students, teachers, and
under- T iour with regard to the online
learning package more closely, in order to inform future blended learning designs for the EAP context. For more details of the full curriculum review, see Chen (2018) and Chen, Foung and Armatas (2018).
This study adopts a data-driven approach to understand the behaviours of students completing blended learning activities and to explore the impact of blended learning tasks to course assessment. This study is highly relevant and important to the field of Computer-Assisted Language Learning and EAP because (1) understanding the behaviors of students facilitates more effective development of blended learning activities; and (2) establishing the relationship between blended tasks and course performance can help evaluate the effectiveness of blended task in an evidence-based manner.
The next section presents a literature review on the establishment of learning analytics as a research interest in Computer-Assisted Language Learning (CALL) and how it facilitates CALL design. This is followed by a methodology section that introduces the course, participants, CALL activities, and data analysis procedures adopted in the current learning analytics study. The findings are then presented and discussed, including the general pattern of completion, the cut-off effect, the acquisition of writing skills, and a predictive model for overall grades. The article concludes with a number of suggestions for blended learning teachers and researchers.
2.
Literature Review
The use of learning analytics in the field of Computer-Assisted Language Learning (CALL) can contribute to developing an understanding of students and their behaviours in completing blended learning tasks. Various previous studies drawing on learning analytics have successfully explain -regulating behaviours affect their performances and engagement in blended learning activities (e.g. Fischer, 2007; Zacharis, 2015; Zheng, et al., 2016). Students who can self-regulate and attain goals engage best in a blended environment (Arispe and Blake, 2012). In addition to this principle, several other aspects have proven to be important areas in blended learning research, including student behaviours in an online environment, effective learning design, and the association between blended tasks and their outcomes.
In recent decades, research has attempted to understand the online behaviours of students in various blended learning contexts. Unsurprisingly, students tend to be rather pragmatic when approaching blended learning; that is, they acquire knowledge to obtain good marks, instead of aiming to broaden their knowledge (Huon, et al., 2007). Some CALL learners could even be described as adopting a principle of minimal effort approach (Fischer, 2007, p.419). This aligns with the findings of previous empirical studies (e.g. Li, 2014) that students complete necessary online learning tasks without doing more than the minimum required for learning. Despite this, blended learning designs are still being promoted, since diversity in a carefully-planned course delivery approach can create better learning experiences (Kahn, et al., 2017). For example, the diversity and interaction
N
Tubin and Pliskin, 2010; Zacharis, 2010). Teacher presence seems to be particularly effective in enhancing the effectiveness of online material delivery (Hegeman, 2015). I H , teacher presence refers to the adoption of teacher-prepared notes, instead of consulting external websites for help or clarification. This is echoed in a recent review by Nortvig, Petersen, and Balle (2018) that states that educator presence is a dominating factor influencing e-learning and learning outcomes. Another key influencing factor is the deliberate connections designed into the learning activities of the online and offline parts of a course. Online and offline activities should be integrated so that learning can expand from the classroom to out-of-class learning, and vice versa.
Blended learning research has also focused on identifying effective blended learning designs and understanding learner preferences, and these aspects provide further insights into blended learning in a language-learning context. Generally speaking, students are becoming more comfortable with online learning via a Learning Management System, and feel that such online learning can help improve their course performance (Uziak, et al., 2018). According to Arispe and Blake (2012, p.459), students with poor spoken language proficiency tend to prefer traditional blended learning materials (i.e. one-way delivery/without the presence of an instructor) which allow them to learn at their own pace without being overwhelmed by an instructor. They believe that students with poor spoken language proficiency can enjoy their learning in the online component of a blended learning course, as there is no instructor asking them to respond to questions spontaneously. Li (2014) also suggests that when given the opportunity to choose how they want to fulfil their blended learning requirement, some students prefer to do web exercises, while others prefer to interact with peers via online group discussions. Zhu, Au, and Yates (2016) believe that text-heavy online tasks (such as keeping an online journal or responding to a discussion thread) can help activate certain self-regulated learning behaviours, such as planning and reflection, and thus these exercises play a significant role in blended learning. Heift (2003) examined the impact of different types of web task on student learning. She believes that some exercises allow for more freedom (e.g. drag-and-drop and gap-filling activities), while others provide a lower degree of freedom (e.g. multiple-choice questions). Here, freedom refers to the fact that students do more than simply click the correct answer (as in MC questions), but move the mouse to answer a question online (as in drag-and-drop exercises). Activities that allow for more freedom were found to have a more
available (e.g. discussion, multiple-choice questions, drag-and-drop, or gap-filling) can affect
learning. Hershkovitz and Nachmias (2011) believe that further research is needed in this domain to extend
o
I
within the blended learning research paradigm, with learning outcome used as a common way to define the effectiveness of e-learning (Noesgaard and Ørngreen, 2015). Sceptics have argued that the relationship between delivery mode and student outcomes is generally rather weak (Dziuban and Moskal, 2011; Moskal, Dziuban and Hartman, 2013); however, other academics have continued to explore such relationships by including different factors in their predictive models. Several studies have concluded that participatory variables, such as course login frequency, reading course announcements, and accessing course materials, are significant predictors of final course grades (Chen, 2013; Chen and Jang, 2010; Damianov, et al., 2009; Dawson, McWilliam and Tan, 2008; Tempelaar, Rienties, and Giesbers, 2015; Zacharis, 2015; Zhu, Au and Yates, 2016). Macfadyen and Dawson (2010) identified some influential participatory variables, such as total number of discussion messages posted, total number of mail messages sent, and total number of assessments completed. Some studies have also evaluated the predictive power of other factors; for example, one study found that Z , Au and Yates, 2016), while another study concluded that other demographic factors, such as university entrance exam marks, can be good predictors of
performance and final scores in a blended learning course (López-Pérez, Pérez-López and Rodríguez-Ariza, 2011).
Other than these e-learning-based studies, it is important to take note of some learning analytics studies using advanced data mining techniques, such as Asif, Merceron, Ali, and Haider (2017) and Foung (2019). They also
have not yet included blended learning
variables. The data mining methods such as classification trees and logistics regression analysis can be applied
to and this was echoed by Rodrigues, Zárate, and
Isotani (2018).
However, little research has been conducted to explore how blended learning components can predict final O
results (e.g. Macfadyen and Dawson, 2010; Tempelaar, Rienties and Giesbers, 2014). Hence, there is room for further investigation in this respect.
D
development of academic writing skills, there is still room for a learning analytics approach to assess these and to explore the predictors of learning outcomes in blended academic skills courses. To be precise, this study aims to answer the following questions:
1. How many online activities did students complete? 2. How much time did students spend on online activities?
3. Is the pragmatic approach to online activities applicable to the current context? If so, how?
4. Can behavioural patterns in blended learning components predict their academic outcomes?
3.
Methodology
The following sections describe how the research was conducted with the readily-available data on the LMS and detail how the course and its online activities were designed.
3.1
Participants
This study adopted a convenience sampling approach and retrieved the learning data of students taking a university English course, English for University Studies (EUS) from the university LMS between 2012/13 and 2014/15. In other words, entries were retrieved as long as they were available and no probabilistic computation was involved in acquiring the data. The learning data of 7,156 students were eventually retrieved for analysis, most of which comprised the access log data available on the LMS, such as which learning activities students had selected, when students had commenced working on the learning activities, and what scores they had received for each activity.
3.2
Ethical Clearance
The Ethical Review for Teaching/Research involving human subjects of this project was approved by the Departmental Research Committee and recorded on the university Human Subjects Ethics Application Review System (Reference Number: HSEARS20160812002).
3.3
Course and Assessments
EUS is a foundation EAP course taken by two groups of students at different English proficiency levels. Most students attain a Level 4 in English in the Hong Kong secondary school exit examination (equivalent to an IELTS [International English Language Testing System] score of 6.30 6.51) while the remaining students attain Level 3 in the same exam (equivalent to an IELTS score of 5.48 5.56). Students who attain a Level 3 must first take a proficiency-based English course, followed by EUS, the foundation EAP course. Meanwhile, Level 4 students take EUS as their first English course in university. In the data set selected for the current study, 33.6% of students took this course as their second English course (Level 3), while 66.4% took this as their first English course (Level 4).
The aim of EUS is to E There are two very
similar versions of the course, catering respectively to students who primarily use APA/Harvard referencing styles and to those who mainly use IEEE/Vancouver referencing styles in their university studies. All students must complete the same assessments and fulfil the same assessment requirements. In 2012/13, each semester lasted for 14 weeks, but this was reduced to 13 weeks in 2012/13; thus, there were also only 13 weeks in each semester in 2013/14 and 2014/15.
In order to pass the course, students taking EUS must complete three assessments and independent online learning task (IndiWork) requirements. The first assessment comprises an in-class writing assignment focusing on a problem-solution essay, while the second one comprises a take-home expository essay. Finally, the third assessment comprises an in-class pair work presentation. These three assessments contribute to the final course grade. In addition, students must fulfil an 80% attendance requirement and an e-learning requirement, which is the focus of this study, called IndiWork. The minimum score for IndiWork in 2012/2013 was 60%, and that for 2013/14 and 2014/15 was 50%. Failure to meet any of these requirements will lead to an overall grade reduction, but completing more than the minimum will not lead to an improvement in the overall grade.
3.4
IndiWork
The aim and design of IndiWork is to provide students with extended and out-of-class learning opportunities
H I W
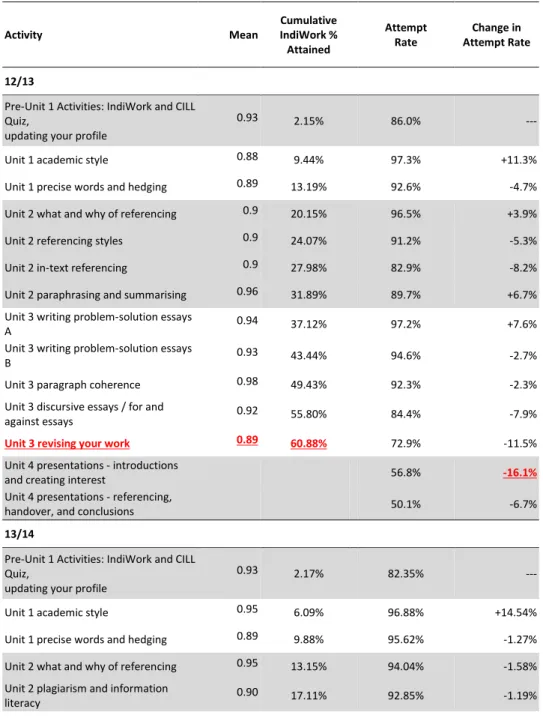
content, that is, academic writing and academic speaking. All activities were developed by course designers with experience in teaching generic academic skills and were reviewed by the subject leader of the course. Each IndiWork activity comprises an individual web exercise with several questions posted on the university LMS; most activities adopt a gap fill, mix and match, and/or multiple-choice format. Some activities may ask students to watch a tailor-made video posted on YouTube before completing the exercise and some provide textual pre-task input for students. As an example, a list of blended learning activities in 2014/15 is presented in Appendix One. Students were offered a total of 15 learning activities in 2012/13 and 18 activities in 2013/14 and 2015/16. Although there were minor changes to the activities across cohorts in the years studied, the activities remain comparable in terms of content and level of difficulty. Most IndiWork activities are relevant to the EAP course, such as paragraph cohesion and paraphrasing and summarising , while the remaining activities relate to general proficiency, such as vocabulary building. Depending on the course schedule, some IndiWork tasks are made available at the beginning of the term and expire in the middle of the term. For example, academic style is taught as the first unit of the course, so IndiWork activities on academic style start at the beginning of the term and expire in the middle of the term. Due to the teaching schedule, most other tasks are made available later in the term and expire at the end of the term. The course designers hope that this approach will motivate students to complete a class-related exercise soon after/before they have learned the corresponding skill in class.
Among the IndiWork activities that are available, students can choose which they want to complete to fulfil the minimum requirement. All activities are automatically and immediately marked by the system, and students know their total score for the activity and which items they have completed correctly. The total score
of each individual IndiWork activity will count towards the overall IndiWork score. Students have unlimited attempts to do any activity, but only the score of the final attempt counts towards the IndiWork total score.
3.5
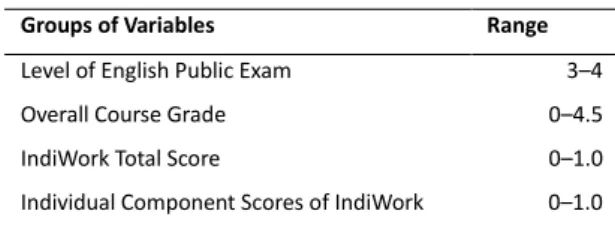
Data collection and procedures
Assessment results and IndiWork records are stored on the LMS; a list of variables is presented in Table 1. All teachers make use of this system to enter four component grades for each assessment for each student, and the system derives a final grade based on the component grades that are entered. The overall grade used for this study is calculated based on the overall assessment grades of the three assessments. The component grades for the written assessments are Content, Organization, Language, and Referencing, whereas those for spoken assessments are Content, Delivery, Language, and Pronunciation and Fluency. The University common assessment scheme specifies that students be assigned one of nine possible ordinal scores: 4.5, 4.0, 3.5, 3.0,
2.5, 2.0, 1.5, 1.0, 0, with 4.5 O 3.0 G C “ 1.0 B A , and 0
I
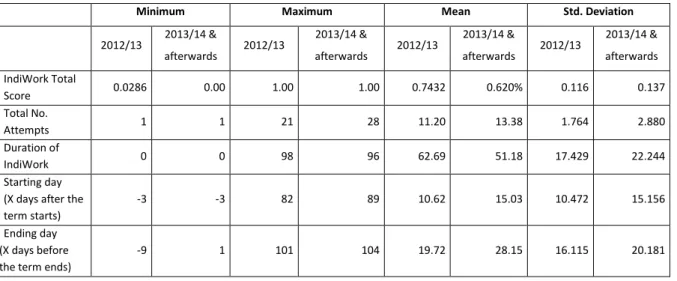
“ IndiWork records are available on the LMS for students to see. The IndiWork total score is the most important indicator, ranging from 0 to 1 (i.e. 0% to 100%), due to its direct implications for the overall grade (for details, see section 3.3 on Course and Assessments), and has been converted to a decimal number. To facilitate the analysis in this study, students were divided into seven groups according to their IndiWork scores: Group 1 for students from 0 0.25 completion; Group 2 (0.25 0.4999%); Group 3 (0.5 0.5999); Group 4 (0.6 0.6999); Group 5 (0.7 0.7999); Group 6 (0.8 0.8999); and Group 7 (0.9 1). On top of the total scores, the date and time of completing the IndiWork tasks were recorded by the system. The day that a student started an IndiWork task and the day on which a student finished his/her latest IndiWork task were also computed. In addition, for analysis purposes, the number of days between the first and last days was computed. In terms of
I W
total attempts were retrieved. Since each IndiWork activity corresponded to one or more assessment components (i.e. each IndiWork activity was designed to help students with at least one of the assessment components), the sum of all relevant IndiWork scores for a particular component was computed for analysis.
Table 1: List of Variables Retrieved from the Learning Management System (LMS)
Groups of Variables Range
Level of English Public Exam 3 4
Overall Course Grade 0 4.5
IndiWork Total Score 0 1.0
Individual Component Scores of IndiWork 0 1.0
3.6
Data Analysis
After the data were retrieved, some entries were removed to maintain a valid data set. The records of students who, for various reasons, could not complete the course were removed. Next, a round of exploratory and descriptive analysis was conducted, including bivariate correlation analysis and descriptive statistics for various variables. After the exploratory stage, rounds of data testing and screening were carried out. Normality tests were performed with all relevant variables by visually inspecting the histogram. After the data cleaning procedures, several inferential statistical analyses, including bivariate correlation analysis and multiple regression, were conducted using IBM SPSS 23.
Because some parts of the dataset were not directly comparable, descriptive analysis was conducted for each individual student cohort. To allow generalizability, scores in activities were grouped under common categories, such as Unit 2 Activity on General Referencing . Because the mean scores of each activity were used, such categories may represent the mean scores of two activities in 2012/13 or three activities in 2013/14. This use of mean scores made comparison across cohorts possible.
To conduct the multiple regression analysis, several assumptions needed to be met; thus, a number of steps were taken to ensure the validity of the analysis. First, the tolerance of included variables was checked to see if it was greater than 0.1. No variables presented violated this threshold. Unusual points were also detected and
T C C and Weisberg,
residuals was verified by visually inspecting the histograms and residuals in both models and confirming whether both were normally distributed. Finally, the analysis was run for a second time and the findings are presented and discussed in the next section.
4.
Results and Discussion
The following sections examine how students completed the online activities designed for them, how these tasks facilitate acquisition of
predicted with the variables related to blended learning components.
4.1
An Overview of IndiWork Completion
i. Completion Rate
Generally speaking, a high proportion of students completed the IndiWork activities. Tables 2a and 2b show the completion rates of IndiWork in different cohorts. The mean completion rate was 74.32% (2012/13; required minimum = 60%) and 62.06% (2013/14 and 2014/15; required minimum = 50%); in total, 94.7% of students completed the requirement ( 60%) in 2012/13 and 95.2% ( 50%) in 2013/14 and 2014/15. Among those students who met the requirements, a significant number (32.4% in 12/13; 26.2% in 13/14 and 14/15) did 10% more than the minimum required (Tables 2a and 2b).
Table 2a: IndiWork Total Score 2012/13 (n = 2,241; minimum required: 60%)
Percent Cumulative Percent
0 24.99% .2 .2
25% 49.99% 1.1 1.2
50% 59.99% 2.6 3.9
60% 69.99% 35.9 39.8
70% 79.99% 27.8 67.6
80% 89.99% 20.3 87.9
90% 100% 12.1 100.0
Total 100.0
Mean = 74.32%
Table 2b: IndiWork Total Scores 2013/14 & 2014/15 (n = 4,915; minimum required: 50%)
Percent
Cumulative Percent
0 24.99% .5 .5
25% 49.99% 3.7 4.2
50% 59.99% 52.1 56.3
60% 69.99% 17.6 73.9
70% 79.99% 12.6 86.5
80% 89.99% 9.1 95.6
90% 100% 4.4 100.0
Total 100.0
Mean = 62.06%
The high completion rate across all three cohorts of students (2012/13 to 2014/15) shows that students were -learning completion requirement. Although meeting the minimum requirement does not lead to a higher course grade, failure to complete IndiWork results in a reduction of the course grade. This seems to provide a sufficiently strong incentive for students to engage with e-learning. A more in-depth