Research Paper: Risk Assessment of Surgical Procedures in
a Referral Hospital
Fatemeh Rezaei1, Mohammad Yarmohammadian2, Yasamin Molavi Taleghani1, Hojjat Sheikhbardsiri3*
1. Department of Health in Disasters and Emergencies, Faculty of Management and Medical Informatics, Isfahan University of Medical Sciences, Isfahan, Iran.
2. Health Management and Economics Research Center, Faculty of Management and Medical Informatics, Isfahan University of Medical Sciences, Isfahan, Iran.
3. Student Research Committee, School of Management and Medical Information Sciences, Isfahan University of Medical Sciences, Isfahan, Iran.
* Corresponding Author:
Hojjat Sheikhbardsiri, PhD Candidate
Address: Student Research Committee, School of Management and Medical Information Sciences, Isfahan University of Medical Sciences, Isfahan, Iran.
E-mail: hojat.sheikhbardsiri@gmail.com
Background: Adverse Events (AEs) due to failure in healthcare procedures are common. These procedures are often evaluated independently. The objectives of this study are to investigate the nature of the failures in healthcare procedures of the surgical patients, assessing the frequency of these failures and preventability, and exploring their consequences, underlying causes, and prevention strategies in a referral hospital in the center of Iran.
Materials and Methods: This study is a prospective quantitative and qualitative research. Focus Group Discussion (FGD) meetings have been conducted to understand potential failures, their consequences, causes, and prevention strategies. Afterwards, the frequencies of these concepts have been determined separately in predefined subcategories in each step of the process.
Results: The first phase of the patient care process was the most risk-prone phase. Temporary or permanent disability at the time of discharge (final impacts), inflammation/infection (injuries), the rule-based behavior associated with coordination (causes), information and communication, preventability more than 50 were the most frequent failures and had achieved the highest score.
Conclusion: Failures of healthcare processes are preventable to a high degree, although patients injure frequently. Interventions to mitigate these failures will enhance the reliability of surgical procedures.
A B S T R A C T
Article info:Received: 02 Jun. 2017 Accepted:15 Sep. 2017
Keywords:
Risk assessment, Patient care management, Health risk, Patient safety, Surgical procedures
Citation: Rezaei F, Yarmohammadian M, Molavi Taleghani Y, Sheikhbardsiri H. Risk Assessment of Surgical Procedures
in a Referral Hospital. Health in Emergencies and Disasters Quarterly. 2017; 3(1):21-30. https://doi.org/10.29252/nrip.hdq.3.1.21
:
: https://doi.org/10.29252/nrip.hdq.3.1.21 Use your device to scan
and read the article online
1. Introduction
atient safety and health services quality have become the most critical priority in the modern surgical care [1]. Complex environ-ments in which multiple processes carried
out by large multidisciplinary teams are uncertain [2]. The surgical ward has been required to avoid care fail-ures and Adverse Events (AEs) by increasing communi-cation and synchronization with other wards [3]. Failures at various steps in patient journey could occur despite all efforts of the healthcare professionals. Process failures
would cause serious injuries, increase the length of hos-pital stay and waste resources [4].
Despite this, the rate of AEs (14%) associated with surgical procedures is high [5]. Sukumar, et al. have demonstrated that 12.9% of inpatients undergoing ma-jor oncological procedures were exposed to unintended hospital-acquired AEs by using Patient Safety Indica-tors (PSI) [6,7]. However, 37.9% of them are consid-ered potentially preventable surgical AEs [8]. On the other hand, although there has been a great attempt to understand contributory factors in the operating room (OR) prospectively to develop evidence-based inter-ventions, [9,10] main studies which investigate surgi-cal AEs are retrospective reports. However, recorded review and prospective incident-based report which can not be compared are limited by voluntary report -ing bias [11,12].
Significant improvements depend profoundly on an understanding of surgical AEs comprehensively. Im-provement of patient safety should identify the most sig-nificant causes of preventable harms to the patient, and consequences of AEs [8,13]. Also, focusing exclusively on the frequency of AEs and neglecting healthcare pro-cesses that underlie them has been criticized [14]. Since a single AE may have multiple causes, consequences and defensive barriers (preventability) in each phase of the healthcare procedures [9]. For example, clinical audit often assesses individual healthcare procedures, and as a result, fewer process failures is demonstrated regard-ing their frequency, relative risk, and cumulative effect on the surgical patient [4].The purpose of this study was to investigate the frequency and nature of failures in the healthcare procedures of the surgical patient journey for elective surgical patients. Additionally, final impacts and injuries, causes, preventability, and prevention strategies were also determined.
2. Materials and Methods
This study is a prospective quantitative and qualita-tive research in a referral hospital in the center of Iran. Regarding qualitative research, the most vulnerable and essential process that has potentiality caused AEs were determined. This achieved by the agreements of Focus Group Discussion (FGD) members during initial meetings. FGD Members consisted of a multi-disciplinary team with the involvement of responsible deeply experienced individuals and critical informant leaders in the ward. Inclusion criteria for this group were considered at least 20 years of experience and seniority. Therefore, the FGD Members were head
nurses of surgical ward, anesthesia and recovery care teams and subordinate personnel, physicians and ex-perts of clinical governance and accreditation units who were responsible for hospital risk assessment.
Except conducting discussion meetings, interviews with each FGD members were also considered in this study. FGD Members were responsible for predict-ing failure modes and related AEs. In this study, we reviewed the literature and offered FGD Members to express final impacts, injuries, causes, prevention strategies, and preventability of each predicted failure modes in a single format with predefined themes from previous studies. They accepted and also included their implications. Thus, following categories applied as a guide in this study:
Final impact
Death as a result of an AE, prolonged hospital (surgical ward) stay, extra treatment (extra intervention), readmis-sion to the hospital (surgical ward), temporary or perma-nent disability at the time of discharge (after surgery), suboptimal care, physical injury, mental injury, inconve-nience [11,15], Lack of treatment audit before starting procedures, misidentification, exceeded workload, legal liability, and unidentified.
Injury
Inflammation/infection, bleeding/hematoma, injury by mechanical/physical or chemical cause, other func-tional disorders, accumulation/leakage of body fluids, symptoms without diagnosis, abnormal wound healing, fistula formation, shock, necrosis/infarction, thrombosis/ embolism, ischemia/heart failure, pressure ulcers, rejec-tion/allergy/other immunological reactions and other/ non-specified categories.
Causes
The categories of the Eindhoven Classification Model (PRISMA-Medical version) was utilized in this study [16,17] (Appendix A).
Preventability
The degree of preventability of AEs was measured on a six-point scale including according to Zegers et al. study: “Virtu-ally no evidence of preventability, Slight to modest evidence of preventability, preventability not very likely, less than 50 close call, preventability more than likely, more than 50 close call, strong evidence of preventability” [18].
Preventive strategies
Merten et al. purposed ten categories for possible strategies to prevent AEs as following: “quality assur-ance/peer review, training, evaluation, procedures, mo-tivation, information and communication, technology/ equipment, personnel, scaling up, financial investment and others” [19].
Regarding quantitative research, we were going to seek the frequency of predicted sub-categories at each step of the process. Therefore, we would be able to anticipate the critical points of the process in the future to turn the attention of hospital management. Consequences (final impact and injuries), causes, and prevention strategies were analyzed using descriptive statistics and frequency tables and figures. Means of scores given by five key informant members of the team were considered for preventability levels. Ethical approval has been granted
by the medical board of the Hospital that is affiliated to Isfahan University of medical sciences in Isfahan-Iran.
3. Results
Five steps of the patient journey in surgical wards were developed by FGD Members. For this process 85 poten-tial failure modes were found. The most failures (about 36.4%) were anticipated to occur in phase one named “Required actions before entering the surgical ward” and the least (about 8.2%) in the phase fifth named “Trans-fer of patient from recovery bay to Intensive Care Unit (ICU) or related ward”. It’s important to know that as a failure is passing through coherent steps without any detection, the consequences would be worse. Therefore, FGD members confirmed and emphasized the preven-tion of failures before starting surgical procedures.
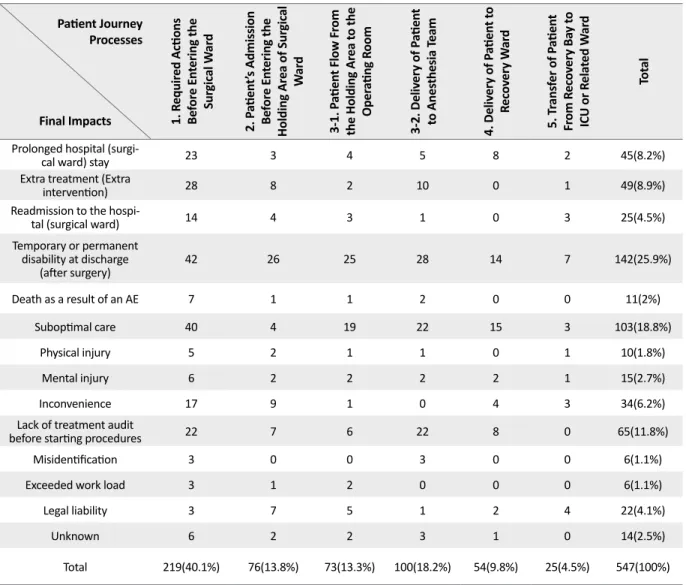
Table 1. Final impacts frequency in each five sub-process phase of the patient journey
Patient Journey
Processes
Final Impacts 1. R
equir ed Actions Be for e En tering the Sur gic al W ar d 2. P atien t’s Admission Be for e En tering the Ho lding Ar
ea of Sur
gi cal Wa rd 3-1. P atien t Flo w Fr om
the Holding Ar
ea t o the Oper ating R oom 3-2. Deliv er
y of P
atien t to Anes thesia T eam 4. Deliv er
y of P
atien t t o Rec ov er y W ar d 5. T rans
fer of P
atien t Fr om R ec ov er y B ay t o
ICU or R
ela ted W ar d Tot al
Prolonged hospital
(surgi-cal ward) stay 23 3 4 5 8 2 45(8.2%)
Extra treatment (Extra
intervention) 28 8 2 10 0 1 49(8.9%)
Readmission to the
hospi-tal (surgical ward) 14 4 3 1 0 3 25(4.5%)
Temporary or permanent disability at discharge
(after surgery) 42 26 25 28 14 7 142(25.9%)
Death as a result of an AE 7 1 1 2 0 0 11(2%)
Suboptimal care 40 4 19 22 15 3 103(18.8%)
Physical injury 5 2 1 1 0 1 10(1.8%)
Mental injury 6 2 2 2 2 1 15(2.7%)
Inconvenience 17 9 1 0 4 3 34(6.2%)
Lack of treatment audit
before starting procedures 22 7 6 22 8 0 65(11.8%)
Misidentification 3 0 0 3 0 0 6(1.1%)
Exceeded work load 3 1 2 0 0 0 6(1.1%)
Legal liability 3 7 5 1 2 4 22(4.1%)
Unknown 6 2 2 3 1 0 14(2.5%)
This suggests that before phase three which is divided into two parts: “1. Patient flow from the holding area to the OR; and 2. Delivery of patient to anesthesia care team”. However, we decided to investigate descriptive statistics of potential failures claimed by FGD members in the following aspect: final impacts, injuries, causes, preventability and prevention strategies which were predicted. These elements were defined separately for each step of the process (Tables 1 and 2, Figures 1,2,
and 3). Table 1 describes final impacts categories as a subset of the clinical AEs consequences. Temporary or permanent disability at the time of discharge (after surgery) is shown to be the most frequent final impact (25.9%). This table also demonstrated that phase one failures were more susceptible to have these ultimate consequences (40%). The least final consequence was in phase five as this was predicted correctly by FGD Figure 1. ECM categories and subcategories percentage
P T D D D
C
T
O
O
T
members. Misidentification and exceeded workload were the final impacts of few failures.
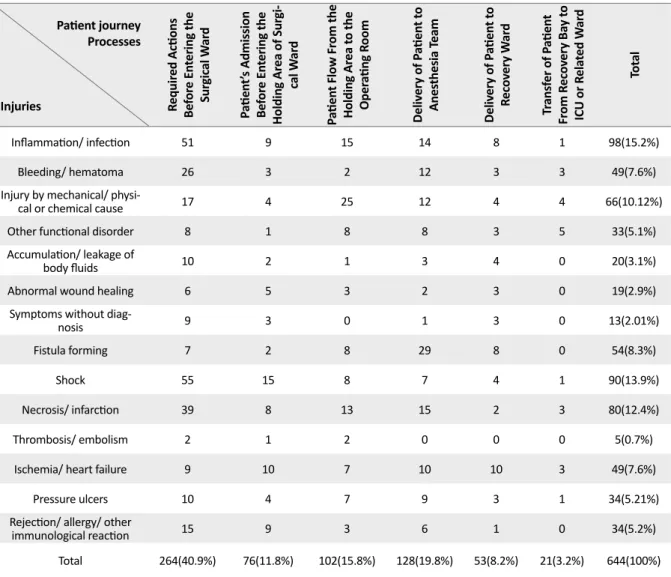
Table 2 describes injuries categories as the second subset of the clinical AEs consequences. Inflamma-tion/infection is shown to be the most frequent in-jury (15.2%). Again, failures of phase one were more susceptible to have these injuries (40.9%). The least injures were anticipated to occur in phase five as the most preventable point in the process, and susceptibil-ity to failures would decrease after phase 3. Thrombo-sis and Embolism were the least injuries that would be caused by anticipated failures.
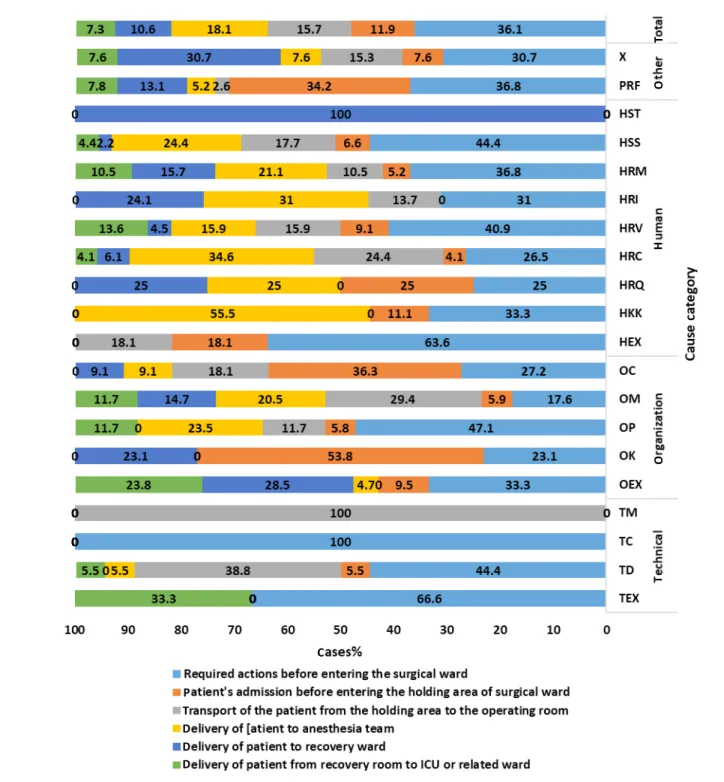
Eindhoven Classification Model (ECM) categories and subcategories percentage are shown in Figure 1. The highest score (36.1%) was accrued to phase one as the most causes of failure modes originated from not imple-menting required actions before entering the surgical
ward. For example, not reserving the ICU beds, lack of coordination between surgery and anesthesia care teams, missing blood sample tags, not determining which part of the patient’s body needs surgery in HIS, etc. About 7.3% of causes were accrued to phase five showing the least causes of failures rooted in this phase. HRC (Rule-based behavior associated with Coordination) became the most frequent cause of failures (12.4%). TM (Tech-nical-materials latent conditions) and HST (Skill-based behavior -Tripping active human errors) categories were included the lowest number of causes of failures.
Figure 2 contains prevention strategies percentage per phase. As the most causes and clinical consequenc-es are related to correct patients admission in phase one, it is clear that prevention strategies should be per-formed more than others in the first phase. Information and communication determined the most appropriate strategy to be employed in our surgical ward. The need Table 2. Injuries frequency in each five sub-process phase of the patient journey
Patient journey Processes Injuries Requir ed Actions Be for e En tering the Sur gic al W ar d Pa tien t’s Admission Be for e En tering the Holding Ar
ea of Sur
gi -cal W ar d Pa tien t Flo w Fr om the Holding Ar ea t o the Oper ating R oom Deliv er
y of P
atien t t o Anes thesia T eam Deliv er
y of P
atien t t o Rec ov er y W ar d Tr ans
fer of P
atien t Fr om R ec ov er y B ay t o
ICU or R
ela ted W ar d Tot al
Inflammation/ infection 51 9 15 14 8 1 98(15.2%)
Bleeding/ hematoma 26 3 2 12 3 3 49(7.6%)
Injury by mechanical/
physi-cal or chemiphysi-cal cause 17 4 25 12 4 4 66(10.12%)
Other functional disorder 8 1 8 8 3 5 33(5.1%)
Accumulation/ leakage of
body fluids 10 2 1 3 4 0 20(3.1%)
Abnormal wound healing 6 5 3 2 3 0 19(2.9%)
Symptoms without
diag-nosis 9 3 0 1 3 0 13(2.01%)
Fistula forming 7 2 8 29 8 0 54(8.3%)
Shock 55 15 8 7 4 1 90(13.9%)
Necrosis/ infarction 39 8 13 15 2 3 80(12.4%)
Thrombosis/ embolism 2 1 2 0 0 0 5(0.7%)
Ischemia/ heart failure 9 10 7 10 10 3 49(7.6%)
Pressure ulcers 10 4 7 9 3 1 34(5.21%)
Rejection/ allergy/ other
immunological reaction 15 9 3 6 1 0 34(5.2%)
for prevention strategies complies with the following order: Information and communication, quality as-surance/peer review, procedures, training, evaluation, scaling up, motivation, technology/equipment, per-sonnel and financial investment.
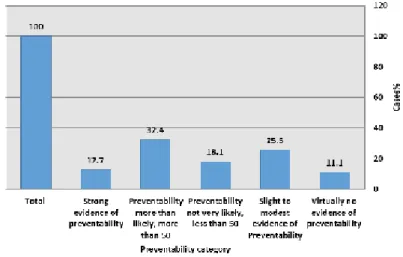
Figure 3 demonstrates the preventability of failures based on FGD member experience. Preventability more than 50 had given the highest score (32.4%). Just a few of failures had no evidence of preventability (11.1%). Fail-ures in the first phase had more evidence of preventability.
4. Discussion
During FGD meetings, decision makers, invited pro-fessionals, and representatives of other hospital wards or
units emphasized focusing on prevention strategies pre-cisely before starting the operation which means before patient flow from the holding area to the OR (Phase 3). They apparently disagreed with the representatives of the surgical department who considered the first phases of the process to be more significant in prevention. This means, required actions before entering the surgical ward and patient admission before entering the holding area. In the last meeting, results of their previous discussion about final impacts, injuries, causes, prevention strate-gies, and preventability of failures were unveiled, and they were surprised as the results showed that possible final impacts, injuries, causes, prevention strategies and preventability of failures are more frequent in phase one. We conducted this study to extract significant themes declared about potentially patient’s failures in surgical Figure 2. prevention strategies percentage per phase
process and quantifying the consequences, causes and preventability of surgical AEs. We also analyzed pro-posed prevention strategies to overcome failures that have an effect on patient safety in surgical procedures.
These aims were partly achieved because of insuffi-cient data about near miss reports. Oliver Anderson and colleagues [8] distinguished between surgical AEs and preventable surgical AEs. Distinct categories of con-sequences were introduced for each of them. Clinical injuries considered as consequences of AEs included number of surgical records, wound problems, bleeding, sepsis (including abscess), cardiovascular, cerebrovas-cular and respiratory for preventable AEs. Number of surgical records, wound problems, genitourinary, cardio-vascular, gastrointestinal, respiratory, anesthesia, fluid/ electrolytes/renal, medication, anastomotic leak, intra-operative, bleeding, sepsis (including abscess), throm-boembolic and cerebrovascular for AEs. This study also distinguished between consequences and outcomes of AEs. Outcomes were measured by severity degrees of fatal, severe, moderate, and minor.
Outcomes are equivalent to the concept of final impacts in our study. We predicted preventability of each AE be-cause the FGD members believed that there would be some degree of preventability for most failures and then statistics showed that just 11% of failures had virtually no evidence of preventability. Symons and colleagues [4] concluded that clear, unambiguous processes, such as prescribing and administration of medication, have a high degree of preventability. Therefore, this could be implied that fewer incidents were due to unexpected and unpreventable events and more failures occurred in rou -tine procedures. About 89% of failures were regarded as potentially preventable in this study, and this was esti-mated from 37.9% to 85% in other studies [4,8,20-22].
Inflammation and infection were more frequent as a minor harm than the others. This was also demonstrated in Vincent study as wound problems and most frequent potential consequence of surgical AEs [23]. Death as a result of AEs, misidentification and exceeded workload had a lower percentage. Similar results in fatal and minor outcomes were demonstrated in Anderson’s study [8]. However, Extra treatment and extra intervention such as required ICU care or (re)admission ranged from 1.1% to 37.2% in other studies [24]. Causative types of surgical AEs proposed in previous studies as the most common categories included: number of surgical records, error in surgical technique/operative management, all nonopera-tive management failures, monitoring error, unreliable or delayed treatment, diagnostic failures/delay, medication
error, anesthesia error, and error in judgment/outside ex-pertise [8,20,23].
In the present study rule-based behavior associated with coordination as the nonoperative management causes were more frequent than technical-based and skilled-based behavior which corresponds to Kable and Vincent study. Coordination problems included causes such as not performing anesthesia consultation before admission, not prioritizing patients who should be op-erated, not informing critical laboratory values and not cross-checking patient’s documents at the time of admis-sion by inpatient ward nurse and surgical ward nurse.
Clear intercommunication procedures of treatment team have been shown applicable strategies to improve patient safety and consistent delivery of care as more than half of AEs were caused by either delays or lack of communication [4,25]. Although we demonstrated com-munication and information related strategies as a pos-sible defensive barriers; we focused more on communi-cation between surgical /anesthesia teams and patients (and also their family) and interdepartmental informa -tion exchange through predefined procedures. Some ex-amples of related failures are lack of explanation about the satisfaction forms to the patient, not informing other personnel about patient bedsore and not monitoring pa-tient’s data in HIS system.
In the referral hospital used in this investigation, WHO surgical safety checklist [26] was used as a pre-vention strategy. However, this was not filled out by all involved participants in the patient journey. In fact fill-ing out the checklist was the duty of anesthesia techni-cians and other personnel would not crosscheck this. We recommend Surgical Patient Safety System (SUR-PASS) checklist, a patient-center multidisciplinary list that covers the entire surgical patient pathway [27]. As most of the incidents would occur in the period be-fore a surgical procedure and following a surgical pro-cedure, intercepting incidents by only using a single checklist in the OR is under question [28].
The location of surgical AEs was described in detail in this study. The most frequent potential failures, causes, and preventability existed in phase one. Also, other re-searchers confirmed that preventable surgical fatalities in the ward or intensive care unit are 53% of all 47% fa-talities related to surgery. That is the result of significant number of AEs occurred in monitoring patients follow-ing a surgical operation and daily care of them [29,30]. This result emphasizes that more improvement efforts at the ward and other areas within the hospital are required.
There was some overlap between ECM categories iden-tified in the present study. For example, not informing the surgical ward head nurse about the exact number and types of surgical procedures would lead to lack of coordi-nation with inpatient ward or Coronary Care Unit (CCU) and ICU. This kind of failure could be placed into two categories: first, HRC, because the head nurse of the se-lected referral hospital claimed that physicians wouldn’t persuade to inform the ward about the number and types of the surgeries in advanced. Second, O-ex, systematic failures would expose them to numerous unpredictable patients. The causes of failures might be in emergency patients, day clinic admission, economic incentives (by the physicians or the hospital), and the role of a referral hospital. To overcome this limitation, FGD members tried to make an agreement for one category or both. Also, sub-jective judgments made to estimate preventability.
5. Conclusion
Improvement efforts of the surgical AEs have been demonstrated that patient safety should not only focus on causes of failures in surgical techniques but also fo-cus on coordination of all hospital wards and manage-ment procedures. Azari Rad recommends scheduling the surgeons weekly based on the patients’ length of stay is required to manage perioperative procedures [31]. We recommend that future studies will document both AEs and near miss (close call) events, experiences of critical stakeholders, critical reporting forms, and report the fre-quency, severity, and preventability of events.
These data will identify and prioritize surgical patient safety improvement efforts. Also, the involvement of professionals in multidisciplinary focus discussions is the main prerequisite in conducting effective medical re-views. Also, a physician-center program might be a more acceptable in contrast to nursing-led initiatives in other settings [32]. We have used a prospective approach to review the investigation of surgical AEs, but methods of medical record were more frequent in previous studies. Medical record reviews might lead to an underestimation of AEs. The quality of the medical records is often unre-liable as incomplete information was documented [24].
However, we need both prospective and retrospective approaches to enhance the validity of results. Observa -tional studies have also been recommended to identify the underlying causes of process failures and AEs. Un-derstanding the origins of failure more profoundly leads us to apply quality improvement strategies appropriately and uncover changes in healthcare process and failure patterns before and after interventions [4].
Acknowledgements
This research did not receive any specific grant from funding agencies in the public, commercial, or not-for-profit sectors.
Conflict of Interest
The authors declared no conflicts of interest.
References
[1] Johnston M, Arora S, Anderson O, King D, Behar N, Darzi A. Escalation of care in surgery. Annals of Surgery. 2015; 261(5):831–8. doi: 10.1097/sla.0000000000000762
[2] Donchin Y. A look into the nature and causes of human er-rors in the intensive care unit. Quality and Safety in Health Care. 2003; 12(2):143–7. doi: 10.1136/qhc.12.2.143
[3] Nagpal K, Vats A, Ahmed K, Vincent C, Moorthy K. An evaluation of information transfer through the continuum of surgical care. Annals of Surgery. 2010; 252(2):402–7. doi: 10.1097/sla.0b013e3181e986df
[4] Symons NRA, Almoudaris AM, Nagpal K, Vincent CA, Moorthy K. An observational study of the frequency, sever-ity, and etiology of failures in postoperative care after major elective general surgery. Annals of Surgery. 2013; 257(1):1–5. doi: 10.1097/sla.0b013e31826d859b
[5] De Vries EN, Ramrattan MA, Smorenburg SM, Gouma DJ, Boermeester MA. The incidence and nature of in-hospital adverse events: A systematic review. Quality and Safety in Health Care. 2008; 17(3):216–23. doi: 10.1136/qshc.2007.023622 [6] Sukumar S, Roghmann F, Trinh VQ, Sammon JD, Gervais
M-K, Tan HJ, et al. National trends in hospital-acquired preventable adverse events after major cancer surgery in the USA. BMJ Open. 2013; 3(6):e002843. doi: 10.1136/bmjo-pen-2013-002843
[7] Agency for Healthcare Research and Quality. Patient safety indicators overview. Rockville: Agency for Healthcare Re-search and Quality; 2017.
[8] Anderson O, Davis R, Hanna GB, Vincent CA. Surgi-cal adverse events: A systematic review. The American Journal of Surgery. 2013; 206(2):253–62. doi: 10.1016/j.amj-surg.2012.11.009
[9] Yarmohammadian M, Ferdosi M, Haghshenas A, Rezaei F. Developing an integrated clinical risk management model for Hospitals. International Journal of Health System and Disaster Management. 2013; 1(4):221. doi: 10.4103/2347-9019.130740
[10] Molavi Taleghani Y, Seyedin H, Vafaee Najar A, Ebrahimi-pour H, Pourtaleb A. Risk assessment of drug management process in women surgery department of Qaem Educational Hospital (QEH) using HFMEA method (2013). Iranian Jour-nal of Pharmaceutical Research. 2015; 14(2):495-504. PMCID: PMC4403066
[11] Van Wagtendonk I, Smits M, Merten H, Heetveld MJ, Wagner C. Nature, causes and consequences of unintended events in surgical units. British Journal of Surgery. 2010; 97(11):1730–40. doi: 10.1002/bjs.7201
[12] Michel P. Comparison of three methods for estimating rates of adverse events and rates of preventable adverse events in acute care hospitals. BMJ. 2004; 328(7433):199–0. doi: 10.1136/bmj.328.7433.199
[13] Aranaz Andres JM, Aibar Remon C, Vitaller Burillo J, Re-quena Puche J, Terol Garcia E, Kelley E, et al. Impact and preventability of adverse events in Spanish public hospitals: Results of the Spanish National Study of Adverse Events (ENEAS). International Journal for Quality in Health Care. 2009; 21(6):408–14. doi: 10.1093/intqhc/mzp047
[14] Rezaei F, Yarmohammadian M, Ferdosi M, Haghshenas A. Principles of risk management in surgery departments. Archives of Clinical and Experimental Surgery (ACES). 2015; 4(3):126. doi: 10.5455/aces.20140925015830
[15] Zegers M, de Bruijne MC, de Keizer B, Merten H, Groe-newegen PP, van der Wal G, et al. The incidence, roo causes, and outcomes of adverse events in surgical units: implication for potential prevention strategies. Patient Safety in Surgery. 2011; 5(1):13. doi: 10.1186/1754-9493-5-13
[16] World Health Organization. The conceptual framework for the international classification for patient safety (v.1.1): Fi-nal technical report and technical annexes. New York: World Health Organization; 2010.
[17] Van Vuuren W, Shea CE, van der Schaaf TW, Technische hogeschool (Eindhoven, Pays Bas). The development of an incident analysis tool for the medical field. Eindhoven: Eind-hoven University of Technology; 1997.
[18] Zegers M, de Bruijne MC, Wagner C, Groenewegen PP, Waaijman R, van der Wal G. Design of a retrospective pa-tient record study on the occurrence of adverse events among patients in Dutch hospitals. BMC Health Services Research. 2007; 7(1). Doi: 10.1186/1472-6963-7-27
[19] Merten H, Johannesma PC, Lubberding S, Zegers M, Langelaan M, Jukema GN, et al. High risk of adverse events in hospitalised hip fracture patients of 65 years and older: Re-sults of a retrospective record review study. BMJ Open. 2015; 5(9):e006663. doi: 10.1136/bmjopen-2014-006663
[20] Kable AK, Gibberd RW, Spigelman AD. Adverse events in surgical patients in Australia. International Journal for Quality in Health Care. 2002; 14(4):269–76. doi: 10.1093/in-tqhc/14.4.269
[21] Marquet K, Claes N, De Troy E, Kox G, Droogmans M, Schrooten W, et al. One fourth of unplanned transfers to a higher level of care are associated with a highly preventable adverse event. Critical Care Medicine. 2015; 43(5):1053–61. doi: 10.1097/ccm.0000000000000932
[22] Fraher EP, Knapton A, Sheldon GF, Meyer A, Ricketts TC. Projecting surgeon supply using a dynamic mod-el. Annals of Surgery. 2013; 257(5):867–72. doi: 10.1097/ sla.0b013e31826fccfa
[23] Vincent C. Adverse events in British hospitals: Preliminary retrospective record review. BMJ. 2001; 322(7285):517–9. doi: 10.1136/bmj.322.7285.517
[24] Vlayen A, Verelst S, Bekkering GE, Schrooten W, Hellings J, Claes N. Incidence and preventability of adverse events re-quiring intensive care admission: A systematic review. Jour-nal of Evaluation in Clinical Practice. 2011; 18(2):485–97. doi: 10.1111/j.1365-2753.2010.01612.x
[25] Haynes AB, Weiser TG, Berry WR, Lipsitz SR, Breizat A-HS, Dellinger EP, et al. A surgical safety checklist to reduce morbidity and mortality in a global population. New Eng-land Journal of Medicine. 2009; 360(5):491–9. doi: 10.1056/ nejmsa0810119
[26] Mahajan RP. The WHO surgical checklist. Best Practice & Research Clinical Anaesthesiology. 2011; 25(2):161–8. doi: 10.1016/j.bpa.2011.02.002
[27] De Vries EN, Hollmann MW, Smorenburg SM, Gouma DJ, Boermeester MA. Development and validation of the SUR-gical PAtient Safety System (SURPASS) checklist. Quality and Safety in Health Care. 2009; 18(2):121–6. doi: 10.1136/ qshc.2008.027524
[28] De Vries EN, Prins HA, Bennink MC, Neijenhuis P, van Stijn I, van Helden SH, et al. Nature and timing of incidents intercepted by the SURPASS checklist in surgical patients. BMJ Quality & Safety. 2012; 21(6):503–8. doi: 10.1136/bm-jqs-2011-000347
[29] Calland JF, Adams RB, Benjamin DK, O’Connor MJ, Chan-drasekhara V, Guerlain S, et al. Thirty day postoperative death rate at an academic medical center. Annals of Surgery. 2002; 235(5):690–8. doi: 10.1097/00000658-200205000-00011 [30] Neale G, Woloshynowych M, Vincent C. Exploring the
causes of adverse events in NHS hospital practice. Journal of the Royal Society of Medicine. 2001; 94(7):322-30.
[31] Linden AF, Sekidde FS, Galukande M, Knowlton LM, Chackungal S, McQueen KAK. Challenges of surgery in developing countries: A survey of surgical and anesthesia capacity in Uganda’s public hospitals. World Journal of Sur-gery. 2012; 36(5):1056–65. doi: 10.1007/s00268-012-1482-7 [32] Dunn KL. Medical record review of deaths, unexpected
intensive care unit admissions, and clinician referrals: Detec-tion of adverse events and insight into the system. Archives of Disease in Childhood. 2005; 91(2):169–72. doi: 10.1136/ adc.2005.074179
Appendix A. The categories of the Eindhoven Classification Model
Description Subcategory (Code)
Main Category
Latent Conditions
Technical failures beyond the control and responsibility of the investigating organization
External (T-ex)
Technical Design (TD) Failures due to poor design of equipment, software, labels or forms
Correct design, but not appropriately constructed or set up in inaccessible areas Construction (TC)
Material defects not classified under TD or TC Materials (TM)
Failures at an organizational level beyond the control and responsibility of the investigating organization, such as in another department or area (address by collaborative systems) External (O-ex)
Organizational
Failures resulting from inadequate measures taken to ensure that situational or domain-specific knowledge or information is transferred to all new or inexperienced staff Knowledge (OK)
Failures relating to the quality and availability of protocols within the department (too complicated, inaccurate, unrealistic, absent or poorly presented)
protocols (OP)
Internal management decisions in which safety is relegated to an inferior position when faced with conflicting demands or objectives. This is a conflict between production needs
and safety. Example: decisions made about staffing levels Management
priori-ties (OM)
Failures resulting from collective approach and its attendant modes of behavior to risk in the investigating organization
Culture (OC)
Human failures are originating beyond the control and responsibility of the investigating organization. This could apply to individuals in another department
External (H-ex)
The inability of an individual to apply his or her existing knowledge to a novel situation Knowledge-based
behavior (HKK) Knowledge
based behavior
The incorrect fit between an individual’s training or education and a particular task Qualifications (HRQ)
Rule based behavior
Lack of task coordination within a healthcare team in an organization Coordination (HRC)
Correct and complete assessment of a situation including related conditions of the patient and materials to be used before starting the intervention
Verification (HRV)
Failures that result from faulty task planning and execution Intervention (HRI)
Monitoring a process or patient status Monitoring (HRM)
Failures in the performance of highly developed skills Slips (HSS)
Skill based
behavior Failures in whole-body movements. These errors are often referred to as ''slipping, tripping
or falling'' Tripping (HST)
Failures related to patient characteristics or conditions, which are beyond the control of staff and influence treatment
Patient related factor (PRF) Patient related
Failures that cannot be classified in any other category Unclassifiable (X)