Modeling of Metal-Mold Interface Resistance
in the Al-11.5 wt% Si Alloy Casting Process
S.M.H. Mirbagheri
, M. Shirinparvar
1and P. Davami
2In this investigation, a computational model has been developed, including heat transfer and the eects of the resistance of a metal-mold interface and pressure, for simulation of the solidication process. Simulation of the interface resistance is based on the Zero Thickness Element (ZTE), utilizing the Finite Element Method (FEM). Solid boundary conditions, including contact resistances, have been modied by a pressure gradient in each of the ZTE. The pressure gradient has been modeled, based on experimental data. In order to verify the computational results, an Al-11.5 wt% Si alloy was poured into a permanent mold and the temperature of the interface was measured by a data acquisition system. Then, the eect of metalo-static pressure on overall heat transfer in the interface resistance was modeled. Comparison between the experimental and simulation results during the solidication process shows a good consistency, which conrms the accuracy of the model for the eects of interface resistance on solidication time.
INTRODUCTION
It is demonstrated that when molten metal is poured into a mold cavity, due to surface tension, surface oxi-dation and mold roughness, there is not only compact contact at the metal-mold interface, but also a contact resistance. Once the cooling process begins, a solid skin develops. Due to contraction of the solid cast and heat expansion of the mold, a gap will be formed between the solidied skin and the mold wall [1]. On the other hand, due to the decomposition of sand binders or evaporation of the refractory coating moisture, gas will ll the gap (gas gap). As a result of this gas gap, the mechanism of heat transfer at the interface becomes pure convection during formation of the solidied skin (not during solidication time). Therefore, gas gap has inuence over the temperature distribution of liquid metal in the mold cavity. To predict the heat conduction of a casting process accurately, it is necessary to consider the eect of gas gap and contact
*. Corresponding Author, Department of Mining and Met-allurgical Engineering, Amirkabir University of Technol-ogy, P.O. Box 15875-4413, Tehran, I.R. Iran.
1. Quality Management, Esfahan Steel Co., 45 Km Zoba-han Freeway, EsfaZoba-han, I.R. Iran.
2. Department of Materials Science and Engineering, Sharif University of Technology, P.O. Box 11365-9466, Tehran, I.R. Iran.
resistance on the simulation. Some researchers [2,3] have used a quasi thin element model and coincident nodes technique, based on the FEM at the solid boundary. However, in the thin element model, the size of the gas gap and its variation during the process of solidication, must be known. Also, due to the large aspect ratio of the thin element, error will increase drastically. Moreover, in coincident nodes techniques, element properties are not satised and, consequently, the physics of the problem will be changed.
Contact resistance, gas gap formation and pres-sure are fundamental factors in the solidication rate and their eects on casting are substantial [3,4]. A 10-seconds delay in the formation of the gas gap may cause 10 percent decrease in the solidication time [5]. However, increasing metalo-static pressure could reduce the solidication time. This means that, considering contact resistance, gas gap and pressure are very essential in predicting the solidication time correctly. Therefore, in the present work, in addition to simulating metal-mold heat resistance by the ZTE method, the eect of pressure was also modeled, based on the experimental data, by utilizing an overall heat transfer.
METAL-MOLD INTERFACE RESISTANCE
Heat transfer at the metal-mold interface is very much dependent on the type of surface contact and the media
between it. Surface contact of the metal-mold interface may be treated in one of the following ways (Figure 1):
i) Without contact resistance, ii) With contact resistance,
iii) Contact with a thin layer of gas as a media . Complete contact occurs when the surfaces are under high pressure and of high polishing quality. However, apparent contact occurs when the surfaces are not in complete contact, which is usually due to roughness or coating of the mold and low pressure. This resistance exists until a thick solid skin is formed. In this case, heat is transferred through the spread contact point and the gas layer. Gas gap occurs when solid skin is not deformed under metalo-static or external pressure. Due to contraction of the formed metal skin and expansion of the surrounding model surface, heat is transferred mostly through the layer of gas at the interface.
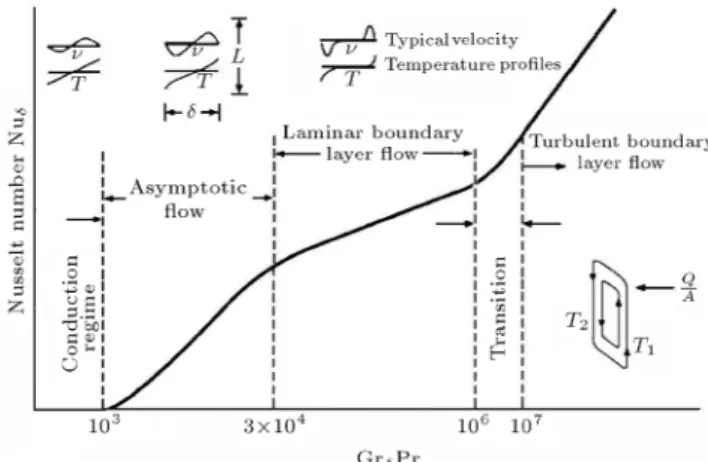
In general, heat is transferred through the gas gap at the interface by means of convection, radiation and gas conduction. Figure 2 demonstrates the condition of the heat transfer at the interface [6].
Figure1. Schematic diagram of metal-mold interface and
temperature distribution.
Figure2. Schematic diagram of the vertical convection
layer and ow regime.
The Grashof number (Gr) is one of the parame-ters, which must be the same in two free convecting systems for them to be dynamically similar. It is dened as follows:
Gr = gTd 3
2
; (1)
where g is gravity, is the thermal expansion
coef-cient, T is the gap temperature dierence, dis the
length scale andis the kinematics viscosity. So, when Gr 1 the viscous force is negligible compared with
the buoyancy force and inertia. Also, the inertial forces are negligible. ForGr1, convection occurs when the
Rayleigh (Ra) number is more than 1700: Ra = gTd
3
= GrPr; (2)
where Pr is the Prandtl number and is dened as follows:
Pr =
= CP kg
;
where CP is the mass heat capacity of gas, kg is the
thermal conductivity of gas,is the thermal diusivity
andis the dynamic viscosity. The Nusselt (Nu)
num-ber gives the ratio of actual heat transferred between two parallel plates (gap) at dierent temperatures by a moving uid to the heat transfer that would occur by conduction. It is dened by:
Nu = hd kg
; (3)
where h is heat transfer coecient. As shown in
Figure 2, mechanisms of heat transfer at the gap (between the mold and the solid skin) are divided into four regimes [6]:
i) Conduction regime for Ra<1000,
ii) Asymptotic ow regime for 1000Ra<10000,
iii) Laminar ow regime 104
Ra<10 6,
iv) Transition ow regime 106
Ra<10 7,
v) Turbulent ow regime for Ra10 7.
Holman believes that a high percentage of heat transfer occurs via gas conduction and radiation de-pending on gap morphology, according to the curve of Figure 2 [6].
It is also possible to dene the temperature prole of the metal-mold interface using the Knudsen number (Kn). The small value of the mean free path, (), [6]
compared with the size of gas gap, (d), conrms that
the temperature prole at the interface of casting can always be assumed linear and continuous [7]:
Kn = d
However, Fourier's law of heat transfer can be used at the interface. To calculate the overall heat transfer coecient at the interface, it can be assumed that the media of the interface is a layer of gas with thickness
d. hg=
k d
; (5)
ht= q
A(Tic Tis)
; (6)
where A is interface area, q
is heat ux through
the interface and Tic and Tis are casting and mold
temperature, respectively. Therefore, contact between casting and mold is never perfect (quasi-contact) and could construct an interface resistance between them. Assume hg is the heat transfer coecient, due to the
quasi-contact resistance, based on the algorithm of [5]. According to symbols in Figure 3, the rate of heat passed from cast (point 2) to mold (point 1) through the gas layer,d, can be written as:
Q=kBxy
Tme Tsk
0:5x
; (7)
Q=hgxy(Tsk Tmo); (8) Q=kAxy
Tmo T 0
0:5x
: (9)
This gives:
Tme T 0=
Q
1 2kA
+ 1
hgx
+ 12
kB
=y; (10)
Figure3. Schematic of discretization of the metal-mold
interface. Temperature subscripts are: me= metal liquid,
sk= solidied skin,mo= mold.
wherekB andkA are thermal conductivity coecients
of solidied skin and mold, respectively. Temperatures
Tme, Tsk, Tmo, T
0, and other variables are dened in
the nomenclature. The overall heat transfer coecient,
ht, from point `1' to point `0', is dened by: htx=XAkA;
XA=
2kBhgx hgx(kA+kB) + 2kAkB
; (11)
where X fraction is the thermal resistance coecient
for each node from the mold-metal interface. The corrective coecient for the interface nodes can be written as follows:
Xi 1;j =
2ki 1;j
hgx hgx(ki
1;j+
ki;j) + 2ki 1;j
ki;j
: (12)
Also, by considering the heat balances of point `0': t
" Xi
1;j ki;j(Ti
1;j
Ti;j)+ki;j 1
x(Ti;j 1
Ti;j)
xy
+ki +1;j
x(Ti +1;j
Ti;j)
xy
+ki;j +1
x(Ti;j +1
Ti;j)
xy #
=CP i;j
i;j(Tn +1
i;j Ti;j): (13)
Equations 12 and 13 are discretization forms of Equa-tion 11 and subscripts i and j indicate the x and y directions. Variables in Equations 12 and 13 are
dened as before. It is possible that ht is modeled
experimentally by using some thermocouples in the outside metal-mold interface and by substituting the acquired data into Equations 13.
To predict the position of the metal-mold inter-face and rate of solidication, a xed value ofhtcan be
considered. However, it is clear that this assumption is not accurate enough and the value of ht varies
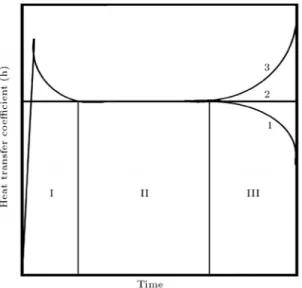
with time and metallurgical parameters. Figure 4 represents a variation of ht with time for a typical
casting process [8]. It is observed that the heat transfer coecient suddenly increases as the process of pouring the melt begins. As melt convection decreases, the heat transfer coecient also decreases, gradually reaches a xed value and remains constant until a solid skin is formed. After this stage, depending on the geometry of the mold and cast, three possibilities may occur, as shown in Figure 4:
1. Decrease in heat transfer coecient, due to forma-tion of a gas gap;
2. Heat transfer coecient remains constant; this usually happens at the bottom of the metal-mold interface;
3. Increase in heat transfer coecient, due to expan-sion of the mold core, as well as contraction of the cast part.
Figure4. Schematic diagram of the heat transfer
coecient with time.
GOVERNING EQUATIONS
The heat transfer equation may be written as [7]:
CP @T
@t
= r:q+S
; q=qx
a i +qy
a j+qz
a k; qx= k
@T @x
; qy = k @T
@y
; qz= k @T
@z
; (14)
where termq is the sum of the heat uxes. The heat
source term in Equation 14 can be obtained, as follows:
S = Hm @fS @t ; (15) @fS @t
= @fS @T
@T @t
: (16)
Variables are dened in the nomenclature. The solid fraction in the mushy zone, with assumption partial-mixing in the liquid and no diusion in the solid, is estimated by Equation 17 [9,10]:
CS=kECL(1 fS)k E
1
; (17)
CS kECL
= Tm T Tm TL
; (18)
where CS is the solid composition at the solid-liquid
interface,CLis liquid composition,fsthe solid fraction
and kE the equivalent partition coecient (between
0 and 1). Also, TL is the liquidus temperature
corresponding to liquid compositionCL andkE. Tmis
the temperature of the melting point. The equivalent distribution coecient,kE, is dened by [1,9]:
kE=
k k + (1 k )exp( R DL )
; (19)
where k
is the partition coecient between solid and
liquid,is the thickness of the segregation layer at the
solid-liquid interface,DL is the liquid diusion
coe-cient and R is solidication (growth) rate [9]. Then,
substituting Equation 18 into Equation 17 yields:
fS = 1
Tm T Tm TL
1 k E 1 : (20)
And, substituting Equation 20 into Equation 16 gives:
@fS @t
=( 1
Tm TL)(kE 1)
Tm T Tm TL
2 k E k E 1 @T @t : (21) Variables of Equation 4 are dened as before. The release of the latent heat between liquidus and solidus temperature is calculated by substituting Equation 21 into Equation 15. To implement this equation, the following assumptions are made:
1. The physical properties of the liquid, solid and mold are assumed constant in the solidication process. However, in the mushy zone, they are, as follows:
kM =fLkL+fSkS; M =fLL+fSS:
2. The overall heat transfer coecient, ht, including
transferred heat, due to contact points, gas gap and radiation (ht=hc+hg+hr), are considered.
Consider the physical domain of (), with bound-aries of ( 1), ( 2) and metal-mold interface ( 3). The
boundary condition is [11,12]:
T(r;t) = ^T(r;t) at
1 Dirichlet B.C.
and:
krT:n=q=h(T T
0) at 2 Neuman B.C.
The initial condition is:
T(r;0) =T
0 in the mold ; T(r;0) =T
Pour in the cast :
FEM Modeling
Due to the symmetrical properties of the cylindrical geometry, the 3D heat transfer equation reduces to a 2D equation, where, through implementation, the
Finite Element Method (FEM) formation may be written as [11]:
[
C
]fT
g+ [
K
]fT
g=fF
g; (22)where f
T
g and fT
gare vectors of the temperatures
and the temperature gradients, respectively. Also, stiness matrix [
K
], capacitance matrix [C
] and force vectorfF
g, are dened, respectively, as:Ki;j = Z
rNj(KrNj)d + Z
2
hbNiNjd 2
; (23) Ci;j =
Z
CPNiNjd; (24)
Fi= Z
2
(q hbT 0)
Nid 2
; (25)
where,NiandNj are elements shape functions, whose
details are explained in [11,12]. T is the nodal
temperature vector, hb is the boundary heat transfer
coecient and T
0 is the ambient temperature. It is
important to note that heat transfer at the central line of the cylinder has been neglected and convection takes place between the cylinder and the surroundings. In this work, the overall heat transfer coecient has been modeled experimentally, which includes the ef-fects of conduction, convection, radiation and contact points (see the following sections).
Due to solving the transient part of Equation 14, the Finite Dierence Method (FDM) technique is used, using themethod, via the time stepping algorithm:
[C+Kt]fCgi +1= [
C (1 )Kt]fCgi
+ [(1 )Fi+Fi +1]
t: (26)
This method includes forward, central and backward dierence schemes, with values of = 0:5 and 1,
respectively [11].
Modeling of Zero Thickness Elements at
Interface
In the casting simulation problem, correct modeling of the interface resistance plays an important role in the accuracy of the results. Ignoring interface resistance in the solidication process could gener-ate an error between 50-100% in the solidication time [12-14]. Most solidication simulation codes do not have the substantially imposed eects of the gas gap in their algorithms and some of them assume that the neighboring elements of cast and mold have full contact. In this simulation, a Zero Thickness Element (ZTE) is introduced for implementation of
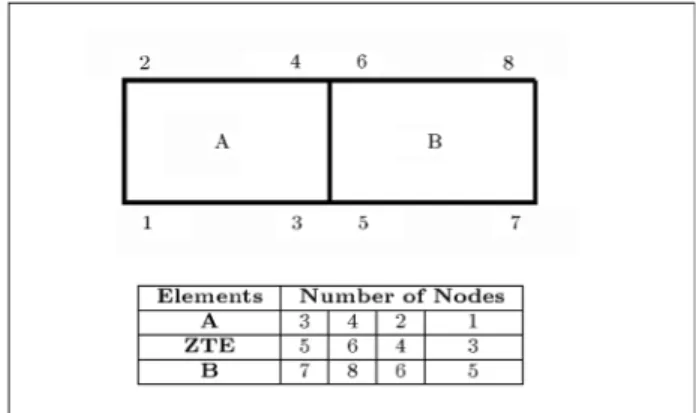
Figure5. Node numbers conguration of ZTE with the
neighboring elements.
the interface resistance [12]. Figure 5 represents such a model at an interface; nodes 3, 4, 5 and 6 are ZTE nodes, connecting elements A and B at the cast and the mold, respectively. Also, Figure 5 shows the node numbers conguration of the ZTE, with the neighboring elements.
Heat is transferred at the interface between ele-ments A and B, by convection, with an overall heat transfer coecient,ht, through ZTE. The shape
func-tion for ZTE, considering the local coordinate system of and, may be written as:
N ZET 1 = 0
:5(1 ); N ZET 2 = 0
:5(1 +): (27)
The stiness matrix for this element is dened as:
Kei;j= Z
3
hNiNjd 3
; (28)
where 3represents the metal-mold boundary and his
the overall heat transfer at the interface. The overall heat transfer coecient may be dened experimentally or calculated mathematically. Finally, Equation 28 may be written as:
Kei;j= 1 Z
1
hNiNjjJjnd; (29)
where n is the unit normal to the surface of the
integration and should be selected properly, based on the physics of the problem.
EXPERIMENTAL SET-UP
The apparatus shown in Figure 6a was designed to measure the temperature and calculate the overall heat transfer coecient (ht). The mold was a Grey Cast
Iron cylinder with an isolated bottom. The samples were cast with Al-11.5 wt% Si alloy. In this experiment, one thermocouple (type K) is inserted into the melt
Figure6. a) Installation of PLC card and the data
acquisition system on the mold; b) Schematics of geometry and dimensions of cylindrical mold.
and one thermocouple attached to the metal-mold interface, in order to show the temperatures of the metal and the interface, respectively (Figure 6b).
Temperature data were acquired utilizing a PLC-32 bit card of 10 kHz, 12 channels and HG818L-advantech. Each experiment was duplicated for reli-ability purposes.
As demonstrated in Figure 6, a ceramic lter was placed between two parts of the mold and, then, molten Pb lled the upper-part of the mold, in order to measure the eect of the pressure on thehtcoecient.
The height of the Pb in the mold varied between 10-50 cm. In order to achieve higher pressure, Pb metal was used in the mold. Because metal-static pressure of Pb is higher, the Al alloy is the same as the height.
Interface and mold wall temperatures were mea-sured experimentally at dierent pressures (Figure 7).
Figure7. Measuring the metalo-static pressure eect on
theT tcurve during solidication process by data acquisition system, M1: HPb= 10, M2: HPb= 20; M3:
HPb= 40; M4: HPb= 50 cm.
RESULTS AND DISCUSSION
In this investigation, a new experimental model has been developed for predicting the eective pressure gradient on the overall heat transfer coecient, ht,
based on experimental data. As shown in Figure 8, it is clear that the head of the metalo-static pressure or eective height, H
e., could alter the
htcoecient.
Therefore, an equivalent ht of H
e. can be obtained,
corresponding to the present mathematical model, as follows:
ht=H
b1 + (a)exp( b(P)n)c;
P =gH e
; (30)
where a = 1:55, b = 10 5 and
n = 3 are equation
coecients, after best tting by the S-PLUS 200 mathematical software. H
e. = H
(
L 2
=2L ) was
dened in Figure 8, H
= sprue height,
L = distance
between the cavity inlet and the top of the mold cavity and 2L
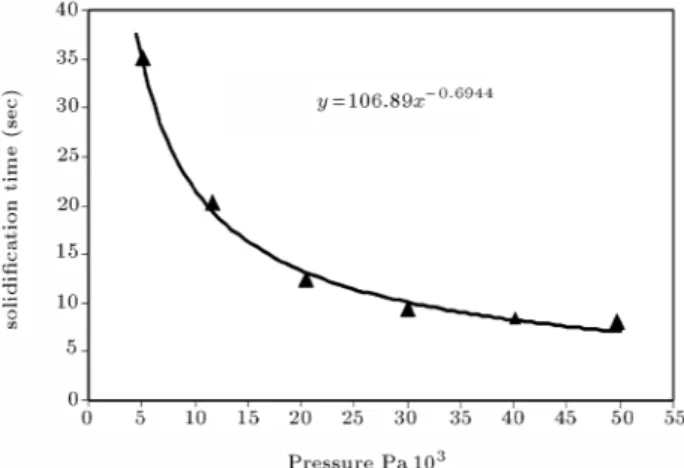
= mold cavity height. Figure 9 shows the
eect of gradient pressure on the solidication time.
Figure 8. Schematic of calculating the eective height in
the gating system design;H: Sprue height,L: Distance
between the cavity inlet and the top of the mold and 2L:
Mold cavity height.
Figure 9. Eect of the metalo-static pressure on the
Figure10. Modeling of the heat transfer coecient (h)
versus the metalo-static pressure; i: Solid skin formation, ii: Solid skin deformation and iii: Solid skin growth.
In this gure, once temperature of the thermocouple in the cylinder center goes below TS, solidication
times are registered and saved. Figure 10 shows the eect of metalo-static pressure on h. For pressures
less than 100-120 KPa, curve P h, in Figure 10, is
divided into 3 dierent zones. Zone i indicates solid skin formation, Zone ii indicates solid skin deformation (increasing contact surface) and Zone iii indicates solid skin growth or saturated zone. It is clear that the heat transfer coecient increases sharply into Zone ii and the mushy skin penetrates into the roughness of the mold wall, leading to perfect contact and increasedht.
Therefore, as shown in Figure 9, solidication time will be reduced.
A simulation of temperature distribution was carried out by using the new model (ht) at each
time step. Due to mold symmetry, only half of the mold was simulated. Figure 11 shows simulation of the temperature distribution during the solidication process of the Al-11.5 wt% Si alloy, based on data presented in Table 1.
Figure11a. Simulation of the eect of contact resistance
on the temperature distribution for Al-11.5 wt% Si with minimum metalo-static pressure (HPb= 0) by the ZTE
model (solidication time = 68.51).
Figures 11a and 11b show the results of temper-ature distribution simulation, by adding to the ZTE model, with minimum (Pb melt head; HPb = 0 cm)
and maximum (Pb melt head; HPb = 50 cm) contact
resistance, respectively. However, Figure 11c shows the
Table 1. Properties of mold and metal for simulation of heat transfer in the casting process.
Property Mold Metal
Material: (% wt) C=2.3, Si=3.2, Mn=0.75, S=hP 0.01 Si=11.5, Fe=0.05, Al=bal
Pouring temperature (C) 1350
5 7755
Thermal conductivity (J/sec. mC) k
L=0:069,kS=0:07,kChalk=0:001 kL=0:42,kS=0:42
Heat of fusion (J/kg) { Hf=0:4186
Specic heat (J/kCg) Cl
p=9:63 10 4,CS
p=8:79 10
4,CChalk
p =9:63 10 4 Cl
p=1:13 10 3,CS
p=1:09 10 3
Density (kg./m3)
S=7300,Chalk=1610, L=2500,S=2600
Transformation temperature (C) { T
L=615 1,T
S=572 1
Time step (sec) 0.25
Number elements N=8746552
CPU time for Pentium IX 600 (h) 38
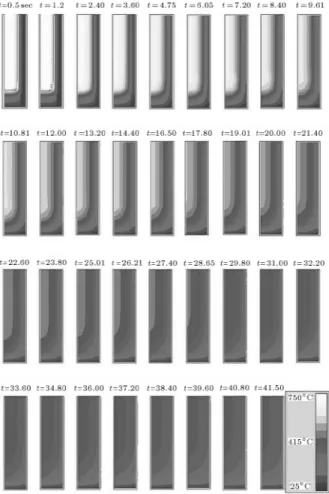
Figure11b. Simulation of eect of contact resistance on
the temperature distribution for Al-11.5 wt% Si with maximum metalo-static pressure (HPb= 50) by the ZTE
model (solidication time = 40.80).
results of temperature distribution simulation without the ZTE model in the case of minimum pressure (Pb melt head; HPb=0 cm). It is evident that the
inter-face eect considered in the present numerical model has resulted in a solidication time and temperature distribution that approaches the experimental result.
The eect of contact resistance on the tempera-ture variation with time at a xed point in the center of the cylinder can be seen in Figure 12. It is seen that, without consideration of the interface resistance eect (gas gap) in low metalo-static pressure (HPb = 0),
an error of 100(68:51 36:02)=68:51 = 47:5% in
solidication time is introduced. However, the error will be 100(40:08 28:86)=40:08 = 28% for high
metalo-static pressure.
The comparison between the experimental and simulation results shows a good level of consistency, which conrms the accuracy of the model for predicting heat resistance at the interface of a metal-mold.
CONCLUSION
i) The heat transfer code developed in this research
Figure 11c. Simulation of eect of contact resistance on
the temperature distribution for Al-11.5 wt% Si with minimum metalo-static pressure (HPb= 0) without the
ZTE model (solidication time = 36.02).
simulates the eect of interface resistance (gas gap) based on the Zero Thickness Element method. It could predict temperature distribution in the metal, as well as in the mold, throughout the
Figure 12. The eect of contact resistance (high
interface resistance) and gas gap on the temperature variation with time at a xed point in the center of the cylinder (point C in Figure 6) for Al-wt%11 Si alloy.
solidication period, utilizing the modeling eect of pressure on interface resistance;
ii) In low-pressure casting, heat transfer coecient increases as a power law function, when metalo-static pressure could penetrate through the mushy solid skin into the roughness of the mold wall; iii) The comparison between experimental results,
obtained from the data acquisition system and the simulation results, veries the validity of the model predictions. It is worth mentioning that consideration of the interface resistance eect reduces the solidication time by 40-50% and modies temperature distribution in the system dramatically.
ACKNOWLEDGMENT
The authors are grateful for the research support of the Department of Materials Science at Imperial College, London and of Sharif University, Amirkabir University and the Esfahan Steel Making Co. in Iran.
NOMENCLATURE
A interface area in Equation 6 a constant of Equation 30 b constant of Equation 30
[
C
] capacitance matrix in Equations 22 and 24C
initial alloy content
CL concentration of alloying element in
liquid
CP heat capacity
CS concentration of alloying element in
solid
DL diusion coecient in liquid d thickness of gas gap
e acronym element
[
F
] force vector in Equations 22 and 25fS solid fraction fL liquid fraction g gravity acceleration
Gr Grashof number
H
height of sprue lled by the Al alloy H
Pb height of sprue lled by the Pb H
e eective height in Figure 8 h heat transfer coecient hg heat transfer coecient of gap ht overall heat transfer coecient J Jacobian matrix in Equation 29
[
K
] stiness matrix in Equations 22 and 23Kn Knudsen number
k thermal conductivity k
distribution coecient
kA thermal conductivity coecient of
mold
kB thermal conductivity coecient of
solidied skin
kE equivalent distribution coecient kg thermal conductivity of gap kL thermal conductivity of liquid kM thermal conductivity of mushy zone
liquid
kS thermal conductivity of solid
L distance between cavity inlet and top
of mold cavity
L
half of mold cavity height N
ZTE 1
;N ZTE
2 shape functions of zero thickness
element
Ni;Nj shape functions of general elements
Nu Nusselt number
n normal vector of interface in
Equation 29
P pressure
Pr Prandtl number
Q rate of heat passed through gas layerd q sum of heat ux on 3D space
q
heat ux through the interface R growth rate of solid-liquid interface
Ra Rayleigh number Re Reynolds number
S
heat source term f
T
g temperature vector fT
g temperature rate vector T temperature
T
ambient temperature
Tic cast temperature at interface Tis mold temperature at interface TL liquidus temperature
Tm melting point Tme melt temperature Tmo mold temperature TS solidus temperature
Tsk solid skin temperature at interface X thermal resistance coecient in
Equations 6 to 19
Greek Alphabet
2 boundary with Neumann condition 3 metal-mold boundary
Hm latent heat of solidication
t time step
x;y elements dimensions
domain
1 domain between 2and 3
2 domain between 1and 3 thermal diusivity
thermal expansion
supersaturate layer at solid-liquid
interface
; local coordinate system FDM methods coecient mean free path in gap dynamic viscosity L density of liquid M density of mushy zone S density of solid kinematics viscosity
REFERENCES
1. Mukherjee, P.C.,Fundamentals of Metal Casting Tech-nology, Oxford & IBH publishing Co. India, Chap: 4 (1979).
2. Santos, C.A., Quaresma, J.M.V. and Garcia, A. \Determination of transient interfacial heat transfer coecients in chill mold castings", Journal of Alloys and Compounds,319, pp 174-186 (2001).
3. Li, K., Cheng, M. and Change, E. \Eect of pres-sure on the feeding behavior of A356 alloys in low-pressure casting", AFS Transaction, 01(26), pp
566-580, (2001).
4. Loulou, T. Artyukhin, E.A., and Bardon, J.P. \Esti-mation of thermal contact resistance during the rst stage on metal solidication process",Int. J. Heat and Mass Transfer,42, p 2119 (1999).
5. Isaac, J., Reddy, G.P. and Sharma, G.K. \Numeri-cal simulation of solidication of castings in metallic molds",AFS Transaction,93(14), pp 123-132 (1985).
6. Holman, J.P.,Heat Transfer, McGraw-Hill, New York, USA (1981).
7. Song, S., Yovanovich, M.M. and Goodman, F.O. \Thermal gap conductance of conforming surfaces in contact",Trans. ASME, J. Heat Transfer,115(3), pp
533-540 (1993).
8. Sharma, G.K. and Krishnan, M. \A model of the interfacial heat-transfer coecient during solidication of an aluminum alloy", AFS Transaction, 91, p 429
(1983).
9. Siqueira, C.A. Cheung, C. and Garcia, N. \The columnar to equiaxed transition during solidication of Pb-Sn alloy",J. of Alloys and Compounds,2(351),
pp 126-134 (2003).
10. Narayan Prabhu, K. and Ravishankar, B.N. \Eect of modication melt treatment on casting/chill interfacial heat transfer and electrical conductivity of Al-13%Si alloy", Materials Science and Engineering, A360, pp
293-298, (2003).
11. Stasa, F.L.,Applied Finite Element Analysis for Engi-neering, CBS publication Japan Ltd. (1985).
12. Shrinparvar, M. \Simulation of heat transfers in metal-mold interface", M.S thesis, Sharif University of Tech-nology, Tehran, Iran (2004).
13. Samonds M., Lewis, R.W. and Morgan K., Computa-tional Techniques in Heat Transfer, Pineridge Press, Swansea, U.K. (1985).
14. Tadayon, M.R. and Lewis, R.W. \A model of metal-mold interfacial heat transfer for nite element simu-lation of gravity die castings", Cast Metals, 1(1), pp