Research Note
Design of an Automatic Alignment
System for Video Displays Using
an Adaptive Alignment Algorithm
A. Peiravi
and S. Toosizadeh
1One of the critical stages in a display production line is the image alignment of displays that includes the precise adjustment of the geometric parameters and the color of the image. The mutual inuences of the parameters of the display's image necessitate a complex and interactive alignment process. In this paper, the eect of the mutual inuences of geometric parameters on the alignment process of a display's image are shown, a suitable model for the geometric characteristics of a display's image are suggested and, then, the unknown parameters of the proposed model are estimated by the RLS estimator. Using an o-line estimator, an initial measure of the values of the unknown parameters of the display model is obtained. To modify the model parameters of the consecutive video displays on the production line, an on-line estimator is applied. Variations of the parameters of the display model on a production line are traced using on-line estimation. This model estimation is used to implement an adaptive alignment algorithm. Both the adaptive and the proportional alignment processes have been experimentally implemented under similar working conditions. Experimental results show that the use of the adaptive alignment process considerably increases the speed and reliability of convergence of geometric parameters to their desired values. An IA-32, 3.4 GHz Pentium P4 processor has been used in this research. Considering the rapid developments in UDSM technology and the IA-64 architecture, the application of the proposed adaptive alignment algorithm in an auto-alignment system has the potential for real-time implementation in the near future.
INTRODUCTION
One of the nal steps in the process of manufacturing video displays is the alignment stage. In the alignment stage, a video image is adjusted, so that distortion characteristics are reduced and the video image that is displayed on the video display forms an image that is pleasing to the eye. At rst glance, the adjustment of video display characteristics by human operators seems to be an easy task. However, it is, actually, very tedious, since the task must be performed continuously over time and constantly looking at a CRT screen from a short distance is tiresome and harmful to *. Corresponding Author, Department of Electrical Engi-neering, School of EngiEngi-neering, Ferdowsi University of Mashhad, P.O. Box: 91775-1111, Mashhad, I.R. Iran. 1. Department of Electrical Engineering, School of
Engi-neering, Ferdowsi University of Mashhad, P.O. Box: 91775-1111, Mashhad, I.R. Iran.
the human eye. Moreover, operator measures cannot accurately adjust all the display picture parameters. Such manual adjustments are very much based on operator experience and judgment. Therefore, it is dicult for a human operator to determine whether a video display meets a given set of desired specications or not. Auto-alignment is the automation of this calibration procedure, in order to increase the accuracy and uniformity of the adjustment to image parameters. Such automation can increase the factory throughput and the image quality of the output displays of a manufacturing factory.
The measurements of the image characteristics of a display for an automatic alignment process are taken using computer vision systems and digital image processing tools. Previous work carried out in an eort to simplify and automate the adjustment of the geometric characteristics of the display image, are as follows. 2D and 3D models of the CRT have been used in systems patented by Webb et al. for
transforming coordinate systems in an automated video monitor alignment system [1,2]. These systems need the CRT model and a high-precision assembly line conveyor system with low tolerance xturing. In another patented work, an inspection system that uses multiple high-resolution inspection cameras, in conjunction with a single stereoscopic reference cam-era, has been introduced by Fridge [3]. A more recent work on the ITC measurement of the CRT display has been proposed by Chuang et al. [4]. A method for adjusting image geometry in a video display monitor, using a human operator feedback through an input device, has been patented by Devine [5]. A complicated system, with multiple cameras and photodiodes for testing and aligning a CRT that can perform a series of required tests, has been patented by Buckley et al. [6,7]. In the latest patented work, Webb and Simpson have patented an apparatus and a method by which a host computer processor and the memory associated with the video graphics controller, dynamically adjust video images on the CRT screen, in order to reduce the cost of manufacturing CRT monitors without the limitation on dynamic alignment techniques [8,9].
The automatic adjustment of geometric parame-ters in all of the presented auto-alignment systems is slow because of the mutual inuences of display image attributes on each other. In this paper, the mutual inuences of the geometric characteristics of a display are modeled and the obtained display model is utilized, in order to implement an adaptive alignment method. Experimental results show that implementation of this adaptive model considerably increases the speed and reliability of the convergence of the geometrical parameters to their desired values.
DEFINITION OF ADJUSTMENT PARAMETERS
Adjustment parameters are dened as being the ac-cessible measures of the geometrical attributes of the display image. They can be used geometrically to adjust the display image. There must be a one-to-one correspondence between the dened adjustment parameters and the geometric parameters of the display image. To study the mutual inuences of the geomet-rical characteristics of a display image, the vertical size (v-size), i.e. a parameter for adjusting the vertical size of the image, the vertical slope (v-slope), i.e. a parameter for adjusting the slope of the saw-tooth signal of the image vertical scan, and the vertical s-correction (s-cor), i.e. a parameter for adjusting the vertical linearity of the image, are considered for example as three vertical geometric parameters of a video display. These parameters have mutual inuences on each other. A description of some of the
geometric parameters of digital TV displays has been presented by Suckle [10].
The experimental setup in this paper contains a color video camera with a resolution of 768576 and an IBM compatible PC with two display graphics cards; one used as a test pattern generator and the other as a user interface. Also, a video capture card with the maximum resolution of 768 576 has been installed in the PC as a frame grabber. All of the measurement and adjustment algorithms run on the PC and the adjustment signals are applied to the display through an infrared transmitter (IRT). Figure 1 shows an overview of the auto-alignment system.
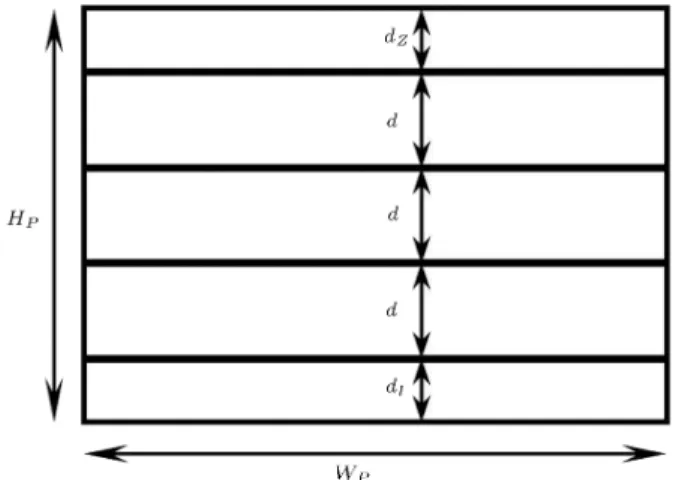
The adjustment parameters are visually mea-sured, based on the position of a generated test pattern on the display screen. In order to, simultaneously, measure the adjustment parameters corresponding to v-size, v-slope and s-cor, rst an appropriate test pattern is generated, like that shown in Figure 2 on the display screen.
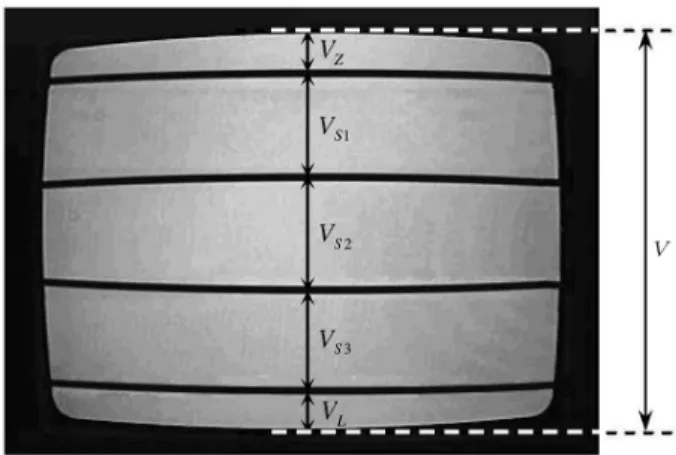
Then, a frame with a synchronized camera is captured from the display screen under test. Figure 3 shows the presented test pattern applied to a typical video display and important features are marked on it. Using image processing tools, such as edge follow-ing [11], sub-pixel edge detection [12] and the localiza-tion technique of fuzzy test patterns [13], the essential
Figure 1. An overview of the experimental setup.
Figure 2. A test pattern to simultaneously measure the adjustment parameters of v-size, v-slope and s-cor.
Figure 3. A typical video display screen displaying the proposed test pattern of Figure 1 and important feature. features are extracted from the captured images. The precisely measured positions of these features are used to compute the values of the adjustment parameters. RZ, RLand RS are the dened adjustment parameters
for v-size, v-slope and s-cor, respectively. These parameters are obtained by substituting the data from the extracted features in Equations 1 to 3.
RZ = 100 VVZ; (1)
RL= 100 VVL; (2)
RS =
VS1+ VS3
2
VS2: (3)
DISPLAY PLANT INPUTS AND OUTPUTS FOR ALIGNMENT
To study a plant, one must rst dene its inputs and outputs. The adjustment signals that are used for modifying the geometrical attributes are considered to be the input signals and the dened adjustment parameters to be the output signals of the display plant. In this paper, the target inputs, u1, u2 and
u3, are the adjustment signals for v-size, v-slope and
s-cor, respectively, that are applied in a dierential mode to increase or decrease the current values of the geometrical characteristics; the outputs are the adjustment parameters, x1 = RZ, x2 = RL and
x3 = RS. This denition is applied to examine the
proportional and adaptive alignment methods used in the same experimental setup and under the same initial conditions.
PROPORTIONAL ALIGNMENT METHOD In the proportional method that has been used by almost all of the presented auto-alignment systems,
adjustment signals are created in proportion to the corresponding errors between actual adjustment pa-rameters and their desired values [14,15]. In a similar fashion, independent loop gains are established to drive each of the adjustment parameters towards their desired values. The adjustment signal, ui, can be
determined by:
ui= pi(xdi xi); i = 1; 2; 3; (4)
where xi is the measured adjustment parameter, xdi is
the desired value and pi is the loop gain. The exact
loop gain for each adjustment parameter is related to its corresponding structure. The loop gain value is frequently determined by trial and error and must be selected large enough to minimize the adjustment error. On the other hand, an upper limit must be set on the loop gain value to guarantee system stability.
Due to the mutual inuences of image parameters on each other, any adjustment of a geometric parame-ter would aect all other geometric parameparame-ters. There-fore, the adjusted geometric parameter, xi, would be
misaligned, due to the alignment of the other geometric parameters, xj(i 6= j). These mutual inuences of
geometrical parameters cause a lag in the convergence of the adjustment parameters to their desired values in the proportional alignment method.
To have a measure of the mutual inuences of the geometrical attributes of a display image, the mutual inuence factor, mij, is dened as the ratio of
the variation of the adjustment parameter, xi, to the
variation of the adjustment parameter, xj, due to the
input signal, uj:
mij =xxi(t) j(t) =
xi(t + 1) xi(t)
xj(t + 1) xj(t);
for uk(t)
(
= 0 k 6= j
6= 0 k = j (5)
where (t + 1) shows the time step after applying uj(t)
and (t) shows the time step before applying uj(t), as
in a discrete time system. The proportional alignment process must be applied several consecutive times until all adjustment parameters converge to the correspond-ing desired values. Based on the stability rule of loop gain in the digital control theory, this convergence is guaranteed by assuming that the absolute value of the product of mijand mjiis less than one (jmijmjij < 1
for 8i 6= j). For example, the mutual inuence factors of three adjustment parameters, which were dened in the previous sections for a video display, have been shown in the mutual inuence matrix, M:
M = 2
4mm1121 mm1222 mm1323 m31 m32 m33
3 5=
2
4 1:11 0:154 0:3331 0:327 0:004 0:063 1
3 5:
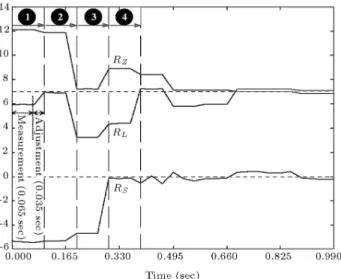
The elements of matrix M conform to the above convergence condition. Figure 4 shows consecutive alignment stages to converge the three adjustment parameters, RZ, RL and RS, of the aforementioned
video display from the initial values of 12, 6 and -5.5 to the desired values of 7, 7 and 0, respectively.
The rst alignment step in Figure 4 belongs to parameter RL. Parameter RZis adjusted at the second
step and the mutual eect causes the misalignment of RL, as shown. In the third alignment step, the
adjustment of parameter RS forces misalignments in
both RZ and RL. Therefore, a fourth step is required,
during which parameter RL must be adjusted again.
This alignment process is continued until the perfect convergence of RZ, RL and RS to their desired values.
The alignment stages in Figure 4 obviously show the mutual inuences of the geometric attributes of a display image on each other. In the proportional align-ment method, the number of alignalign-ment stages depends on the degree of mutual inuences of the geometrical attributes upon each other. If the absolute values of the product of mutual inuence factors are near 1, the convergence speed of the adjustment parameters decreases. If there exist two mutual inuence factors, mij and mji, such that jmij mjij > 1, the alignment
process is unstable and the adjustment parameters do not converge to their desired values.
ADAPTIVE ALIGNMENT METHOD
The mutual inuences of the geometric attributes of a video display on each other can be taken into consider-ation in the alignment rule, in order to generate proper adjustment signals. The generation of adjustment sig-nals, based on a model including the mutual inuences of the geometric parameters, is very ecient and speeds
Figure 4. Alignment stages of adjustment parameters RZ, RLand RSin the proportional method.
up the convergence of the adjustment parameters to their desired values.
In the following section, the structure of the model, between the input adjustment signals and the image geometrical features of a video display, will be studied. Then, to align the video display image, the adjustment signals will be generated, based on the obtained adaptive model. Examples of industrial adaptive systems and true industrial applications of adaptive control have been collected by Astrom and Wittenmark [16].
Structure of the Plant Model
Similar to the proportional alignment method, three geometrical parameters of vertical size (v-size), vertical slope (v-slope) and s-correction (s-cor) of a video display will be considered. The structure of a model is suggested for the three considered geometrical features and the corresponding inputs as a MIMO system in the following:
X(t + 1) = AX(t) + BU(t) + V (t); (6) where:
XT(t) =x
1(t) x2(t) x3(t)
=RZ(t) RL(t) RS(t); (7)
UT(t) =u
1(t) u2(t) u3(t); (8)
VT(t) =e
1(t) e2(t) e3(t); (9)
X(t) is the vector of the adjustment parameters that were dened in the previous section and U(t) is the vector of input adjustment signals u1, u2and u3, which
are the adjustment signals for v-size, v-slope and s-cor, respectively. V (t) is the vector of visual measurement errors and uncertainties, due to the following:
The displacement of the relative pose between the camera and the object under test,
The quantization error in image digitization, Improper illumination,
CCD noise,
A/D converter or video capture noise (that is more sensible in analog frame grabbers) [17],
The distortion of the camera lens [18],
Ambient light noise (that is a Poisson process). The applied visual measurement method to local-ize the geometrical features on the video display image determines the statistical characteristics of ei(t). Based
is one of the most accurate techniques to localize geometric features, fei(t); t = 1; 2; 3; g for i =
1; 2; 3, is a sequence of independent, equally distributed random variables with the mean value of m=0 and the variance of 2= 0:0016.
Recursive Least-Squares Estimation for Matrices A and B
After determining the structure of the model by Equa-tion 6, the RLS method [19] is used to estimate the elements of matrices A and B. The ith adjustment parameter at the time step (t + 1) only depends on the same adjustment parameter at time step (t) and is independent of other adjustment parameters. Therefore, the matrix A is considered to be diagonal.
2
4xx12(t + 1)(t + 1) x3(t + 1)
3 5 =
2
4a0 a1 02 00 0 0 a3
3 5
2 4xx12(t)(t)
x3(t)
3 5
+ 2
4bb1121 bb1222 bb1323 b31 b32 b33
3 5 2 4uu12(t)(t)
u3(t)
3 5
+ 2 4ee12(t)(t)
e3(t)
3
5 : (10)
The followings are set: Unknown vector: ^T
i(t) =
^aii(t) ^bi1(t) ^bi2(t) ^bi3(t)
; (11)
Regression vector: 'T
i (t) =
xi(t) u1(t) u2(t) u3(t): (12)
Recursive equations of least-square estimation are: ^i(t) = ^i(t 1) + Ki(t)"i(t); (13)
"i(t) = xi(t) 'Ti (t 1)^i(t 1); (14)
Ki(t) = Pi(t 1)'i(t 1)
i
+ 'T
i (t 1)Pi(t 1)'i(t 1)
1
; (15)
Pi(t) = I Ki(t)'Ti (t 1)
Pi(t 1)=i; (16)
where:
0 < i 1; i = f1; 2; 3g:
O-Line Estimation
The elements of matrices A and B o-line are estimated to have an initial measure of the display plant model. So, random inputs u1, u2 and u3 are applied and the
adjustment parameters, x1, x2 and x3 are visually
measured as outputs of the display plant. The obtained values of u1, u2, u3, x1, x2 and x3 can be
substi-tuted in the regression variables vector and recursive Equations 13 to 16 to estimate ^i for i = 1; 2; 3.
The recursive estimation process is repeated until the convergence of the elements of the unknown parameters vector, ^i.
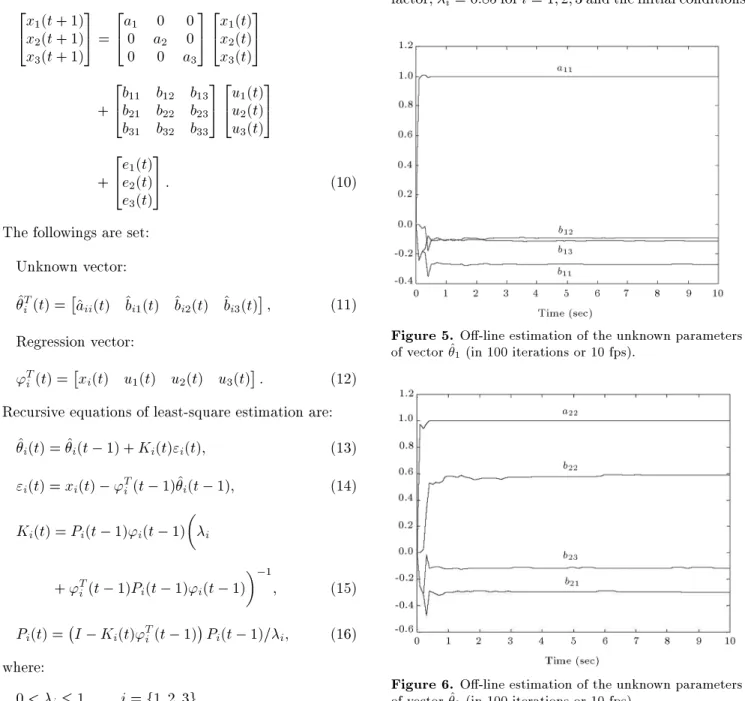
Figures 5, 6 and 7 show the estimation conver-gence of the unknown parameters of vectors ^1, ^2 and
^3, respectively, for a video display with the forgetting
factor, i= 0:85 for i = 1; 2; 3 and the initial conditions
Figure 5. O-line estimation of the unknown parameters of vector ^1(in 100 iterations or 10 fps).
Figure 6. O-line estimation of the unknown parameters of vector ^2(in 100 iterations or 10 fps).
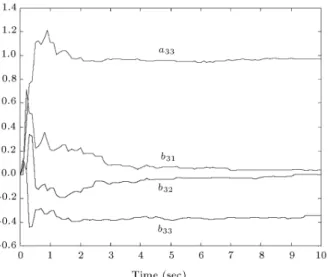
Figure 7. O-line estimation of the unknown parameters of vector ^3 (in 100 iterations or 10 fps).
as follows:
^i(0) =0 0 0 0;
Pi(0) =
2 6 6 4
25 0 0 0
0 25 0 0
0 0 25 0
0 0 0 25
3 7 7
5 = 25I4:
In an o-line estimation, the generation of random inputs would create persistently exciting signals, such that they could lead to the convergence of the unknown parameters to their true values as the number of observations increases towards innity [19]. This is called consistency. So, the obtained true elements of vectors ^1, ^2 and ^3 can be used to form matrices
^
A and ^B that are the estimates of the plant model matrices, A and B, respectively.
^ A =
2
41 00 1 00 0 0 0:97
3 5 ; ^
B = 2
4 0:2720:298 0:590:091 0:1140:112 0:001 0:037 0:342 3 5 :
Alignment Based on the Estimated Model Considering the structure of the plant model by the discrete time model (Equation 6) and estimating ma-trices A and B by mama-trices ^A and ^B, respectively, the estimated model of the plant is obtained by the following:
X(t + 1) = ^AX(t) + ^BU(t): (17)
Now, suppose the desired values of the adjustment pa-rameters are given by Xd. Then, to set the adjustment
parameters to their desired values, the adjustment signals are generated as follows:
X(t + 1) = Xd= ^AX(t) + ^BU(t) ) U(t)
= ^B 1X
d AX(t)^
: (18)
Figure 8 shows the block diagram of the presented auto-alignment system using the o-line estimation model.
To implement the proposed alignment system, rst, the adjustment parameters vector, X(t), are visu-ally measured from the display's screen and, then, the adjustment signals vector, U(t), are calculated using the o-line estimated matrices, ^A and ^B, and they are substituted in Equation 18. The computed adjustment signals are applied to the display plant. Then, the adjustment parameters are measured and compared with their desired values to obtain the adjustment error vector, E(t):
E(t) = Xd X(t + 1): (19)
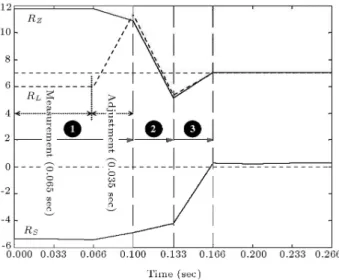
If the elements of the adjustment error vector fall within their corresponding tolerable range, the ad-justment must be stopped, otherwise, the adad-justment process must be repeated. Comparing with Figure 4, Figure 9 shows a considerable enhancement of the adjustment process for parameters RZ, RL and RS of
the video display using the o-line estimation model. In Figure 9, the adjustment process only contains three steps for aligning parameters RL, RZ and RS,
respectively. In the rst step, the adjustment of the parameter, RL, is carried out, based on the prediction
of the next adjustments of RZ and RS. The parameter
RL, therefore, does not directly go to its desired value
of 7, but goes where the next modications of param-eters RZ and RS would drive it to its desired value.
In the second adjustment step, a similar prediction is carried out in order to adjust the parameter RZ, based
on the next variations of RS. Finally, by adjusting
parameter RS, the other two parameters, RL and RZ
are also adjusted and, thus, the adjustment process is completed.
In addition to reducing the number of required steps in the alignment process, the proposed adjust-ment method causes a considerable reduction in the number of captured frames. In the proportional align-ment method, at least one measurealign-ment of the target adjustment parameter is needed at every alignment step and it is required to capture a new frame from the display image for every visual measurement. Therefore, in the proportional alignment method, the minimum number of necessary frames is equal to the number of alignment steps. However, in the adaptive alignment method, one frame is used for all visual measure-ments in an adjustment cycle. The adjustment cycle is a sequence of adjustments and only contains one adjustment for each misaligned target parameter (for
Figure 9. Stages of on-line alignment for parameters RZ,
RLand RSusing the o-line estimated model.
example, in the authors' proposed alignment processes, one cycle contains three consecutive adjustment steps corresponding to RL, RZ and RS). In the experiments
shown in Figures 4 and 9, the number of used frames in the proportional alignment method is ten, whereas only one frame is used in the adaptive alignment method.
A considerable improvement is obtained in the speed and reliability of the convergence of the adjust-ment parameters to their desired values by considering the mutual inuences of geometrical parameters in the plant model and by using the o-line estimation. On-Line Estimation
Variations of the dynamic and the static characteristics of CRTs and other display components on a video display production line introduce a time-variant plant and enter uncertainties in the plant model. Therefore, in order to enhance the plant model, the o-line estimated matrices, ^A and ^B, must be modied by new alignment information of consecutive displays on the production line. The RLS estimator can also be used for on-line modications of matrices ^A and ^B. During every alignment process, the data values of inputs and outputs of the display plant are substituted in recursive Equations 13 to 16 to modify the elements of matrices
^
A and ^B. Data from previous estimations are applied as initial conditions for the next RLS estimation.
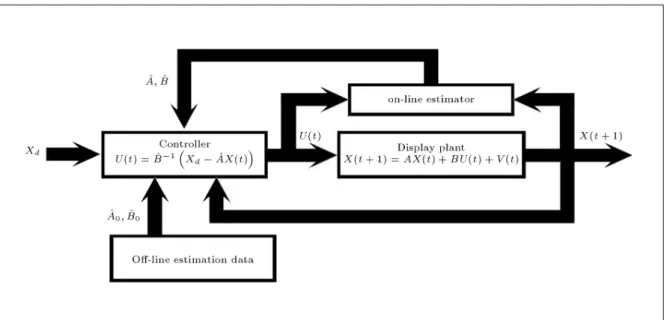
Figure 10 shows the block diagram of the pro-posed adaptive auto-alignment system with an on-line estimator, which has a structure like indirect self-tuning regulators [19,20].
Plant model parameters are statistically updated, based on the average variations of display plant char-acteristics by applying an on-line estimator. The ob-tained estimation data are used to generate adjustment signals, in order to optimally align the display image.
Substituting the generation rule of the adjustment signals (Equation 18) in the display plant model (Equa-tion 6), results in the following:
X(t + 1)=A B ^B 1A^X(t)+B ^B 1X
d+ V (t):
(20) It is obvious by Equation 20 that the stability of the presented auto-alignment system is guaranteed by the convergence of the estimated parameters to the correct values. Therefore, to ensure system stability, it is sucient that the structure of the model be correct and the process input be persistently exciting [19]. Random initial values of the adjustment parameters in a new alignment process cause the input adjustment signals to be persistently exciting. This ensures the stability of the adaptive auto-alignment system.
Figure 10. Block diagram of the authors' adaptive auto-alignment system using on-line estimator and o-line estimation data.
CONCLUSIONS
In this paper, a study was made of the mutual inuences of geometrical parameters of a display on each other and its eect on the alignment process of a display's image. This consideration can be useful in designing the adjustment algorithm of a display auto-alignment system. An adaptive auto-alignment method has been proposed for a video display image. To propose the adaptive method, the structure of the model of a display plant was typically introduced. Then, the plant model parameters were estimated o-line by an RLS estimator. The obtained display model is used to generate adjustment signals. Simultaneously, the on-line estimator updates the display plant model with variations of the display characteristics on the production line.
A comparison between the presented experimen-tal results of applying the proportional alignment method and the adaptive alignment method on some geometric attributes of a display image shows that the adaptive alignment algorithm eectively decreases the number of stages in the alignment process and the number of captured frames. Thus, it decreases the total alignment time and increases alignment reliabil-ity. For example, running both alignment algorithms compiled for Pentium processors and optimized for speed with a C++ Builder on the same platform with a 3.4 GHz Intel-Pentium 4 processor and under the same initial conditions, the convergence time of the proportional alignment method is 1 second and that of the adaptive alignment method with on-line estimation is 0.23 seconds. Although no true real-time auto-alignment systems for video displays exist,
with the rapid developments in UDSM technology and the IA-64 architecture, the implementation of a display auto-alignment system with this adaptive alignment algorithm has the potential for real-time realization. A video display auto-alignment system, equipped with the adaptive alignment method, is being operated in the Sirjan Electric Company and the results conrm the authors' claim.
REFERENCES
1. Webb, J.R., Simpson, R.C. and Pogoda, H.M. \Au-tomatic precision video monitor alignment system", US Patent No. 5,216,504, Display Laboratories, Inc. (1993).
2. Webb, J.R. and Kern, G.A. \Method and apparatus for transforming coordinate systems in an automated video monitor alignment system", US Patent No. 5,510,833, Display Laboratories, Inc. (1996).
3. Fridge, D.A. \Stereoscopic electro-optical system for automated inspection and/or alignment of imaging devices on a production assembly line", US Patent No. 5,638,461, Kollmorgen Instrument Corporation (1997).
4. Chuang, C., Hong, R. and Tsai, J. \Novel method for CRT display ITC measurement", Asia SID Technology Conference, pp 239-243 (1999).
5. Devine, J. \Method for adjusting image geometry in a video display monitor", US Patent No. 5,966,124, Apple Computer, Inc. (1999).
6. Buckley, E., Bukal, B., Dawe, W., Farrer, P., Nemeth, K.G. and Noonan, A. \Test and alignment system for electronic display devices and test xture for same", US Patent No. 5,969,756, Image Processing System, Inc. (1999).
7. Buckley, E.S., Lee, B.W.C., Bukal, B., Dawe, W.G., Noonan, A.G. and Richardson, T.R. \Test and align-ment system for electronic display devices", US Patent No. 6,252,626, Image Processing System, Inc. (2001). 8. Webb, J.R. and Simpson, R.C. \Alignment of cathode ray tube video displays using a host computer proces-sor", US Patent no. 6,285,397, Display Laboratories, Inc. (2001).
9. Webb, J.R. and Simpson, R.C. \Alignment of cathode ray tube displays using a video graphics controller", US Patent no. 6,437,829, Display Laboratories, Inc. (2002).
10. Suckle, L.I. \Automatic alignment techniques for color television manufacturing", IEEE Transactions on Consumer Electronics, 34(4), pp 886-893 (1988). 11. Parker, J.R., Algorithms for Image Processing and
Computer Vision, John Wiley and Sons (1997). 12. Meade, P. and Webb, J.R. \Application of
sub-pixel edge detection to generate ash correction waveforms", SID Technology Conference, ISSN0098-0966X/98/2901 (1998).
13. Toosizadeh, S. and Peiravi, A. \Novel fuzzy test patterns and their application in the measurement of geometric characteristics of displays", Springer, Machine Vision and Applications, 16(5), pp 273-281 (2005).
14. Sznaier, M. and Camps, O.I. \Control issues in active vision: Open problems and some answers", Proceedings of the 37th IEEE Conference on Decision and Control, Tampa, Florida, USA, pp 3238-3243 (1998).
15. Chroust, S., Vincze, M., Traxl, R. and Krautgartner, P. \Evaluation of processing architecture and control law on the performance of vision-based control sys-tems", Proceedings of IEEE/AMC, Nagoya, Japan, pp 19-24 (2000).
16. Astrom, K.J. and Wittenmark, B. \A survey of adaptive control applications", Proceedings of the 34th IEEE Conference on Decision and Control, 1, pp 649-654 (1995).
17. Steger, C. \Evaluation of subpixel line and edge detec-tion precision and accuracy", Internadetec-tional Archive of Photogrammetry and Remote Sensing, XXXII, Part 3/1, pp 256-264 (1998).
18. Motai, Y. and Kosaka, A. \Smart view: Hand-eye robotic calibration for active viewpoint generation and object grasping", Proceedings of IEEE International Conference on Robotics and Automation, pp 2183-2190 (2001).
19. Astrom, K.J. and Wittenmark, B., Adaptive Control, Addison-Wesley (1995).
20. Slotine, J.-J.E. and Li, W., Applied Nonlinear Control, Prentice-Hall (1991).