Sharif University of Technology
Scientia IranicaTransactions A: Civil Engineering www.scientiairanica.com
A fuzzy network assignment model based on user
equilibrium condition
M. Miralinaghi
, Y. Shafahi and R. Shabanpour Anbarani
Department of Civil Engineering, Sharif University of Technology, Tehran, P.O. Box 11155-9313, Iran. Received 21 June 2014; received in revised form 22 June 2015; accepted 11 May 2015
KEYWORDS Trac assignment; Perceived travel time; Probabilistic models; Defuzzication method;
Fuzzy equilibrium condition; Risk-acceptance.
Abstract. In this paper, a new trac assignment model is proposed based on fuzzy equilibrium condition where perceived travel times of users are assumed to follow fuzzy values. First, a new method is proposed to determine the membership function based on link congestion levels using probabilistic models. Then, a new index is presented based on percentage of users' risk-acceptance for comparison of fuzzy numbers. Using this index, two approaches, fuzzy Dijkestra shortest path algorithm and defuzzication method, are established for solving the shortest path problem. Fuzzy equilibrium condition is dened based on the two proposed fuzzy shortest path methods, and a trac assignment model is developed with consideration of fuzzy equivalency equilibrium condition. Frank-Wolfe algorithm and fuzzy shortest path method are combined to solve the proposed trac assignment problem. The assignment model is applied to a small and medium-sized network. Sensitivity analysis for link ows is performed under dierent levels of users' risk-acceptance to understand the route choice of dierent types of users. To apply the model to a large-scale network, the network of Mashhad, Iran is considered as a case study. The fuzzy trac assignment model provides more accurate estimation of volume compared to conventional trac assignment.
© 2015 Sharif University of Technology. All rights reserved.
1. Introduction
Trac assignment problem determines ow patterns in a transportation network, and is essential to many transportation network planning applications. Numer-ous eorts with dierent approaches have been made to estimate the ows in a network. All of them deal with two important assumptions. The rst one is about the nature of link travel time, and the second is about travelers' route choice behaviors. The Wardrop's principles are widely-used assumptions on travelers' route choice behaviors.
*. Corresponding author. Tel.: +1 (205) 8617849; Fax: +98 21 66014828
E-mail addresses: [email protected] (M. Miralinaghi); [email protected] (Y. Shafahi); [email protected] (R. Shabanpour Anbarani)
Wardrop [1] proposed two principles for link ow prediction, known as the User Equilibrium (UE) and the System Optimum (SO) for trac assignment problems. UE assumes that each user tries to minimize his or her own travel time from origin to destination. SO ow pattern minimizes total network travel time. The UE model is widely used in practice because it considers user behavior, is computationally convenient, and leads to a relatively reasonable approximation of link ows in the network over the long run. However, a number of studies have shown that the user equilibrium models are not able to represent real situations [2]. The UE model is based on some ideal assumptions which further models have tried to relax. For example, UE assumes that travelers have perfect information about travel times. However, travelers' perceived travel times are subject to multiple sources of variability. Stochastic User Equilibrium (SUE) is commonly used
to account for imperfect information. SUE considers the perceived travel times that follow a certain distribu-tion. However, it still assumes that travelers' perceived travel times have exact crisp values and thus travelers choose paths with perfect rationality. In an eort to relax this assumption and model the behavior of users more realistically, many researchers investigated the concept of bounded rational user equilibrium where travelers choose acceptable routes, whose travel times can be higher than the travel time of the shortest path up to a certain value. Based on this assumption, they developed a bounded rational user equilibrium model [3,4].
This study adopts fuzzy and probability theories to relax user equilibrium assumptions. The fuzzy theory can be considered as an alternative way to model the route choice decision-making process, since it is proposed to represent real-world human perception. The concept of fuzzy theory was proposed in 1965. Fuzzy logic is a very powerful tool for drawing denite conclusions from complex systems that generate vague, imprecise, or ambiguous information. This theory has been applied in dierent elds of transportation to capture more realistic behavior of travelers and improve the predicted results. For example, Foulds et al. [5] proposed the fuzzy approach to capture the imprecision in the link count to estimate the Origin-Demand (O-D) trac demands. EL-Rashidy and Grant-Muller [6] employed a fuzzy logic to measure the mobility of transportation network in terms of physical connectivity and level of service. Fuzzy logic is capable of accommodation of relative importance of each element under dierent trac conditions, i.e. free ow condition. The tasks of determining the path travel time and nding the shortest path are other examples of complex systems. In fuzzy trac assignment, perceived travel time of a specic route is dened as a set of values with specic possibilities.
Many eorts have been made to combine the notion of fuzzy logic with trac assignment. These studies can be categorized into two groups. The rst group maintains a fuzzy approach throughout the process. The work of Wang and Liao [7] is an example of the rst class of fuzzy models. In their work, they proposed a model with fuzzy travel cost and demand function and, consequently, their optimal solution was a fuzzy set. Zhang et al. [8] developed a hierarchical fuzzy rule base system to increase the accuracy in prediction of short-term trac congestion using a large number of input variables, i.e. vehicle speed measured by loop detector. They employed the genetic algorithm to optimize the system and maintain a high degree of accuracy. The second group, which is more common, has a defuzzication approach toward the assignment. Given a fuzzy set and its corresponding membership function, models with defuzzication approach attempt
to derive crisp numbers for the nal assignment result. Decreasing the computational burden is the main objective of defuzzication of fuzzy models. Wang and Liao [9] formulated a model with defuzzication approach. They considered the node-arc incidence matrix with fuzzy nodes due to arc uncertainties in membership of paths. In contrary to previous studies, they assumed travel cost and demand as crisp variables and functions. Chang and Chen [10] assumed that link travel times are fuzzy numbers. They proposed a fuzzy assignment model by applying the concept of -cut. In other words, they utilized the crisp assignment model based on travel times with certain possibility. Chen and Tzeng [11] emphasized that since travelers are not able to precisely determine the increase in link travel time due to link congestion, perceived link travel times should be fuzzy. They utilized the concepts of fuzzy measure and fuzzy integral to construct the perceived link costs and, subsequently, ows are determined by the diagonalization approach.
Liu et al. [12] proposed a fuzzy dynamic network assignment model based on linguistic descriptions. They modeled travelers' perception of travel time using linguistic descriptions, or in other words, discrete fuzzy sets with certain membership values. These models are called fuzzy rule-based models. In their study, fuzzy shortest path algorithm is implemented using defuzzi-cation. Ridwan [13] formulated a trac assignment model within fuzzy preference. Fuzzy preference is a method to compare the alternatives dierent from the traditional binary preference (YES/NO). He employed fuzzy concept to consider both rational travelers who always follow the shortest path and bounded rational travelers who would accept paths that are in a certain range (bound) of the shortest path. Ghatee and Hashemi [14] introduced a network assignment model with a fuzzy level of travel demand. They suggested a fuzzy model with binary variables to maximize the degree of certainty. By fuzzy comparison of possible paths and fuzzy subsets for travel time, Henn [15] derived a degree of attractiveness for each path. The risk attitudes of travelers are considered toward path travel time, and an assignment model that is similar to the Logit model is proposed based on fuzzy indices.
In a follow-up study, Henn [16] formulated a method for constructing the fuzzy set, based on a more detailed discussion on the reasons for adopting fuzzy concepts. He argued that travel time is a fuzzy set due to two reasons: travelers' imprecise perception and uncertain path travel times. Subsequently, a fuzzy trac assignment model that combines decision theory and probability measure is developed. Ramezani and Shafahi [17] suggested a fuzzy shortest path algorithm by modifying the Dijkestra algorithm and utilizing fuzzy indices. They considered both path travel time and degree of saturation for congested networks in their
algorithm. In the line of their research, Ramezani et al. [18] proposed fuzzy user equilibrium to determine the ows in a network by implementation of incremen-tal trac assignment.
In this study, fuzzy perceived travel times would be considered in trac assignment with defuzzication approach. A new method is proposed to construct fuzzy travel times based on congestion levels in a network. It allows us to calibrate the fuzzy travel time of dierent links based on a proposed distribu-tion of the random actual travel time. Triangular membership function is utilized herein to dene fuzzy numbers which model the perceived travel time. Fuzzy shortest path algorithm of Ramezani and Shafahi [17] is extended to include the risk-taking behavior in route decision making.
The rest of the paper is organized as follows. After dening the membership function for perceived travel time in Section 2, the ranking method of fuzzy numbers is explained in Section 3. Fuzzy assignment model and the concept of fuzzy user equilibrium condition are presented in Section 4. Section 5 denes the extension of fuzzy shortest path problem, new defuzzication method for simplifying the algorithm, and reducing the arithmetic calculations. In order to examine the eciency of model in Section 6, the fuzzy assignment model is applied to three networks with dierent sizes. Section 7 concludes the paper.
2. Fuzzy perceived link travel time
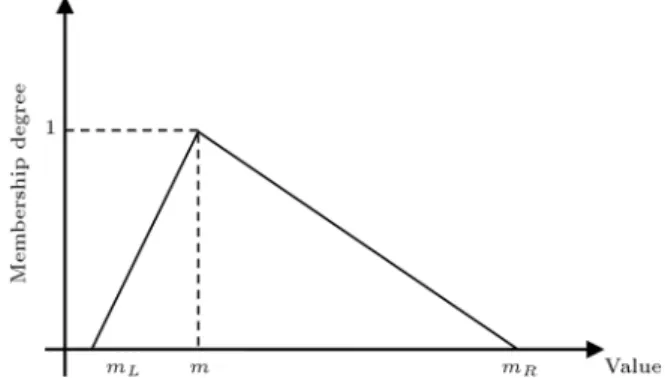
In the rst step of fuzzy network assignment, the membership function should be dened as a tool for modeling uncertainty in travel time with fuzzy concept. Flat L-R type fuzzy number is one of the simplest forms for representation of Fuzzy Perceived Link Travel Time (FPLTT) which was rst proposed by Dubois and Prade [19]. Since our major interest is trac assignment rather than individual's route choice, the membership functions of individual traveler have to be simple enough so that the aggregation of individual choices in a macroscopic assignment is possible [12]. Triangular fuzzy numbers are used as a special case of the L-R fuzzy numbers in this study. Triangular membership function of a fuzzy number, ~m, can be written as:
m~(x) =
8 > > > < > > > :
mL m xL if x < m
1 if x = m
mR m xR if x > m
(1)
where L > 0 and R > 0 are the left and right spreads of ~m. Figure 1 shows the shape of a triangular membership function and its parameters. It should be noted that L R fuzzy number can be denoted
Figure 1. Shape of triangular membership function and its parameters.
Figure 2. Range of perceived travel time with respect to real travel time.
by (mL; m; mR). Left bound, center and right bound
of fuzzy number ~m are denoted by mL; m, and mR,
respectively. The fuzzy sets of perceived link travel times should be dened to reect travelers' perception of link travel time. Left and right bounds of fuzzy perceived travel time are the minimum and maximum perceptions of the users in respect to their travel time. With the consideration of a variety of users, left and right bounds of fuzzy travel time are derived by using stochastic distributions. The schematic gure of parameters of FPLTT is presented in Figure 2. The aggregate value of central value has the highest prob-ability to perceive by travelers where this probprob-ability reduces by decreasing/increasing the value of perceived travel time. In this paper, travel times are considered as fuzzy numbers and their boundaries depend on real travel time and vary for dierent users.
2.1. Weibull distribution for establishing boundaries of membership function
In the absence of necessary information like perceived travel time in dierent types of links for dierent trav-elers, Weibull distribution is used as a rough model for following the perception of users [20]. This distribution has some distinct characteristics. First, it has simple closed form of distribution function. Second, it can be calibrated such that it includes only positive numbers
which results in exibility due to dierent values of shape parameter. Let's refer to x as the perceived value of travel time. The cumulative distribution function of random variable x, which has a Weibull distribution, is given by:
F (x) = 8 < :
1 exp x
k x > v
0 otherwise (2)
where v is the location parameter, is the scale parameter, and k is the shape parameter. To model FPLTT, it is assumed that v is equal to zero.
If we want to model the FPLTT of P percent of users, the lower bound can be given by:
1 exp xk
=1 p2 ! xl=
ln 2
1 + p 1
k
: (3)
Considering the equation of the mode of Weibull's distribution, we have:
= k 1 k 1 k : (4)
The lower bound of the fuzzy number can be written as:
xl=
0 @ln 2 1+p k 1 k
1 A
1 k
xl= :l: (5)
Similarly, the upper bound is: xR=
0 @ln 2 1 p k 1 k
1 A
1 k
xR= :R; (6)
where is mode value of distribution and l; Rare the
left and right coecients of the fuzzy number. In this study, mode would be used as a center value of fuzzy set and computed from the performance function. 2.2. Analysis of membership function
parameters
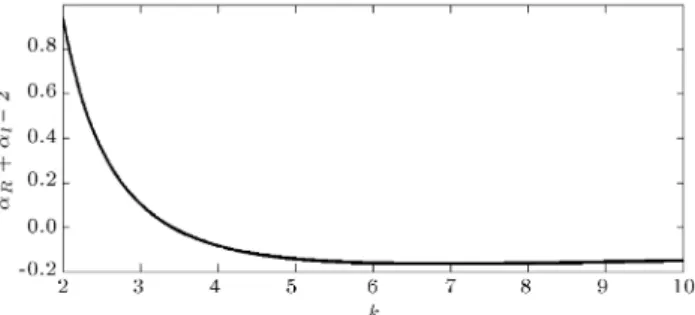
In order to make the proposed model more realistic, parameters of the distribution function should be ana-lyzed. At rst, skewness of FPLTT as one of criteria of its shape is examined. Figure 3 presents the shape of the dierence between right and left spreads versus k when P is set to 95%. The curve's equation is as follows:
R L = 3:69 k 1 k
1 k
+
0:025 k 1 k
1 k
2 !
:
R+ l 2: (7)
As can be seen in the Figure 3, FPLTT is a right
Figure 3. Relation between dierence of right and left spreads and shape parameter k.
skewed fuzzy set as it has a wider right spread than left spread when the value of k is between 1 and 3.41. This assumption is valid in the roads with prevailing recurrent trac congestion in which travelers expect to face a longer time (compared to actual commuter experience) [7]. When k equals 3.41, it has the same right and left spreads and it is applicable to links with few opportunities of congestion occurrence. When the value of k is more than 3.41, it is a left skewed set and it is appropriate for road segments where trac congestion hardly appears [7].
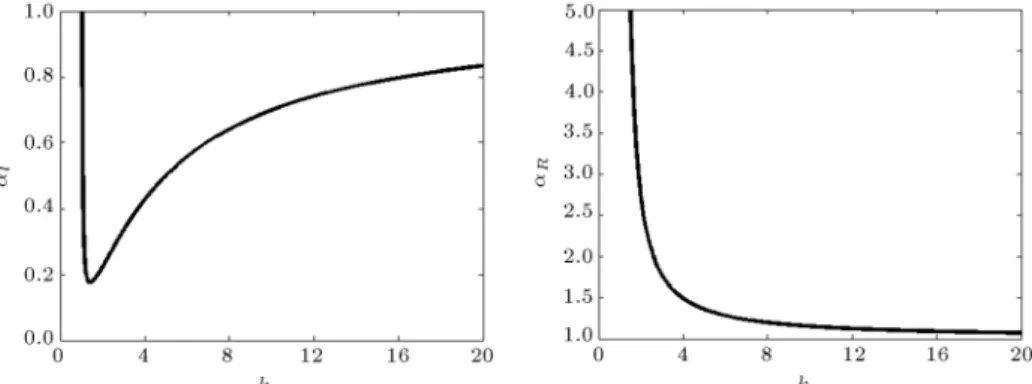
After determination and analysis of skewness, coecients Rand lare examined. Figure 4 presents
the behavior of R and l under dierent values of
k, respectively. It can be seen that as k approaches innity, l and R approach one. This presents the
decrease in the left and right spread of FPLTT. In other words, less uncertainty is presented in the users' perceived travel time. Clearly, l and R should take
values less and more than one, respectively. In this study, it is supposed that R is less than two. This
indicates that the right bound of FPLTT is less than two times of the mode of travel time distribution. Results can be summarized as follows:
= 8 < :
0 < k< 1 ! k > 1:03
1 < R< 2 ! k > 2:6
(8) Combining conditions in Eq. (8), value greater than 2.6 should be selected for k. Finally, Criteria (1) is suggested by taking advantage of V
c as a criterion for
trac congestion in links. For modeling the FPLTT in the absence of data:
Criteria (1) : 8 > > > > > > > > > > < > > > > > > > > > > :
For links with v c > 1
! 2:6 < k < 3:41 For links with 0:5 < v
c < 1
! 3:41 < k < 6:92 For links with v
c < 0:5
! 6:9 < k < 10
(9)
Figure 4. Behavior of left and right coecients under dierent values of k.
Eq. (9), the second rule is proposed because the curve has a steeper gradient between 3.41 and 6.92 in the Figure 3. This gives the idea to break the interval of [3.41,1) to two intervals. Using the observed volume from dierent networks, we can calibrate parameter k for dierent links. In the next section, a method is proposed to compare the fuzzy numbers.
3. Ranking fuzzy numbers
Ranking of fuzzy numbers is one of the most important steps in the fuzzy trac assignment. Dubois and Prade [19] introduced four indexes to describe the location of fuzzy numbers as below:
I1(M) = Poss(M N);
I2(M) = Poss(M < N);
I3(M) = Nec(M N);
I4(M) = Nec(M < N): (10)
In Eq. (10), Poss and Nec denote possibility and necessity indexes. Each of these indexes has its own advantages and drawbacks. Figure 5 illustrates the positions of these indexes. Remarking the drawback of these indexes, Ramezani et al. [18] proposed the using of I2for risk-seeking users and I3 for risk-averse
ones. The results are established under the assumption that users are pessimistic since they choose the route with less uncertainty in travel time. However, some of
the users are optimistic in their route choice decision making. In other words, they seek more risk than others in the route choice process. Obviously, the combination of possibility and necessity indexes leads to a more comprehensive index.
Let us assume that ~m = (ml; m; mR) and ~n =
(nl; n; nR) are two fuzzy numbers. Figure 5 illustrates
that I3 ( ~m; ~n) is the cross-point of ]~n; +1) and the
right side of the ~m. The membership degree of ]~n; +1) and the right side of the ~m are determined as follows [18]:
I3( ~m; ~n) = n R m
(mR+ nR) (m + n): (11)
Similarly, I2 ( ~m; ~n) is derived by:
I2( ~m; ~n) = n m l
(m + n) (ml+ nl): (12)
Combination of I2 and I3 in Eqs. (11) and (12) can be
expressed as:
I( ~m; ~n) = :I2( ~m; ~n) + :I3( ~m; ~n); (13)
where, and are the percent of proportional weights of optimistic and pessimistic users. The summation of and equals 1. The diculty caused by this com-bination is the equation's complexity. However, this complexity can be simplied under some assumptions, as it is explained in the next section. For comparison of the two fuzzy numbers( ~m; ~n), the combination index can be extended as:
I( ~m; ~n) =:(m + n) (mn mll+ nl)
+ : nR m
(mR+ nR) (m + n): (14)
Simply, it can be proven that according to this index, the two fuzzy numbers ~m and ~n are equal if and only if:
I( ~m; ~n) = I(~n; ~m) = 0:5: (15) And ~m is greater than ~n, if and only if:
I( ~m; ~n) < 0:5 < I(~n; ~m): (16) If we assume that the membership functions of path travel times are symmetric, by substituting Eq. (14) in Eq. (16), it can be concluded that ~m is greater than ~n if and only if:
I(~n; ~m) 0:5 0 ! DN( ~m)
= :ml+ m + :mR DN(~n)
= :nl+ n + :nR: (17)
DN( ~m) stands for the defuzzication number of fuzzy number ~m. This assumption is redundant if or are equal to one; in other words, it is not required if all users are optimistic or pessimistic.
4. Fuzzy user equilibrium model
In this section, the rule of route choice by each motorist is specied for determination of its formulation. In the crisp UE, equilibrium condition is reached only when no traveler can improve his travel time by unilaterally changing routes. This is the characterization of crisp user equilibrium condition [21]. However, the drawback in this denition is the assumption that each motorist has the perfect information about the routes and, hence they can exactly predict their travel times. Therefore, travel time should be replaced by fuzzy set. Because of the fuzziness of user's perception of routes travel times, possibility and necessity theory can be used for estimation of FPRTT's utility.
By assuming that FPLTTs are symmetric, the fuzzy equilibrium assignment program can be written as:
minX
a
Z x
0 :t l
a(w) + ta(w) + :tRa(w)
dw
X
a
Z x
a DN( ~ta(w))
dw; (18)
X fr;s
m = qrs; (19)
fr;s
m 0; (20)
xa=
X
r
X
s
X
m
fr;s
m :rsa;m; (21)
where tl
a(w), ta(w), and tRa(w) are the left, center, and
right bounds of fuzzy travel time-value function ~ta(w);
is the percent of optimistic users; is the percent of pessimistic users; and DN((~ta)(w)) is the defuzzied
number of travel time of link `a'.
Proposition 1. Fuzzy and conventional trac as-signments are identical if and only if fuzzy travel time is singleton.
Proof. To compare the crisp with fuzzy equilibrium conditions (18), let us assume that fuzzy travel time is singleton. In other words, the values of left, center and right bounds of fuzzy travel time are assumed to be equal. Then, the objective function (18) is reduced to:
X
a
Z xa
0 :t l
a(w) + ta(w) + :tRa(w)
dw = 2X
a
Z xa
0 (ta(w)) dw: (22)
Therefore, the proposed fuzzy equilibrium assignment program and crisp user equilibrium condition are iden-tical, if and only if fuzzy travel time is singleton.
Using the Lagrangian of the minimization prob-lem, it is simple to show that the rst order conditions for the model are identical to the below equilibrium condition, such that:
fr;s
m :tlmrs+ tmrs+ :tRmrs) (u0rs)
= 0; (23) :tl
mrs+ tmrs+ :tRmrs
(u0
rs) 0; (24)
X fr;s
m = qrs; (25)
fr;s
m 0: (26)
If ul
rs; urs, and uRrs are chosen such that \u0rs"
La-grangian multiplier satises the below condition: u0
rs= :ulrs+ urs+ :uRrs; (27)
u0
rscan be considered as defuzzicated number of fuzzy
set ~urs = (ulrs; urs; uRrs). Based on the assumption in
Section 3, these formulations can be expressed as: fr;s
m 0:5 Ir;s(~tmrs; ~urs)= 0 8m; r; s (28)
0:5 Ir;s ~t
mrs; ~urs 0 8r; s (29)
X fr;s
m = qrs 8m; r; s (30)
fr;s
where:
~urs : Fuzzy set with the most utility;
~tmrs : Fuzzy perceived travel time of each
route between `r' and `s';
qrs: Travel demand between `r' and `s';
Ir;s(~t
mrs; ~urs) :Utility (or comparison's index) of ~tmrs
with respect to ~urs.
Eq. (28) implies that travelers choose the route m if and only if it has combination index value of 0.5. Based on Eq. (29), ~urs is less than or equal to
any fuzzy perceived travel time of any path between origin \r" and destination \s". In other words, if ~tmrs = ~urs according to index Ir;s, ow on path `m'
can be positive. Thus, ~urs equals the minimum fuzzy
path travel time between origin \r" and destination \s" according to index Ir;s. In the special cases, and
should be replaced by one for totally pessimistic and optimistic users, respectively.
The Frank-Wolfe algorithm is modied to solve the model. To do so, it is required to replace the function of ta(w) with DN((~ta)(w)) in the traditional
Frank-Wolfe algorithm. The Bureau of Public Roads (BPR) equation for road travel time is used in this study. Since it is monotonically increasing convex function and depends only on the ows of links, there is unique global solution for the proposed model. Fuzzy equilibrium assignment program can be solved by using any convex combination methods such as the Frank-Wolfe algorithm. Two dierent approaches for solving fuzzy shortest path by using the Frank-Wolfe algorithm are developed in this study. The most important step in Frank-Wolfe algorithm is nding the shortest path between origins and destinations for nding improving direction in each iteration. This step will extensively be explained in the next section.
5. Fuzzy shortest path algorithm
Finding a path with minimum fuzzy travel time is an important issue in solution algorithm of any type of trac assignment model. Up to now, most of the methods fall into two categories of approaches toward this problem. In the rst approach, fuzzy shortest path is defuzzied into crisp ones like Blue et al. [22] and in second approach, it is solved by using fuzzy index in spite of crisp comparison like Ramezani et al. [18]. In this study, both approaches are employed. Furthermore, level of risk-acceptance is used to gain the set of fuzzy paths. Here, these two methods are briey explained.
5.1. Fuzzy Dijkestra shortest path algorithm Ramezani et al. [18] proposed a fuzzy Dijkestra shortest path algorithm to nd the best path based on fuzzy comparison of travel times. They used the index I3
to nd a fuzzy shortest path, assuming all users are pessimistic. With assumption of equal left and right coecients for fuzzy travel time of dierent paths, Dijkestra fuzzy algorithm can be used with employing the index I to compare dierent paths if and only if it holds the transitive property. In other words, if fuzzy travel time ~m is smaller than ~n and fuzzy travel time ~n is smaller than ~w, then fuzzy travel time ~m is smaller than ~w.
Proposition 2. Index I is transitive over triangular fuzzy numbers with equal left and right coecients. Proof. To prove that I is transitive, let's assume that fuzzy travel time ~m is smaller than fuzzy travel time ~n. From the denition:
I( ~m; ~n) < I(~n; ~m): (32) Using Eq. (14), it follows:
(m + n) (mm + mll+ nl)+ :(mR+ nmRR) (m + n)+ m
< : n + nl (m + n) (ml nl)
+ :(mR+nnRR) (m+n)+ n : (33) Left and right bounds of fuzzy numbers are derived using Eqs. (5) and (6) with assuming the same left coecient, l, and right coecient, R, for fuzzy
numbers ~m and ~n. Combining Eqs. (5), (6) and (33), we have:
:m(1 + (1 l)
l) + :
m(1 + R)
(1 R) < :
n(1 + l)
(1 l)
+ :n(1 + (1 R)
R) : (34)
Similarly, fuzzy travel time ~n is smaller than ~w, if and only if:
:n(1 + (1 l)
l) + :
n(1 + R)
(1 R) < :
w(1 + l)
(1 l)
+ :w(1 + (1 R)
R) : (35)
Consequently: :m(1 + (1 l)
l) + :
m(1 + R)
(1 R) < :
w(1 + l)
(1 l)
+ :w(1 + (1 R)
R) : (36)
I holds the transitive property. Index I provides the chance to nd a set of shortest paths based on dierent levels of risk-acceptance.
5.2. Defuzzication method
Applying a convex combination algorithm to solve the model requires a solution of a linear program and, it can be shown that this is achieved by assigning all motorists to the path connecting origin to their destinations with the shortest travel-defuzzied time. For this purpose, fuzzy travel times of network link, ~m = (ml; m; mR), is
defuzzied into a crisp number such as:
DN( ~m) = :ml+ m + :mR: (37)
These crisp numbers, in Eq. (37), are assigned to each link based on their FPLTTs. A conventional shortest path algorithm, such as regular Dijkestra, can be employed to nd a shortest path based on these crisp values. Defuzzication method is simpler than fuzzy Dijkestra shortest path to be implemented because it does not need the path enumeration
6. Numerical examples
Three dierent sized networks are represented to show how the fuzzy network assignment works. In Sec-tion 6.1, fuzzy network assignment is applied to a small network to show the implementation of the model and to prove that results of fuzzy model obtained in Section 4 can be the estimations of fuzzy user equilibrium. Fuzzy shortest path algorithm is applied to Sioux-Falls city test network in Section 6.2, to show the performance of this important part of assignment procedure. Finally, as a case study, link ows of a large network are calculated by using this model in order to show the performance of the model by comparing the result of the model with real data.
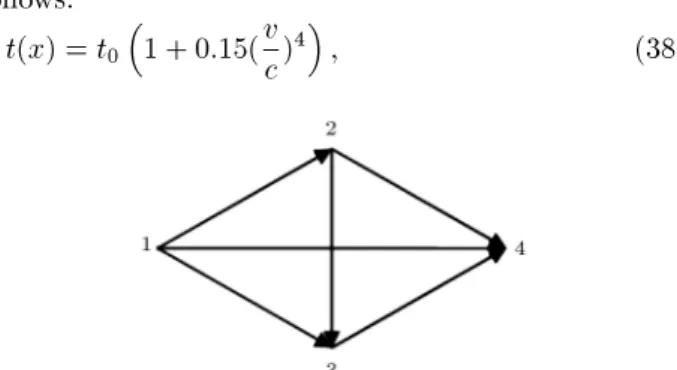
6.1. Example 1: Synthetic network
To investigate whether the solution of fuzzy trac assignment model satises the fuzzy user equilibrium condition, the proposed model is tested on the small network in Figure 6. This network consists of four nodes and six links.
BPR function is used for travel time function as follows:
t(x) = t0
1 + 0:15(vc)4; (38)
Figure 6. Synthetic network of Example 1.
Table 1. Characteristics of links. i j t0(i; j) c(i; j) V (i; j) V =c
1 2 4 200 312.66 1.56
1 3 5 150 233.89 1.56
1 4 17 300 153.51 0.51
2 3 7 250 0 0
2 4 7 250 312.6 1.25
3 4 7 250 233.89 0.94
where:
t0: Free ow travel time, and
c : Practical capacity of each link.
These two are the link parameters and \V " is the trac volume on it. Table 1 shows the values of link parameters, \t0" and \c", of the network as well as link
ows under the crisp user equilibrium circumstance and
V
c ratios. The travel times of links which are obtained
based on conventional user equilibrium condition are used as center of fuzzy travel time of each link. The user equilibrium ows, presented in Table 1, are used for determination of the condition of links, V
c. Based
on this index, it can be shown that:
1. In the path (1-2-4), recurrent trac congestion prevails and according to Criteria (1), k = 3 is used for this path;
2. In the path (1-3-4), trac congestion hardly ap-pears but, still, it occurs more in comparison with path (1-4). So, k = 6 and k = 15 are used for paths (1-3-4) and (1-4), respectively.
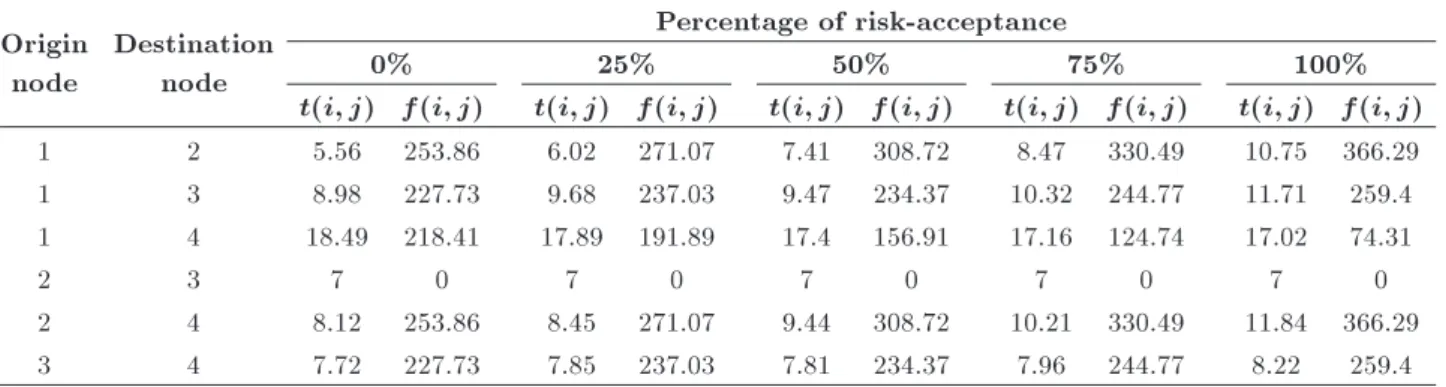
We check the sensitivity of the link ows ac-cording to the dierent levels of risk-acceptance by using model (18)-(21) for ve combinations of risk-acceptance scenario of users. The results are reported in Table 2. Figure 7 shows the ows on the three specied paths according to the dierent levels of risk-acceptance. As can be seen, more users choose the path (1-2-4) by increasing the level of risk-acceptance. This means that this path is more attractive for optimistic
Figure 7. Link ow values according to dierent levels of risk-acceptance.
Table 2. Variation of link ows according to dierent levels of risk-acceptance. Origin
node
Destination node
Percentage of risk-acceptance
0% 25% 50% 75% 100%
t(i; j) f(i; j) t(i; j) f(i; j) t(i; j) f(i; j) t(i; j) f(i; j) t(i; j) f(i; j)
1 2 5.56 253.86 6.02 271.07 7.41 308.72 8.47 330.49 10.75 366.29
1 3 8.98 227.73 9.68 237.03 9.47 234.37 10.32 244.77 11.71 259.4
1 4 18.49 218.41 17.89 191.89 17.4 156.91 17.16 124.74 17.02 74.31
2 3 7 0 7 0 7 0 7 0 7 0
2 4 8.12 253.86 8.45 271.07 9.44 308.72 10.21 330.49 11.84 366.29
3 4 7.72 227.73 7.85 237.03 7.81 234.37 7.96 244.77 8.22 259.4
Table 3. Fuzzy index values of dierent paths in 75% of risk-acceptance.
Path (1-2-4) Path (1-3-4) Path (1-4) Path (1-2-3-4)
Lower bound of fuzzy travel time 6.27 10.21 13.49 12.80
Center value of fuzzy travel time 18.68 18.28 17.15 23.43
Upper bound of fuzzy travel time 33.04 23.42 18.63 32.86
Value of fuzzy indexes in comparison to path (1-2-4) - 0.500 0.506 0.292
users. This can be related to the lower free ow travel time of link (1-2) in comparison to links (1-3) and (1-4) where optimistic traveler can experience a lower travel time in absence of congestion.
Table 3 represents the fuzzy travel time of four possible paths under the fuzzy equilibrium condition for 75% risk-acceptance scenario. It is clear that fuzzy travel time of used paths is equal to each other and less than used paths according to index I0. Values of fuzzy
indexes in comparison to path (1-2-4) denote that we can derive an approximate solution using model (18)-(21) instead of model (28)-(31) without relaxing index I0.
6.2. Example 2: Sioux-Falls network
The second test network used in this study is the Sioux-Falls city network, which is the most extensively used test network for the trac assignment in the literature. The Sioux-Falls network, as shown in Figure 8, has 24 nodes, 76 links, and 528 nonzero O/D pairs. This network is used to show the dierent paths chosen according to the risk-acceptance of users. First, conventional user equilibrium trac assignment model is solved in order to determine V
c due to lack
of observed link volumes and, consequently, \k" is calculated similar to the previous example. Results are presented in Table 4. Then fuzzy shortest path with indexes I2 and I3 is conducted.
Results prove that chosen paths between 40 non-zero O/D pairs are sensitive to risk-acceptance of users. For example, pessimistic users choose the path 6 ! 2 ! 1 ! 3 ! 4 ! 5, while optimistic users prefer the link 6 ! 5 to reach their destination. In detail, pessimistic users prefer fuzzy perceived travel
Figure 8. Network of Example 2: Sioux-Falls network.
time of rst path 0(0:24; 0:36; 0:43)0 to second one 0(0:12; 0:35; 0:62)0.
6.3. Case study: Mashhad city network
The objective of the case study is to demonstrate the eciency as well as accuracy of the fuzzy trac assignment model in estimating the better ows in real large networks. The network of Mashhad city in
Table 4. Example of dierent chosen paths according to dierent levels of risk-acceptance.
Type of users Link sets of path between O-D Type of users Link sets of path between O-D
O-D O-D
1 Pessimistic 22 ! 15 ! 10 ! 11 ! 4 ! 3 ! 1 Optimistic 22 ! 23 ! 24 ! 13 ! 12 ! 3 ! 1
22-1 22-1
2 Pessimistic 22 ! 15 ! 10 ! 11 ! 4 ! 3 ! 1 ! 2 Optimistic 22 ! 23 ! 24 ! 13 ! 12 ! 3 ! 1 ! 2
22-2 22-2
3 Pessimistic 22 ! 15 ! 10 ! 11 ! 4 ! 3 Optimistic 22 ! 23 ! 24 ! 13 ! 12 ! 3
22-3 22-3
4 Pessimistic 21 ! 20 ! 18 ! 7 ! 8 ! 9 ! 5 to4 Optimistic 21 ! 24 ! 13 ! 12 ! 3 ! 4
21-4 21-4
5 Pessimistic 22 ! 15 ! 10 ! 11 ! 4 Optimistic 22 ! 23 ! 24 ! 13 ! 12 ! 3 ! 4
22-4 22-4
6 Pessimistic 6 ! 2 ! 1 ! 3 ! 4 ! 5 Optimistic 6 ! 5
6-5 6-5
7 Pessimistic 13 ! 12 ! 3 ! 4 ! 5 ! 9 ! 8 ! 7 ! 18 ! 20 Optimistic 13 ! 24 ! 21 ! 20
13-20 13-20
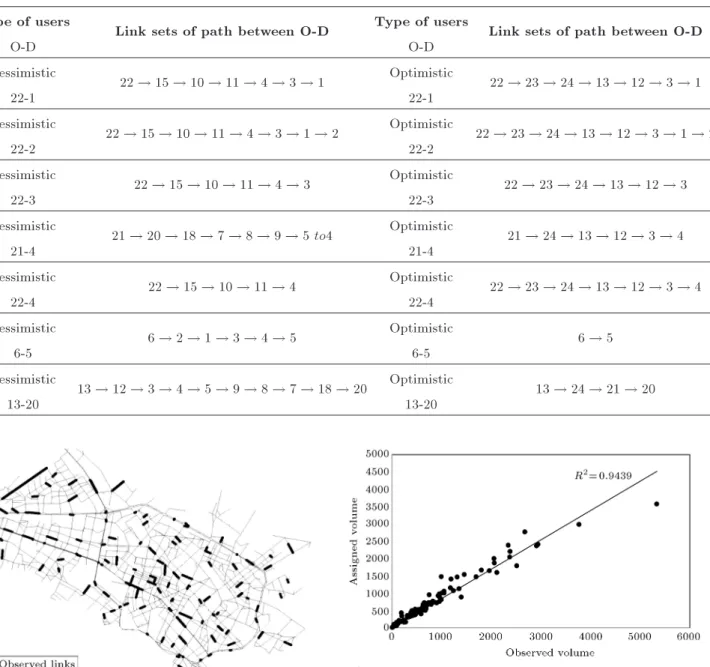
Figure 9. Mashhad city network and observed links.
Khorasan state, Iran, is considered as the case study. This network contains 935 nodes, 2538 links, and 7157 non-zero O/D pairs. The city is divided into 141 trac zones. A one-day origin-destination survey with house interviewing was conducted. Data were collected from 4% of the households and validated by observation from several screen lines in the study area. Trac volumes of 112 links were simultaneously counted with data collected in the same day. Figure 9 shows Mashhad city network and observed links, which are highlighted in the black.
Using the fuzzy trac assignment, the graph, depicted in Figure 10, compares the estimated volumes with observed volumes on the 112 links with observed
Figure 10. Relationship between observed and assigned volumes.
volumes. The x-axis of the graph corresponds to the observed volumes, whereas the y-axis corresponds to the estimated volumes. A linear trend-line, y = x, passes through the points and the R2 value is
included in Figure 10. The graph shows the high correlation between assigned and observed volume. The analysis shows that the users of the Mashhad network are mostly optimistic rather than pessimistic in their route choice behavior. If Mashhad users are assumed to be optimistic, 41% improvement can be achieved in relative error of assigned volume to observed ones in comparison to the conventional trac assignment.
All numerical examples are performed on a com-puter Intel core i5 CPU processor with 4 GB of RAM.
In Mashhad Network, computation of trac volumes in fuzzy trac assignment takes about 1 minute, while it takes approximately 0.9 minutes for conventional user equilibrium model. With consideration of calibration ability of fuzzy user equilibrium model, it is clear that there is no signicant dierence between these two models in terms of computational eciency. In terms of accuracy, the result of fuzzy assignment shows 41% improvement comparing to traditional user equilibrium.
7. Conclusion remarks
The paper has developed and demonstrated a fuzzy trac assignment model and its solution for modeling of fuzzy equilibrium condition. In the rst step, a new method based on stochastic distribution for construction of boundaries of fuzzy sets is presented. Then, a new index is formulated based on the possi-bility and necessity theory of Dubois and Prade [19]. Dierent levels of risk-acceptance of users are involved in choosing paths according to index \I, since it is an important factor in the fuzzy comparison. Two approaches are proposed in this study. The rst one is based on the fuzzy comparison by index I which is adopted into the fuzzy Dijkestra shortest path. The second approach is defuzzication of the rst approach with assuming the equality of left and right spreads of fuzzy perceived travel time.
The validity and robustness of the proposed model is tested with a hypothetical small network. Using this example, the eect of user's risk-acceptance level on link's ow pattern in the network is demonstrated. Next, a medium sized network, Sioux Falls, is tested under dierent scenarios using fuzzy equilibrium. Re-sults show that level of risk-acceptance is an important factor in determination O/D shortest path. Finally, a case study is considered to achieve the objective of developing a fuzzy trac assignment model. Accord-ingly, the fuzzy network assignment of Mashhad city, Iran, is solved. This network contains 935 nodes and 2538 links. The results of fuzzy network assignment are compared with observed ones. The signicant correla-tion of observed and assigned volumes and reduccorrela-tion of relative error of assigned volume in comparison to conventional trac assignment encourages one to use this fuzzy model.
This model has some potential future works. First, link-based assignment algorithm is applied with assumption of equality of left and right spreads, in this study, to solve the fuzzy user equilibrium condition. For relaxation of this assumption, a path based assign-ment algorithm should be adopted to obtain a solution for fuzzy trac assignment model. Dierent complex membership functions can be customized for modeling sets of fuzzy travel time and, nally, this problem can
be modeled as multiclass user equilibrium in future studies since there are both optimistic and pessimistic users in trac network.
Acknowledgment
We wish to thank Professor Yingyan Lou of the Arizona State University for us her valuable comments to an earlier draft of the paper. We also want to thank three anonymous referees for their insightful comments. References
1. Wardrop, J.G. \Some theoretical aspects of road trac research", Proceedings of the Institute of Civil Engi-neers, Part II, pp. 325-378 (1952).
2. Kitamura, R. and Nakayama, S., Can Travel Time Information Really Inuence Network Flow? Implica-tions of the Minority Game, Transportation Research Record, No. 2010, Transportation Research Board of the National Academics, Washington, D.C., pp. 12-18 (2007).
3. Lou, Y., Yin, Y. and Lawphongpanich, S. \Robust congestion pricing under boundedly rational user equi-librium", Transportation Research, Part B: Method-ological, 44(1), pp. 15-28 (2010).
4. Di, X., Liu, H.X., Pang, J.S. and Ban, X. \Boundedly rational user equilibria (BRUE): Mathematical for-mulation and solution sets", Transportation Research, Part B: Methodological, 57, pp. 300-313 (2013).
5. Foulds, L.R., do Nascimento, H.A., Calixto, I.C., Hall, B.R. and Longo, H. \A fuzzy set-based approach to origin-destination matrix estimation in urban trac networks with imprecise data", European Journal of Operational Research, 231(1), pp. 190-201 (2013).
6. EL-Rashidi, R.A. and Grant-Mulller, S.M. \An opera-tional indicator for network mobility using fuzzy logic", Expert Systems with Applications (2015) (In Press).
7. Wang, H.F. and Liao, H.L. \Application of variational inequality to user equilibrium problem in trac as-signment with fuzzy cost and demand functions", J. Chinese Fuzzy Systems Assoc., 2, pp. 39-47 (1996).
8. Zhang, X., Onieva, E., Perallos, A., Osaba, E. and Lee, V.C.S. \Hierarchical fuzzy rule-based system optimized with genetic algorithms for short term trac congestion prediction", Transportation Research, Part C, 43, pp. 127-142 (2014).
9. Wang, H. and Liao, H. \User equilibrium in trac assignment problem with fuzzy N-A incidence matrix", Fuzzy Sets and Systems, 107(3), pp. 245-253 (1999).
10. Chang, M. and Chen, H. \A fuzzy user-optimal route choice problem using a link-based fuzzy variational in-equality formulation", Fuzzy Sets and Systems, 114(2), pp. 339-345 (2000).
11. Chen, Y. and Tzeng, G. \Using fuzzy integral for eval-uating subjectively perceived travel costs in a trac assignment model", European Journal of Operation Research, 13, pp. 653-664 (2001).
12. Liu, H.X., Ban, X., Ran, B. and Mirchandani, P. \For-mulation and solution algorithm for fuzzy dynamic trac assignment model", Transportation Research Record, No. 1854, Transportation Research Board ofthe National Academics, Washington, D.C., pp. 114-123 (2003).
13. Ridwan, M. \Fuzzy preference based trac assignment problem", Transportation Research, Part C: Emerging Technologies, 12(3-4), pp. 209-233 (2004).
14. Ghatee, M. and Mehdi Hashemi, S. \Trac assignment model with fuzzy level of travel demand: An ecient algorithm based on quasi-Logit formulas", European Journal of Operation Research, 194(2), pp. 432-451 (2009).
15. Henn, V. \Fuzzy route choice model for trac assign-ment", Fuzzy Sets and Systems, 116(1), pp. 77-101 (2000).
16. Henn, V. \What is the meaning of fuzzy costs in fuzzy trac assignment models?", Transportation Research Part C: Emerging Technologies, 13(2), pp. 107-119 (2005).
17. Ramezani, H. and Shafahi, Y. \Application of fuzzy theory for trac assignment", 18th IASTED Int. Conf. on Modeling and Simulation, Montreal, Quebec, Canada (2007).
18. Ramazani, H., Shafahi, Y. and Seyedabrishami, S.E. \A fuzzy trac assignment algorithm based on driver perceived travel time of network links", Scientia Iran-ica, 18(2), pp. 190-197 (2011).
19. Dubois, D. and Prade, H. \Ranking fuzzy numbers in the settings of possibility theory", Information Science, 30(2), pp. 183-224 (1983).
20. Law, A., Simulation Modeling and Analysis, Fourth Edition, Averill M. Law & Associates, Tucson, Arizona (2007).
21. She, Y., Urban Transportation Networks, Englewood Clis, NJ: Prentice-Hall (1985).
22. Blue, M., Bush, B. and Puckett, J. \Application of fuzzy logic to graph theory", Los Alamos National Laboratory Report, LA-UR-96-4792 (1996).
Biographies
Mohammad Miralinaghi is a PhD student in the Department of Civil, Construction and Environmental Engineering at Purdue University. He holds MSc degrees in Transportation Engineering from Sharif University of Technology (2009), and The University of Alabama (2011), and BSc degree from Sharif University of Technology (2007). His research interests include transportation network modeling, congestion pricing, and trac assignment.
Yousef Shafahi received his BS degree from Shiraz University, Shiraz, Iran; MS degree from Isfahan Uni-versity of Technology, Isfahan, Iran, and PhD degree from University of Maryland, college Park, MD, USA. He joined the Department of Civil Engineering in Sharif University of Technology, Tehran, Iran, as an Assistant Professor, in 1998, and is now professor and head of transportation division in this department. His research interests are: urban transportation planning; road, rail, and air transportation; transit networks de-sign and scheduling; applications of operation research, soft computing and simulation in transportation. Ramin Shabanpour is a PhD student in the Depart-ment of Civil and Materials Engineering at University of Illinois at Chicago. He holds MSc (2013) and BSc (2010) degrees in Civil Engineering from Sharif University of Technology.