c
Sharif University of Technology, December 2009
New Dynamics Model for Rail Vehicles and
Optimizing Air Suspension Parameters Using GA
H. Sayyaadi
1;and N. Shokouhi
1Abstract. In this paper, a complete four axle rail vehicle model with 70 Degrees Of Freedom (DOFs) is addressed, which includes; a carbody, two bogies and four axles. In order to include track irregularity eects on vehicle behavior, a simplied track model for a straight line is proposed. As the performance of the suspension components, especially for air springs, has signicant eects on rail-vehicle dynamics and the ride comfort of passengers, a complete nonlinear thermo-dynamical air spring model which is a combination of two dierent models is introduced and then implemented in the complete rail-vehicle dynamics. By implementing the Presthus formulation [1], the thermo-dynamical parameters of an air spring are estimated and then tuned, based on the experimental data. Eects of air reservoir volume and connecting pipe length and diameter on system performances are investigated. For improving passenger comfort during their trips, air suspension parameters of the modeled rail vehicle are tuned to minimize the Sperling ride comfort index. Results showed that by modication of air suspension parameters, passenger comfort is improved and the ride comfort index is reduced by about 10%. The Genetic Algorithm (GA) optimization method is also used to optimize air suspension parameters. Results showed that improved air suspension congurations are more practical, compared to optimized ones.
Keywords: Rail vehicle dynamics; Air spring model; Air suspension parameters; GA; Optimization.
INTRODUCTION
Nowadays, the speed-up in technology and its new fea-tures bring about higher speed, with reliable safety and better ride comfort, in rail transportation industries. Trac jams in capital cities around the world, the waste of passenger time at air terminals, huge mass transportation and so on create a good opportunity for rail industries to attract more and more passengers and cargos to their services. In addition to safety, the other important issue for making passengers decide about transportation type is ride comfort during their trip. And that is why accessing better ride comfort during a trip for passengers is essential.
To serve good ride comfort to passengers, the secondary suspension of most new EMU and DMU rail-vehicles are equipped with air springs. Air springs are very important isolation components, which guarantee good ride comfort during the trip. In most published
1. School of Mechanical Engineering, Sharif University of Tech-nology, Tehran, P.O. Box 11155-9567, Iran.
*. Corresponding author. E-mail: [email protected] Received 28 September 2008; received in revised form 14 Febru-ary 2009; accepted 18 July 2009
rail-vehicle models, developed by research [2-12], the thermo-dynamical eects of air springs on rail-vehicle dynamics are ignored and secondary suspension is modeled by simple springs and dampers.
In the current work, the complete dynamics of one IRICo DMU trailer car with nonlinear component behavior is addressed. The dynamic behavior of all components is validated by some experimental results. In the proposed model, track rails are assumed to be rigid with a viscoelastic bed in vertical and lateral directions [13,14]. In order to consider rail irregularity eects on vehicle behavior, track data measured by an EM120 machine is used. In the model of a vehicle that moves along a straight line, eects of ballast and sleeper mass on vehicle behavior are ignored. Four contact parameters introduced by Shabana and Zaazaa [15,16] are used to dene the contact point between the rail and wheel. In order to accelerate the computations, a Feed Forward Neural Network (FFNN) is trained and used to compute the contact parameters. Contact forces are calculated, based on the Polach theory [17]. Eects of air suspension parameters on system performances are investigated. Sperling ride comfort is selected as the tness function and is minimized by engineering and Genetic Algorithm
Figure 1. Composition of IRICo DMU. optimization techniques. Results are summarized at
the end.
VEHICLE DESCRIPTION
An IRICo DMU train is composed of four cars: two motor cars at each end and two trailer cars in the middle. The composition of one complete train is shown in Figure 1.
Each car is supported by two bogies. The side view of a two axle IRICo DMU trailer bogie is shown in Figure 2. To guarantee the stability of the vehicle and good ride comfort for the passenger, bogies
Figure 2. Side view of IRICo DMU trailer bogie.
are equipped with primary and secondary suspension systems. The secondary suspension has two air springs to suspend the vehicle body, four vertical and lateral dampers and two connection links to connect the bogie frame to the carbody. The primary suspension is made of two coil springs, two leaf springs and one vertical damper at each side of the wheel set.
DYNAMIC MODEL Track Model
In order to include eects due to geometrical track irregularities in the rail-vehicle dynamics, a simplied version of the Jin and Wen [13,14] track model is used. In the proposed model, four track irregularities are included as bed disturbances. As the vehicle is modeled in a straight line, the eects of ballast and sleeper mass on the vehicle dynamics, and the coupling eects between the left and right ballast masses are ignored. The estimated parameters for track stiness and damping rates are according to the work of Jin and Wen [13]. A schematic diagram of the track model containing these four irregularities is shown in Figure 3.
Contact Point and Contact Forces Model By using four geometrical contact parameters, sr
1, sr2,
sw
1 and sw2, shown in Figure 4, and the method
pro-posed by Shabana and Zaazaa [15], the contact point between the rail and wheel is determined. According to Shabana, sr
1is found out by integrating the speed
com-ponent of point Q along the rail shown in Figure 4; sw 2 is
the angle between the Z-axis of the coordinate system xed to the axle and vertical line. The remaining two contact parameters are calculated by a searching algorithm, which guarantees the perpendicularity of the rail reaction force and the tangent plane of the wheel at the contact point. To do this, four geometrical parameters, L, R, A and A, shown in Figure 5
are investigated. By these assumptions, using four contact parameters and the normal reaction force of the rails, creep forces are calculated, based on the Polach theory [17].
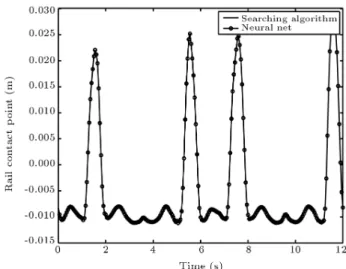
For decreasing the simulation time, a feed forward neural network is suggested to compute these two contact parameters, as shown in Figure 6. This neural
Figure 4. Four contact parameters introduced by Shabana and Zaazaa [15].
Figure 5. Eective parameters, L, V, A and A for
contact point extraction.
network has four inputs, L, R, A and A, two
outputs, sr
2 and sw1, and 14 neurons in two hidden
layers. The activation function for hidden layers and the output layer is: tangent sigmoid and linear, respectively. The network is trained based on the Levenberg-Marquardt back-propagation method.
The proposed network is trained according to the searching algorithm results generated during sinusoidal variations of the axle states. The lateral and vertical axle states changed with 0.01 mm and 0.003 mm ampli-tude and 0.5 Hz and 0.25 Hz frequencies, respectively. At the same time, the yaw and roll angle of the axle varied with 0.4 deg. and 0.2 deg. amplitude and 0.334 Hz and 0.1667 Hz frequencies. The simulation time is selected so that each input signal has at least two periods in the simulation time. Results are shown in Figures 7 and 8. Good agreement between the network output and searching algorithm results guarantees the performance of the trained network. Synaptic weights of the trained network are presented in the Appendix.
Figure 6. Feed-forward neural network.
Figure 8. Contact point position in left wheel. Vehicle Model
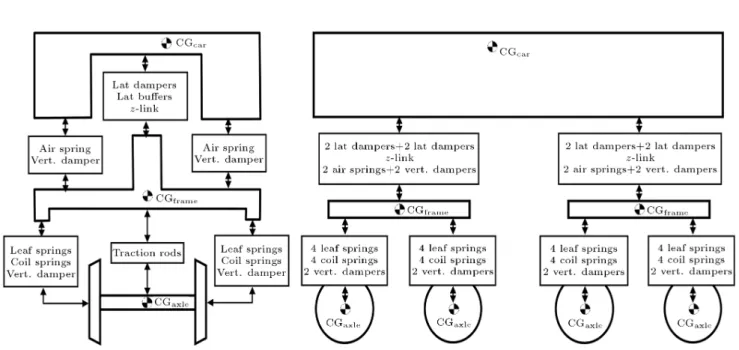
This work proposes a new method for studying the suspension components eects on the vehicle dynamic performances. Accordingly, real behaviors of all com-ponents will be described in this section. For this reason and due to the complexity of component be-haviors, especially for air springs, describing complete vehicle dynamics with a single set of equations is almost impossible. So, the vehicle is modeled as a modular type and the internal forces of each component are calculated using a nonlinear description function and system states. A Newtonian approach is implemented for the dynamic modeling of dierent parts of the system and the interacting forces and moments be-tween them are investigated. The vehicle model, with 42 Degrees Of Freedom (DOF), is shown in Figure 9
and some of its important specications are listed in Table 1.
Air Spring Model
Air springs which are made of Carbon Black Filled Natural Rubber (CBFNR) have a long lifetime and isolate the vehicle body from unpredictable noise and vibration. Air spring behaviors are so complicated that they cannot be modeled simply by simple equations. Air spring response is independent of the excitation frequency [18], and it behaves like a stress relaxation function [19]. In addition, it has an asymmetric hysteresis loop, which is independent of the excitation frequency [20].
In this research work, the Berg model, which is validated by some experimental data up to 16 Hz frequencies [21], is used to simulate air spring dynamics. However, because of diculties comprised from assigning previous turning point displacements to the variable, the frictional part of this model is replaced by the simplied viscoelastic model dened by Haupt and Sedlan. Schematic diagrams of the proposed modied models in vertical and lateral directions are shown in Figure 10. A complete explanation about this model is presented in [22].
According to Berg, and by taking into account the Haupt and Sedlan model, dierential equations of air spring behavior in vertical, lateral and longitudinal directions are proposed as follows:
Vertical direction:
M ws= Kvz(z ws) Czj _wsjsign( _ws);
= 1:8; (1)
Table 1. Masses and inertia properties of the rail-vehicle.
Parameters Values Parameters Values Parameters Values
maxle 1747 kg mframe 2841.3 kg mcarbody 33142 kg
Ixx;axle 1098 kgm2 Ixx;frame 1030 kgm2 Ixx;carbody 30000 kgm2
Iyy;axle 191 kgm2 Iyy;frame 1054 kgm2 Iyy;carbody 687231 kgm2
Izz;axle 1098 kgm2 Izz;frame 2003 kgm2 Izz;carbody 687231 kgm2
Figure 10. a) Proposed modied model for air spring; b) One-dimensional Haupt & Sedlan model.
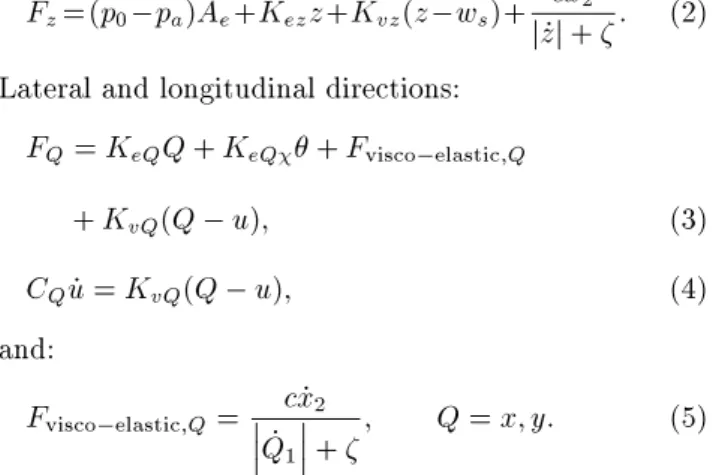
Fz=(p0 pa)Ae+Kezz+Kvz(z ws)+j _zj + c _x2 : (2)
Lateral and longitudinal directions: FQ = KeQQ + KeQ + Fvisco elastic;Q
+ KvQ(Q u); (3)
CQ_u = KvQ(Q u); (4)
and:
Fvisco elastic;Q= c _x2
_Q1 +
; Q = x; y: (5)
The above parameters are estimated by the following equations [1]:
M = lsAs
Ae
As
Vr0
Vb0+ Vr0
2
; (6)
Kez = p0A2 1 en
Vb0+Vr0 + pg
dAe
dz
+K 1
auxiliary
! 1
; (7)
Kvz = p0A2 1 en
Vb0 + pg
dAe
dz
+K 1
auxiliary
! 1
Kez; (8)
Cz; = 12:kt:As
Ae
As
Vr0
Vb0+ Vr0
1+
;
= 2: (9)
The exact Cz;1:8 value is calculated based on the
method introduced by Presthus, and the stiness, KeQ, is approximated by KeQ = 0:7(KeQh +
weight) [1]. The parameters in the above equations are described in Table 2.
To determine the exact values of the air spring parameters, a real test of the air spring was carried out for IRICo DMU air springs at the ContiTech Company in Germany. Figure 11 depicts the air spring test.
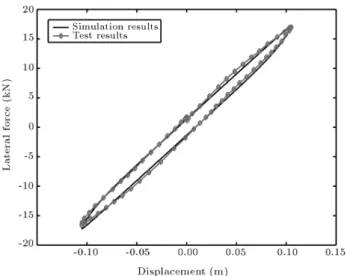
Based on the method introduced by Docquier et al. [23] and according to the real test data and simulation results, the loss angle, vertical dynamic stiness and lateral hysteresis loop of the air spring are shown in Figures 12, 13 and 14. As can be concluded from these gures, a good agreement between the real
Figure 11. Test rig of air spring at ContiTech Company, Germany.
Table 2. Air spring parameters value.
Parameters Description Values
ls Connecting pipes' length 3.2 m
As Connecting pipes' cross section 0.001359 m2
Ae Eective area of air spring 0.291 m2
P0 Initial absolute air spring pressure 3.806 bar
Pa Air spring pressure
-Pg Gauge pressure
Density of air at P0 pressure 4.523 kg/m3
Vr0 Reservoir volume 0.04 m2
Vb0 Air spring volume 0.064 m2
kt Total loss coecient of connection pipes 3.4727
Kauxiliary Auxiliary spring stiness in air spring 8234 kN/m
Constant coecient
-KeQ, KeQx Elastic stiness parameter
-KvQ Viscous stiness parameter
-CQ Viscous linear damping parameter
Vehicle roll angle
-n Polytropic index
-Figure 12. Loss angle of air spring, M = 198:385 kg, Kez= 461:629 N/mm, Kvz= 351:185 N/mm,
Cz;1:8= 11:508 kN(s/m)1:8, khaupt= 96 kN/m,
Chaupt= 1:52 kNs/m, = 0:00063.
test and simulation results is achieved. Dampers Model
Based on the experiments carried out by the SACHS Co. in Germany, the damping rates of the dampers are functions of velocity. The test results of IRICo DMU dampers are shown in Figure 15. The damping rate of each damper can be described by a bi-linear function; consequently:
F = a _damper+ b:
Figure 13. Dynamic vertical stiness of the air spring, M = 198:385 kg, Kez= 461:629 N/mm, Kvz= 351:185
N/mm, Cz;1:8= 11:508 kN(s/m)1:8, khaupt= 96 kN/m,
Chaupt= 1:52 kNs/m, = 0:00063.
Parameters for dierent conditions and installation locations of dampers, based on the previous equation, are tabulated in Table 3.
Lateral Buer Model
Lateral displacement of the carbody is restricted by four lateral buers installed on each side of the bogie, as shown in Figure 16. Each lateral buer has a primary compression force equal to 100 N. A force-displacement diagram of the lateral buer, based on the experimental results, is shown in Figure 17. An air gap
Table 3. Dampers parameters.
Type of Damper Condition a b
0 j _damperj 0:1 40800 0
Primary vertical dampers 0:1 < _damper 19163 2163.7
_damper< 0:1 19025 -2177.5
0 j _damperj 0:05 61375 0
Secondary vertical/lateral dampers 0:05 < _damper 18221 2157.7
_damper< 0:05 14143 -2361.6
of 17 mm between the carbody and the lateral buer lets the carbody move freely in this range. Lateral displacement of the carbody over 40 mm is restricted by two stoppers installed on each bogie.
Based on the experimental results, the mechanical behavior of the lateral buers is formulated as follows:
Figure 14. Lateral hysteresis loop of the air spring, Key= 154 kN/m, Kvy= 82:26 kN/m, Cy= 1:109 kNs/m,
khaupt= 96 kN/m, Chaupt= 1:52 kNs/m, = 0:00063.
Figure 15. Test results of IRICo DMU dampers, done by SACHS, Germany.
8 > > > > < > > > > :
F = 0 0 < x < 17
F = 5 10 5(x 17)4
0:0019(x 17)3
+ 0:0144(x 17)2
+ 1:1525(x 17) + 0:100 17 x 40
(10)
Connection Link Model
Each center pivot is linked to the bogie frame by two connection links. Each link has a rubber bush at each end. Based on the experimental tests done by GMT Co. in Germany, the static stiness of
Figure 16. Lateral buer position in bogie.
the bush in radial, torsional and cardanic movements are calculated. Because these bushes are made from CBFNR rubber, for exact modeling of the connection link behavior in the vehicle dynamics, the simplied one-dimensional Haupt and Sedlan model is used for the radial movement of these bushes by the following function:
Fvisco elastic;radial=j _rc _x2
1j + : (11)
The Haupt and Sedlan parameters dened in Table 4 are according to the Allen results [24].
Primary Suspension, Stiness Coecients Model
Four leaf springs in each axle direct the wheel-set during the curves. Each leaf spring has one rubber bush at each end. A schematic diagram of the leaf spring in the x z plane is shown in Figure 18. The same concept is developed for the other planes.
Considering the boundary condition of the leaf spring at two ends, the stiness of the leaf spring in bending is determined as follows:
k 1
leaf Vertical=EI1
L4kty;bush
4(Lkty;bush+ EI)
L3
3
: (12)
Figure 18. Leaf spring schematic diagram in x z plane.
Based on the manufacturer test reports, the coil spring stiness coecients are approximated linearly. By using the above equation, the stiness coecients of the primary suspension are determined as Ta-ble 5.
Complete Vehicle Model
All the components models used in the rail-vehicle dynamics with related internal DOFs are listed in Table 6. It can be seen that suspension components add 28 internal DOFs to the model. Whereas the vehicle masses have totally 42 DOFs, the complete rail-vehicle will be a model of 70 DOFs.
MODEL SIMULATION AND TEST RESULTS
A dynamic test of the IRICo DMU was performed on the Tehran-Ghazvin route to validate the performance of the proposed dynamic model. The VBOX III GPS, manufactured by Racelogic in the UK, is used to measure the exact position and speed of the train. The measured speed is monitored and recorded by one of the 16 channels of the CRONOS PL data acquisition system manufactured by IMC in Australia, which was connected to a portable computer. The accelerations of the trailer car masses are recorded by 15 remaining channels by means of accelerometers with the specications presented in Table 7. These accelerometers are installed on two axles, two bogie frames and on the oor of the carbody inside the car according to Figures 19 and 20. As the track data and geometrical irregularities recorded by the EM120 machine are not up-to-date and were recorded 25 months before the dynamic test, by using track data a poor agreement between the test and simulation results is achieved. For this reason, the vehicle model Table 4. Haupt and Sedlan model parameters and stiness coecients of bushes.
Parameters Values Parameters Values
khaupt 9 kN/mm kradial 2222.2 N/mm
Chaupt 3.8 kNs/m ktorsion 31.25 Nm/
0.00063 kcardanic 45.525 Nm/
Table 5. Primary suspension system, mechanical specications.
Parameters Values Parameters Values
kx;bush, kz;bush 45000 N/mm kty;bush 32 Nm/
ky;bush 2118 N/mm ktx;bush, ktz;bush 1659 Nm/
kx;leaf spring 44145 N/mm kx;coil spring 365.69 N/mm
ky;leaf spring 2118 N/mm ky;coil spring 365.69 N/mm
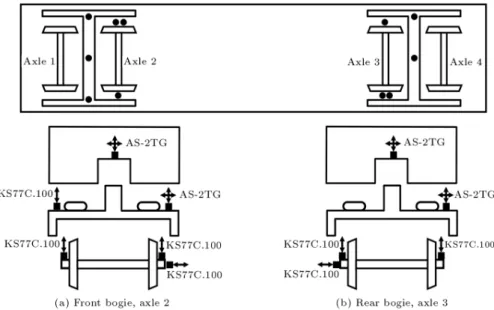
Figure 19. Accelerometers installation position.
Table 6. Suspension components of rail vehicle model (28 internal DOFs).
Components No. Identier Equations Internal DOF
Secondary vert. damper 2 per bogie
Secondary lat. damper 2 per bogie Bi-linear function {
Primary vert. damper 2 per bogie
Vertical Nonlinear, Berg & Sedlan Model x2, ws
Air spring 4 per car Lateral Nonlinear, Berg & Sedlan Model x2, u
Longitudinal Nonlinear, Berg & Sedlan Model x2; u
Lateral buer 4 per car Nonlinear-polynomial, order 4 {
Bush-link 2 pairs per bogie Nonlinear, Sedlan model x2
coil spring 4 per bogie Linear in space, based on experimental data { Leaf spring 4 per bogie Linear in space, based on analytical calculations {
Table 7. Accelerometers specications.
KS77C.100 AS-2TG
Manufacturer Manfred Weber, Germany Kyowa, Japan
Type ICP r compatible Strain gauge
Range (g: 9.81 m/s2) 60 g 2 g
is studied in two dierent phases. In the rst phase and to validate the track model, the model was exe-cuted by considering old track irregularities, and axle accelerations are investigated. In the second phase, measured axle accelerations and their integrals in the time domain are used as reference states to validate the complete vehicle model.
A complete explanation about model validation and test results are presented in [25]. The ve-hicle test results and the proposed veve-hicle model
have almost the same behavior in the frequency do-main.
AIR SUSPENSION PARAMETER INFLUENCES
In this section, the inuence of rail-vehicle secondary suspension parameters on the performance of the air spring including the air reservoir volume and connect-ing pipe lengths and diameters will be discussed.
Figure 20. Sensors installation position on the trailer car. Air Reservoir Volume
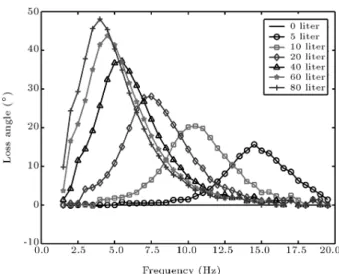
The behavior of air springs is highly aected by air reservoir volume. For studying the inuences of air reservoir volume on the air suspension performances, the dynamic stiness and loss angle of the air spring reaction force for various air reservoir volumes are studied within a 0 20 Hz frequency, as shown in Figures 21 and 22. As can be seen, by adjusting the air reservoir volume to zero, the air spring behaves as a simple stiness component and the loss angle of reaction force is zero for all excitation frequencies. This fact indicates that no damping characteristics exist in the system when the air reservoir volume is zero.
Increasing air reservoir volume divides dynamic stiness to low, transient and high frequency sections and appends damping to the system by creating a loss angle within a specic frequency range. By increasing air reservoir volume, maximum loss angle is occurred at lower frequencies with higher amplitude, as increasing the air reservoir volume from 5 to 80 liters, increases the maximum loss angle from 15.7at 14.5 Hz to 48.1
at 4 Hz frequency.
By increasing air reservoir volume, the dynamic stiness of the air suspension system is decreased at low
Figure 21. Dynamic vertical stiness of air spring for various air reservoir volumes.
Figure 22. Loss angle of air spring for various air reservoir volumes.
frequencies and increased at high frequencies. In the same way, and as can be seen in Figure 22, a maximum loss angle is also occurred at lower frequencies by increasing air reservoir volume. So, by identifying the frequency resonance of the rail-vehicle, the transient section of the air spring response can be adjusted so that vehicle responses are restricted.
Connecting Pipe Diameter
As can be seen in Figure 23, by increasing the con-necting pipe diameter, the transient section of the air spring dynamic stiness is shifted to higher frequencies. The same concept is valid for the loss angle, as shown in Figure 24. By increasing the connecting pipe diameter, the maximum loss angle is shifted to higher frequencies with higher amplitude.
Whereas increasing air reservoir volume shifts the graphs to lower frequencies, increasing the connecting
Figure 23. Dynamic vertical stiness of air spring for various pipe diameters.
Figure 24. Loss angle of air spring for various pipe diameters.
pipe diameter shifts the graphs to the higher frequen-cies. Comparing reservoir volume and connecting pipe diameter inuences, shows both factors add a damping characteristic to the system.
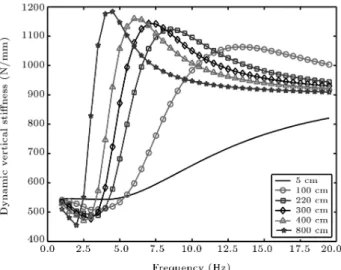
Connecting Pipe Length
Dynamic stiness and the loss angle of the air spring for dierent connecting pipe lengths are shown in Figures 25 and 26. By decreasing the connecting pipe length, dynamic stiness and loss angle graphs are widened. As can be seen, for all connecting pipe lengths, the low frequency section almost remained unchanged. Furthermore, the transient section is widened and the high frequency section is shifted to higher frequencies.
So, by adjusting the connecting pipe length, the damping characteristic of the air spring can cover a
Figure 25. Dynamic vertical stiness of air spring for various pipe lengths.
Figure 26. Loss angle of air spring for various pipe lengths.
wider range of excitation frequencies. By choosing a proper value for these three air suspension parameters, and based on the design requirements in rail-vehicles, obtaining satisfactory behavior from the system is possible.
PASSENGER COMFORT IMPROVEMENT Engineering Approach
In this section, secondary suspension parameters of rail vehicles are tuned so that good ride comfort for passen-gers is guaranteed during their trip. Accordingly, per-formances of the air suspension system in rail vehicles are investigated. The Power Spectral Density (PSD) of the rst axle, the front bogie frame and carbody vertical accelerations for real air suspension parameters are shown in Figure 27. As can be seen from this gure,
Figure 27. PSD diagram of rst axle, front bogie frame and carbody vertical accelerations.
the carbody is excited strongly between 1.5 and 3 Hz frequencies.
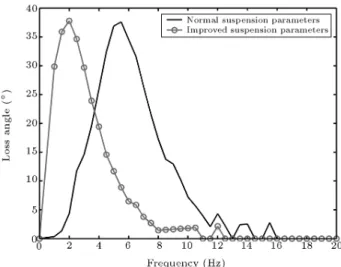
For real air suspension parameters, the maximum loss angle appears around 6 Hz frequencies, as shown in Figure 28. Whereas secondary air suspension damps vertical excitations around 6 Hz frequencies, the carbody vertical acceleration has no signicant excitation within this range. So, the capabilities of the air suspension system for damping carbody vertical vibrations in the modeled rail vehicle are not well employed. The carbody is excited with maximum amplitude within 1.5 and 3 Hz frequencies, as shown in Figure 27, which should be damped with a secondary air suspension system.
To reduce transmitted vertical vibrations to the carbody, the air suspension parameters of the modeled rail vehicle are tuned so that maximum loss angle oc-curs at lower frequencies, as shown in Figure 29. Based on the presented graphs in section 5, by increasing the air reservoir volume from 40 liters to 100 liters, increasing the connection pipe length from 2.2 m to 3.2 m and decreasing the connecting pipe diameter from 40 mm to 30 mm, the maximum loss angle is shifted to the lower frequencies. In this way, the maximum damping of the system occurs at lower frequencies where the carbody is excited with strong vibrations.
PSD diagrams of the rst axle, the front bogie frame and the carbody vertical accelerations for two sets of air suspension parameters are shown in Fig-ure 30. As can be seen from this gFig-ure, adjusting air suspension parameters reduced the transmitted vertical low frequency vibrations to the carbody.
For an evaluation of achieved improvement in the system performances, the Sperling ride comfort index [26] which is dened by the following equation is implemented:
Figure 28. Loss angle of air spring response. Vreservoir= 40 Lit, Lpipe= 2200 mm, Dpipe= 40 mm.
W z = 0 @
30
Z
0:5
a3B3df
1 A
1=10
: (13)
In the above equation, f is frequency, a is acceleration in the frequency domain (cm/s2) and B is dened by
the following equations:
A = (1 0:277f2)2+ (1:563f 0:0368f3)2;
B = 0:588
1:911f2+ (0:25f2)2
A
1=2
: (14)
The Sperling ride comfort index is expressed according to Table 8.
Figure 29. Loss angle of air spring response.
Vnormal= 40 Lit, Lnormal= 2200 mm, Dnormal= 40 mm,
Vimproved= 100 Lit, Limproved= 3200 mm, Dimproved= 30
mm.
Figure 30. PSD diagram. Vnormal= 40 Lit,
Lnormal = 2200 mm, Dnormal= 40 mm,
Vimproved= 100 Lit, Limproved= 3200 mm,
Table 8. Sperling ride comfort index (Wz).
Subjective Ride Comfort Wz
Just noticeable 1
Clearly noticeable 2
More pronounced but not unpleasant 2.5
Strong, irregular but still tolerable 3
Very irregular 3.25
Extremely irregular, unpleasant, annoying, prolonged exposure intolerable 3.5
Extremely unpleasant, prolonged exposure harmful 4
Simulation results for two sets of air suspension parameters are shown in Figure 31. As can be seen, by simply modifying air suspension parameters, passengers comfort is improved and the ride comfort index is reduced about 10%.
Genetic Algorithm Optimization Approach Whereas only the ride comfort index is available for evaluating suspension performances, based on the com-plexity of rail vehicle dynamic equations, the Genetic Algorithm approach is utilized to optimize air sus-pension parameters and improve the ride comfort of passengers [27,28]. To do this, a searching range, as dened in Table 9, is dened for suspension parameters. Based on the above parameter variations, one string with 20 bits can cover the searching range very well. Dedicated bits for each parameter in the individuals are dened in Figure 32. In this way, the searching range is divided into 127 sections for the
Figure 31. Sperling ride comfort index variation in Tehran-Ghazvin route (straight section) with 80 km/h speed. Vnormal= 40 Lit, Lnormal= 2200 mm,
Dnormal= 40 mm, Vimproved= 100 Lit,
Limproved= 3200 mm, Dimproved= 30 mm.
connecting pipe lengths and reservoir volume and into 63 sections for the connecting pipe diameters.
The equivalent binary code for each section and the real value of parameters are related to each other, according to the following equations:
ds= 20 + nds 60=63; (15)
ls= 40 + nls 760=127; (16)
Vr0= 10 + nVro 190=127: (17)
As reaching to a ride comfort index equal to 1.5 in trains with a passive suspension is almost impossible, and in order to highlight the lower ride comfort indexes, a tness function which should be maximized is intro-duced based on the following equation. By nding the best conguration of suspension parameters where the following function has its maximum value, passenger comfort will be improved during their trip.
Fitness Function =W 1
z 1:5: (18)
Because three dierent variants are dened by a single individual and for speeding up the convergence of GA and improving optimization performances, the following statements are assumed [29]:
Figure 32. Dedicated bits for each parameter in individuals.
Table 9. Searching space.
Parameters Values Variation
Range ds-pipe diameter (mm) 20 ds 80 60
ls-pipe length (mm) 40 ls 800 760
1. Two points cross over and bitwise inversion muta-tion methods are used.
2. The observed best-tted individual is selected for the next generation without any random exper-iment to avoid the best-tted individual dying (elitism).
Six populations of the rst generation containing as-built suspension parameters of an IRICo rail vehicle are shown in Table 10.
The mean value of the tness function and the Sperling ride comfort index of the best individuals for
Figure 33. Mean value of tness function during generation.
400 generations with a dened algorithm are shown in Figures 33 and 34. Drops in Figure 31 are related to the times when the mutation operator acts on the population. As can be seen from Figure 32, after 400 generations, the ride comfort index is reduced from Wz = 3:131 to Wz = 2:517. 400th generation
individuals are presented in Table 11.
PSD diagrams of the front bogie frame and carbody vertical accelerations for three dierent air suspension congurations including initial, improved (engineering approach) and optimized are shown in Figure 35. As is clear, the transmitted vibration to
Figure 34. Sperling ride comfort index of best individuals during 400 generations.
Table 10. Initial population. No Pipe Diameter
(mm)
Pipe Length (cm)
Reservoir Volume
(liter) Binary Individual Fitness
1 40 220 40 010101|0011110|0100001 0.6131
2 68 648 55 110010|1100110|0011110 0.6653
3 20 200 80 000000|0011011|0101111 0.6209
4 56 344 30 100110|0110011|0001101 0.5760
5 32 192 48 001101|0011001|0011001 0.6414
6 80 40 10 111111|0000000|0000000 0.5041
Table 11. 400th generation individuals. No Binary Individual Pipe Diameter
(mm)
Pipe Length (cm)
Reservoir Volume
(liter) Fitness
1 011010|1100110|1101111 44.8 650.4 176.1 0. 9833
2 011010|1100110|1101111 44.8 650.4 176.1 0.9833
3 100101|0011000|1100000 55.2 183.6 153.6 0.8331
4 011010|1100111|0011111 44.8 656.4 54.4 0. 7073
5 011010|1100110|1101111 44.8 650.4 176.1 0. 9833
Figure 35. PSD diagrams of front bogie frame and carbody vertical accelerations. Vnormal= 40 Lit,
Lnormal= 2200 mm, Dnormal= 40 mm,
Vimproved= 100 Lit, Limproved= 3200 mm,
Dimproved= 30 mm, Voptimized= 176:1 Lit,
Loptimized= 6504 mm, Doptimized= 44:8 mm.
the carbody is reduced around 2 Hz frequencies and is increased around 3 Hz frequencies to improve the ride comfort of passengers during their trip.
Sperling ride comfort index variations for the three above mentioned air suspension congurations are shown in Figure 36. As can be seen and by comparing with the improved one, an optimized suspension conguration slightly improves the ride comfort of passengers. Loss angle diagrams of the
Figure 36. Sperling ride comfort index for
Tehran-Ghazvin route (straight section) with 80 km/h speed. Vnormal= 40 Lit, Lnormal= 2200 mm,
Dnormal= 40 mm, Vimproved= 100 Lit,
Limproved= 3200 mm, Dimproved= 30 mm,
Voptimized= 176:1 Lit, Loptimized= 6504 mm,
Doptimized= 44:8 mm.
Figure 37. Loss angle of air spring response.
Vnormal= 40 Lit, Lnormal= 2200 mm, Dnormal= 40 mm,
Vimproved= 100 Lit, Limproved= 3200 mm,
Dimproved= 30 mm, Voptimized= 176:1 Lit,
Loptimized= 6504 mm, Doptimized= 44:8 mm.
air suspension system for three dierent suspension congurations are shown in Figure 37. As is clear, and without any forcing policy to the optimization algorithm, a 2 Hz frequency is achieved for best suspension performances, which is in agreement with engineering technique results. Both improved and optimized congurations focused on a 2 Hz frequency as the objective value where transmitted vibrations to the carbody should be reduced. Meanwhile, for improving ride comfort and for better vibration isolating, the optimized conguration tried to increase the loss angle by around 2 Hz frequencies.
CONCLUSION
This research work proposes a new model for study-ing the inuences of suspension component behavior on rail vehicle dynamics. To do this, a complete track-vehicle model with 70 degrees of freedom is addressed as a modular type. As the air springs are a very important isolating component in rail vehicles, a complete nonlinear air spring model, taking into consideration thermo-dynamical eects, is developed. The model coecients are tuned, based on real test data, and can be easily used in the dynamic modeling of air springs. The eects of air reservoir volume and connecting pipe length and diameter on system performances are investigated. By using the achieved illustrative graphs about air suspension parameter inuences on system performances, the parameters are tuned so that transmitted vibration to the passengers is reduced. To optimize air suspension behavior, a GA optimization approach is investigated. By using opti-mized suspension parameters and comparing them with
an engineering approach, suspension performances are slightly improved. Simulation results showed that in an optimization approach, the objective frequency range is well matched with the engineering one, which approves the engineering technique results. Whereas the ride comfort index in an optimized conguration is slightly improved with respect to the engineering one, and by comparing connecting pipe lengths and reser-voir volume in engineering and optimization technique congurations, it is concluded that, because of space limitation under the carbody, engineering approach results are more practical.
ACKNOWLEDGMENTS
The authors express their sincere thanks to Sharif University of Technology. They are also grateful for the generous support of the Irankhodro Rail Transport Industries Co. and would also like to express their sincere thanks to Mr. N. Soo for his comprehensive support.
REFERENCES
1. Presthus, M. \Derivation of air spring model parame-ters for train simulation", Master dissertation, Depart-ment of applied physics and mechanical engineering, Division of uid mechanics, LULEA University (2002). 2. Sun, Y.Q. and Dhanasekar, M. \A dynamic model for the vertical interaction of the rail track and wagon sys-tem", International Journal of Solids and Structures, 39, pp. 1337-1359 (2002).
3. Lei, X. and Noda, N.A. \Analyses of dynamic response of vehicle AND track coupling system with random irregularity of track vertical prole", Journal of Sound and Vibration, 258, pp. 147-165 (2002).
4. Hou, K., Kalousek, J. and Dong, R. \A dynamic model for an asymmetrical vehicle/track system", Journal of Sound and Vibration, 267, pp. 591-604 (2003). 5. Popp, K., Kaiser, I. and Kruse, H. \System dynamics
of railway vehicles and track", Archive of Applied Mechanics, 72, pp. 949-961 (2003).
6. Tanabe, M. et al. \Computational model of a Shinkansen train running on the railway structure and the industrial applications", Journal of Materials Processing Technology, 140, pp. 705-710 (2003). 7. Durali, M. and Bahabadi, M.M.J. \Investigation
of train dynamics in passing through curves using a full model", Rail Conference, Proceedings of the ASME/IEEE Joint, pp. 83-88 (2004).
8. Li, Y. and Qiang, Sh. et al. \Dynamics of wind-rail vehicle-bridge systems", Journal of Wind Engineering and Industrial Aerodynamics, 93, pp. 483-507 (2005). 9. Baeza, L., Roda, A. and Nielsen, J.C.O. \Railway
vehicle/track interaction analysis using a modal sub-structuring approach", Journal of Sound and Vibra-tion, 293, pp. 112-124 (2006).
10. Li, P. and Goodall, R. et al. \Estimation of railway ve-hicle suspension parameters for condition monitoring", Journal Article, Control Engineering Practice, 15, pp. 43-55 (2007).
11. Zhang, N. and Xia, H. et al. \Vehicle-bridge interaction analysis under high-speed trains", Journal of Sound and Vibration, 309, pp. 407-425 (2008).
12. Banerjee, N. et al. \Bond graph modeling of a railway truck on curved track", Simulation Modeling Practice and Theory, Available online from (2008).
13. Jin, X.S. and Wen, Z.F. \Eect of passenger car curving on rail corrugation at a curved track", Journal of Wear, 260, pp. 619-633 (2006).
14. Jin, X.S. and Wen, Z.F. \Eect of discrete track support by sleepers on rail corrugation at a curved track", Journal of Sound and Vibration, Available online from (2008).
15. Shabana, A.A. and Zaazaa, Kh.E. \Development of elastic force model for wheel/rail contact problems", Journal of Sound and Vibration, 269, pp. 295-325 (2004).
16. Shabana, A.A. and Zaazaa, Kh.E., Railroad Vehicle Dynamics, a Computational Approach, CRC Press, Taylor & Francis group (2008).
17. Polach, O. \A fast wheel-rail forces calculation com-puter code", Journal of Vehicle System Dynamics, Issue suppl., 33, pp. 728-739 (1999).
18. Boast, D., Fellows, S. and Hale, M. \Eects of tem-perature, frequency and amplitude on the dynamic properties of elastomers", Conference Paper, AVON Automotive, 03 (2002).
19. Haupt, P. and Sedlan, K. \Viscoplasticity of elas-tomeric materials: experimental facts and constitutive modeling", Journal Article, Archive of Applied Me-chanics, 71, pp. 89-109 (2001).
20. Berg, M. \A non-linear rubber spring model for rail vehicle dynamics analysis", Journal of Vehicle System Dynamics, 30, pp. 197-212 (1998).
21. Berg, M. \A three-dimensional airspring model with friction and orice damping", Journal of Vehicle Sys-tem Dynamics, 33, pp. 528-539 (1999).
22. Sayyaadi, H. and Shokouhi, N. \Eects of air reservoir volume and connecting pipes' length and diameter on the air spring behavior in rail-vehicles", Iranian Journal of Science & Technology, Shiraz University (2009).
23. Docquier, N., Fisette, P. and Jeanmart, H. \Mul-tiphysic modeling of railway vehicles equipped with pneumatic suspensions", Journal of Vehicle System Dynamics, 45(6), pp. 505-524 (2007).
24. Allen, P. \Models for the Dynamic Simulation of Tank Track Components", PhD dissertation, Craneld University, Academic Year (2005-2006).
25. Sayyaadi, H. and Shokouhi, N. \A new model in rail-vehicles dynamics considering nonlinear suspension components behavior", Elsevier,
International Journal of Mechanical Sciences, doi:10.1016/j.ijmecsci.2009.01.003 (2009).
26. Dukkipati, R.V. and Harg, V.K., Dynamics of Railway Vehicle Systems, Academic Press, Harcourt Brace Jovanovich, Publishers (1984).
27. Gen, M. and Cheng, R., Genetic Algorithms and Engineering Optimization (Engineering Design and Automation), Wiley Interscience (1999).
28. Goldberg, D.E., Genetic Algorithms in Search, Op-timization and Machine Learning, Addision Wesley, Reading MA (1989).
29. Bodenhofer, U., Genetic Algorithms: Theory and Ap-plications, Lecture Notes, Third Edition, Fuzzy Logic Laboratorium Linz-Hagenberg (2003).
APPENDIX
Neural network activation functions and synaptic weights of the trained network for the contact param-eters are as follows:
y = f(W:x + b);
fhidden layers(x) =1 + e2 2x 1;
fOutput layer(x) = x;
W1=
2 6 6 6 6 6 6 6 6 6 6 6 6 4
0:4879 143:29 153:58 296:96
440:24 1618:3 922:66 1334:3
31:414 61:038 58:806 286:63
24:646 3:7075 68:557 168:59
90:293 204:3 141:32 326:46
25:573 141:03 86:023 164:47
74:14 5:2036 304:34 42:909
19:799 90:972 249:49 199:13
29:727 80:828 67:982 241:81
3 7 7 7 7 7 7 7 7 7 7 7 7 5 ;
b1=
2 6 6 6 6 6 6 6 6 6 6 6 6 4 1:7844 343:02 21:85 18:173 71:443 16:336 58:029 11:211 20:332 3 7 7 7 7 7 7 7 7 7 7 7 7 5 ;
W2=
2 6 6 6 6 4
3:8078 0:34866 81:023 13:621
23:264 6:9369 340:7 27:582
3:8083 0:34666 80:939 13:612
1:464 0:20806 51:506 3:1561
0:76366 0:01884 9:4441 0:49465
0:1302 28:59 1:6923 10:078 107:8
6:3036 210:98 10:203 1:4993 556:53
0:12951 28:561 1:6881 10:077 107:69
2:0031 23:906 3:4124 3:1543 76:946
0:0555 6:2466 0:25575 0:15104 16:544 3 7 7 7 7 5;
b2=
2 6 6 6 6 4 4:2292 2:5291 4:2332 1:0352 0:5185 3 7 7 7 7 5;
W3=
7:73 0:003244 7:7259 7:5261 0:003135 7:5231
0:022746 0:00677 0:021734 0:020275
; b3=
0:014172 0:00269
![Figure 3. Track model - parameters are based on Jin & Wen work [13].](https://thumb-us.123doks.com/thumbv2/123dok_us/8398502.2231392/2.892.218.699.883.1126/figure-track-model-parameters-based-jin-wen-work.webp)