Interior Immigration Enforcement:
Programs Targeting Criminal Aliens
Marc R. Rosenblum
Specialist in Immigration Policy
William A. Kandel
Analyst in Immigration Policy
October 21, 2011
Congressional Research Service
7-5700 www.crs.gov R42057
Summary
Congress has a long-standing interest in seeing that immigration enforcement agencies identify and deport serious criminal aliens. The expeditious removal of such aliens has been a statutory priority since 1986, and the Department of Homeland Security (DHS) and its predecessor agency have operated programs targeting criminal aliens for removal since 1988. These programs have grown substantially since FY2005.
Despite the interest in criminal aliens, inconsistencies in data quality, data collection, and definitions make it impossible to precisely enumerate the criminal alien population, defined in this report as all noncitizens ever convicted of a crime. CRS estimates the number of noncitizens incarcerated in federal and state prisons and local jails—a subset of all criminal aliens—at 173,000 in 2009, with state prisons and local jails accounting for somewhat more incarcerations than federal prisons. The overall proportion of noncitizens in federal and state prisons and local jails corresponds closely to the proportion of noncitizens in the total U.S. population.
DHS operates four programs designed in whole or in part to target criminal aliens: the Criminal Alien Program (CAP), Secure Communities, the § 287(g) program, and the National Fugitive Operations Program (NFOP). The CAP, Secure Communities, and certain § 287(g) programs are jail enforcement programs that screen individuals for immigration-related violations as they are being booked into jail and while they are incarcerated; the NFOP and some other § 287(g) programs are task force programs that target at-large criminal aliens. This report describes how these programs work and identifies their common features and key differences among them. While consensus exists on the overarching goal to identify and remove serious criminal aliens, these programs have generated controversy, particularly Secure Communities and the § 287(g) program. On one hand, the Obama Administration and other supporters of jail enforcement programs see them as efficient and even-handed ways to identify criminal aliens. The Administration has taken steps to strengthen and expand Secure Communities and plans to implement the program in every law enforcement jurisdiction in the country by 2013. On the other hand, some lawmakers and advocacy groups have raised concerns that Secure Communities and the § 287(g) program have not been narrowly targeted at serious criminal offenders and that the programs may have adverse impacts on police-community relations, may result in racial profiling, and may result in the detention of people who have not been convicted of criminal offenses and may not be subject to removal.
Disagreements about the merits of jail enforcement programs overlap with a separate set of questions about the role of states and localities in immigration enforcement. These jurisdictional questions have focused in particular on Secure Communities, in part because the Administration initially appeared to present it as a discretionary program but now takes the position that states and localities may not “opt out” of Secure Communities.
Contents
Introduction... 1
Defining “Criminal Aliens” ... 2
Quantifying the Criminal Alien Population ... 4
Federal-Level Arrest Data ... 4
Federal, State, and Local Incarceration Data... 6
Estimates from the American Community Survey ... 8
Other Estimates of the Criminal Alien Population ... 9
History of Criminal Alien Removal Programs... 11
ICE Programs Targeting Criminal Aliens ... 12
Jail Enforcement Programs... 14
Criminal Alien Program (CAP)... 14
Secure Communities ... 15
§ 287(g) Jail Screening Program... 15
Task Force Programs ... 16
§ 287(g) Task Force Program... 16
National Fugitive Operations Program... 16
Differences Among Criminal Alien Enforcement Programs ... 17
DHS Enforcement Priorities and Discretion... 19
March 2011 ICE Guidance Memo... 19
June 2011 ICE Guidance Memo... 20
August 2011 DHS Announcement... 21
Recent Appropriations ... 22
Enforcement Statistics ... 23
Controversies Surrounding Interior Enforcement Programs ... 26
The Rationale Behind Secure Communities and the § 287(g) Program... 26
Concerns About Secure Communities and Other ICE Programs ... 29
Can Jurisdictions “Opt Out” of Secure Communities?... 35
ICE Has Taken Steps to Address Concerns About Secure Communities and the § 287(g) Program... 36
Legislative Issues... 37
The Role of State and Local Law Enforcement Agencies in Immigration Enforcement ... 38
Prosecutorial Discretion ... 38
Data on Racial Profiling ... 39
Immigration Detainers... 39
Conclusion ... 40
Figures
Figure 1. Criminal and Unauthorized Aliens ... 3Figure 2. Federal Arrests by Citizenship Status and Type of Offense, 2001-2009 ... 5
Figure 3. Proportion of the U.S. and Incarcerated Population by Nativity and Citizenship, 2001-2009... 11
Figure 4. ICE Enforcement and Removal Programs in the Criminal Justice Process ... 13
Tables
Table 1. Persons Arrested for Federal Offenses, by Legal Status, 2001, 2005, and 2009... 4Table 2. Total and Noncitizen Incarcerated Population, Federal and State Prisons and Local Jails, 2001-2009... 7
Table 3. Offense Category of Sentenced Offenders, by Citizenship, 2001-2009 ... 8
Table 4. ICE’s Primary Criminal Alien Enforcement Programs... 18
Table 5. Appropriations for Programs Targeting Criminal Aliens, FY2004-FY2011... 22
Table 6. Primary Interior Enforcement Actions, by Program, FY2004-FY2011... 24
Table 7. Ratio of Appropriations to Enforcement Actions, by Program, FY2004-FY2011... 25
Table 8. Arrests Under Secure Communities and § 287(g), by Type of Offense, FY2006-FY2011 ... 31
Appendixes
Appendix A. Glossary of Terms... 41Appendix B. Data on Arrests and Incarceration of the Criminal Alien Population ... 42
Contacts
Author Contact Information... 45Introduction
Congress has a long-standing interest in the criminal alien population and has supported efforts since the late 1980s to identify, detain, and remove these individuals. DHS operates four key programs to address this population. The Criminal Alien Program (CAP) is a screening program that identifies, detains, and initiates removal proceedings against criminal aliens, including within federal, state, and local prisons and jails. Secure Communities is an information sharing program between the Departments of Justice and Homeland Security that screens for removable aliens as people are being booked into jails. Agreements entered into pursuant to INA § 287(g) (“§ 287(g) agreements”) allow DHS to delegate certain immigration enforcement functions to specially trained state and local law enforcement officers, under federal supervision. The National Fugitive Operations Program (NFOP) pursues known at-large criminal aliens and fugitive aliens.
Funding for programs targeting criminal aliens has expanded considerably since FY2005, as has the number of aliens arrested through them. Congress appropriated a total of about $690 million for these four programs in FY2011, up from $23 million in FY2004. At the same time, the
number of aliens arrested through programs targeting criminal aliens increased from about 11,000 to over 289,000.
While Congress has targeted funding for the removal of criminal aliens, the majority of
unauthorized aliens in the United States have not been convicted of a crime. Some have criticized programs designed to remove criminal aliens because these programs have also identified
removable aliens who have no criminal record or have committed only nonviolent crimes. Others note, however, that all removable aliens have violated U.S. law.
Partly for these reasons, the continued growth of programs targeting criminal aliens raises a number of potential issues for Congress, including questions about whether and how the Department of Homeland Security (DHS) should exercise prosecutorial discretion in executing such programs, the role of state and local law enforcement agencies in immigration enforcement and whether they can “opt out” of certain federal enforcement programs, whether Congress should take steps to guard against racial profiling and other adverse consequences that may be associated with programs targeting criminal aliens, and possible legislation governing DHS’s use of immigration detainers to request that state and local law enforcement agencies hold immigrants until they can be placed in removal proceedings.
This report begins by defining and quantifying the criminal alien population, to the extent possible. The following sections describe current and historical programs designed in whole or in part to target this population, including CAP, Secure Communities, the § 287(g) program, and NFOP. After describing how these programs function and key differences among them, the report reviews their recent appropriations history and enforcement statistics.
The final sections of the report describe the controversies surrounding certain programs targeting criminal aliens—particularly the Secure Communities program and the § 287(g) program—and legislative issues that may arise as a result. On one hand, these programs are seen as highly efficient and even-handed ways to identify criminal aliens who may be removable, and DHS has taken steps to strengthen and expand Secure Communities and other enforcement programs based within jails and prisons. On the other hand, critics of Secure Communities and related programs have argued that the programs are not sufficiently focused on serious criminal aliens, and that they may damage police-community relations, may result in racial profiling, and may result in the
wrongful incarceration of people who have not been convicted of criminal offenses. These concerns have contributed to a separate set of questions about whether or not states and localities may refuse to participate in DHS’s jail enforcement efforts.
Defining “Criminal Aliens”
For over a century, U.S. immigration law has identified certain crimes that make an alien ineligible for admission to the United States and/or subject to deportation.1 Such crimes include
crimes of “moral turpitude,” crimes involving controlled substances, certain firearm offenses, and crimes related to espionage, sabotage, and related offenses.2 Yet the term “criminal alien” is not
specifically defined in immigration law or regulation, and people use it to refer to several different types of noncitizen offenders.3 At the broadest level, a “criminal alien” is any
noncitizen who has ever been convicted of a crime in the United States. This report adopts this broad definition unless otherwise noted. See Appendix A for a glossary of additional terms related to the criminal alien population.
Not all criminal aliens are unauthorized or removable, and some removable aliens are not criminals (see Figure 1).4 Three groups of criminal aliens can be distinguished. First, the set of
all criminal aliens includes both unauthorized aliens,5 all of whom are potentially removable, and
legal aliens,6 who may or may not be removable depending on specific crimes committed.
Second, a subset of criminal aliensconvicted of removable criminal offenses are subject to removal under the INA even if they are otherwise legally present.7 For example, a legal
1 The Immigration Act of 1917 (P.L. 64-301) and subsequent legislation made certain inadmissible aliens subject to
“exclusion” and certain aliens within the United States subject to “deportation.” Pursuant to §§ 301-309 of the Illegal Immigration Reform and Immigrant Responsibility Act of 1996 (IIRIRA, P.L. 104-208, Div. C), deportation and exclusion proceedings were combined into a unified “removal” proceeding. This report uses “deportation” to refer to such enforcement prior to the 1997 implementation of IIRIRA and “removal” to refer to such enforcement since 1997.
2 Whether a crime involves moral turpitude has been determined by judicial and administrative case law rather than a
statutory definition. In general, if a crime manifests an element of baseness or depravity under current mores it involves moral turpitude. See CRS Report RL32480, Immigration Consequences of Criminal Activity, by Michael John Garcia.
3 Noncitizens include permanent immigrants (i.e., aliens admitted as legal permanent residents (LPRs), or “green card”
holders), legal nonimmigrants (i.e., aliens admitted on temporary visas), and unauthorized aliens (i.e., aliens who enter without an inspection or overstay a temporary visa).
4 Estimates of the unauthorized resident alien population in the United States range from 10.8 to 11.2 million in 2010;
see CRS Report RL33874, Unauthorized Aliens Residing in the United States: Estimates Since 1986, by Ruth Ellen Wasem. By comparison, the CRS estimate of the criminal alien population in jails and prisons computed in this report was 173,000 in 2009; see “Quantifying the Criminal Alien Population.” Nationally, incarcerated persons represent roughly one-third of the total correctional population, with persons on probation and parole comprising the other two-thirds; see footnote 39. Assuming the same ratio applies to foreign-born criminals, the estimated total foreign-born correctional population would be 519,000. This estimate includes legal and unauthorized immigrants, and does not include aliens previously convicted of crimes who have already completed their criminal sentences. Also see “Other Estimates of the Criminal Alien Population.”
5 Unauthorized aliens are foreign nationals who have entered the United States without inspection or with fraudulent
documents, or who overstayed a nonimmigrant visa.
6 Legal aliens include immigrants who are aliens admitted as legal permanent residents (LPRs) and nonimmigrants who
are aliens admitted on temporary visas, including tourists, temporary workers, and foreign students.
7 Section 237(a)(2) of the Immigration and Nationality Act (8 U.S.C. § 1227 (a)(2)) enumerates a list of criminal
offenses that make aliens subject to removal. Criminal offenses in the context of immigration law cover violations of federal, state, or, in some cases, foreign criminal law. See CRS Report RL32480, Immigration Consequences of Criminal Activity, by Michael John Garcia.
permanent resident (LPR) convicted of public intoxication is not subject to removal, but an LPR convicted of cocaine possession is subject to removal.8 Third, a subset of these removable criminal aliens, aggravated felons,9 are also ineligible for most forms of relief from removal and
ineligible to be readmitted to the United States.10
Figure 1. Criminal and Unauthorized Aliens
Source: CRS analysis of the Immigration and Nationality Act.
Notes: Figure 1 is roughly to scale and illustrates that there are more unauthorized aliens than criminal aliens. Given current data constraints, CRS is unable to approximate what share of criminal aliens is unauthorized. All aliens in areas with hash lines are subject to removal.
As Figure 1 illustrates, all unauthorized aliens are potentially removable, indicated by cross-hatches in the figure, but the majority of them have not been convicted of a crime and are therefore not classified as criminal aliens.11 (Unlawful presence in the United States absent
additional factors is a civil violation, not a criminal offense.12) The smaller circles in Figure 1
8 8 U.S.C. § 1227(a)(2)(B)(i).
9 Aggravated felonies refer to a class of serious criminal alien offenses created per § 101(a)(43) of the INA and include
murder, drug trafficking, or illegal trafficking in firearms or destructive devices. Subsequent measures passed by Congress expanded the definition of aggravated felonies and created additional criminal grounds for removal.
10 For a more exhaustive discussion, see CRS Report RL32480, Immigration Consequences of Criminal Activity, by
Michael John Garcia.
11 See footnote 4.
12 Unlawful presence is only a criminal offense when an alien is found in the United States after having been formally
removed or after departing the U.S. while a removal order was outstanding; see CRS Report RL32480, Immigration Consequences of Criminal Activity, by Michael John Garcia.
illustrate that some criminal aliens are removable on the basis of the specific crimes committed, and some are also unauthorized.
Quantifying the Criminal Alien Population
This section presents publicly available arrest and incarceration data for criminal aliens at the federal, state, and local levels from 2001 through 2009.13 Following CRS’s quantification of the
criminal alien population, the section reviews other studies that produced comparable estimates.
Appendix B describes related data issues in greater detail.
Federal-Level Arrest Data
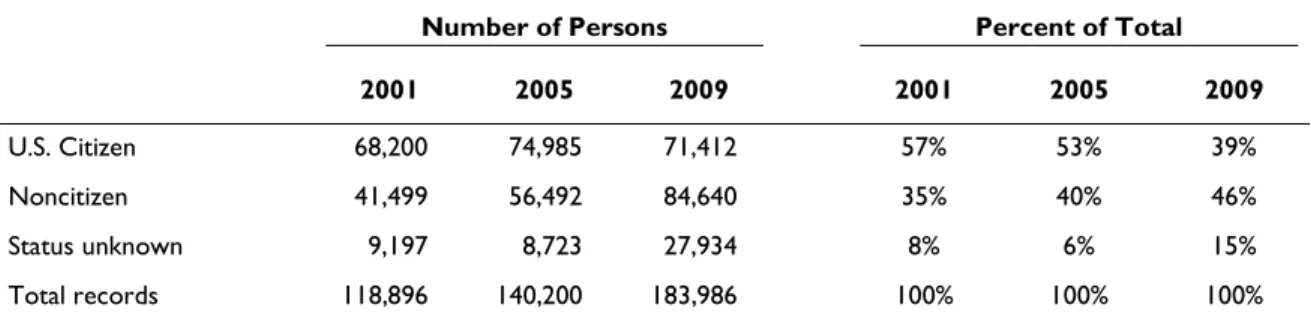
Table 1 presents data from the Department of Justice (DOJ), Bureau of Justice Statistics (BJS) on the number and percentage of persons arrested for federal offenses, by citizenship status, for 2001, 2005, and 2009. Of the 183,986 persons arrested for federal offenses in 2009, 46% were not U.S. citizens and 15% had unknown citizenship status. The data in Table 1 also indicate that the proportion of noncitizens arrested for federal offenses increased across the period analyzed.
Table 1. Persons Arrested for Federal Offenses, by Legal Status, 2001, 2005, and 2009
Number of Persons Percent of Total
2001 2005 2009 2001 2005 2009
U.S. Citizen 68,200 74,985 71,412 57% 53% 39%
Noncitizen 41,499 56,492 84,640 35% 40% 46%
Status unknown 9,197 8,723 27,934 8% 6% 15%
Total records 118,896 140,200 183,986 100% 100% 100%
Source: Bureau of Justice Statistics, Federal Justice Statistics Program website, http://bjs.ojp.usdoj.gov/fjsrc/. Notes: Data do not distinguish between legal noncitizens such as LPRs and unauthorized aliens.
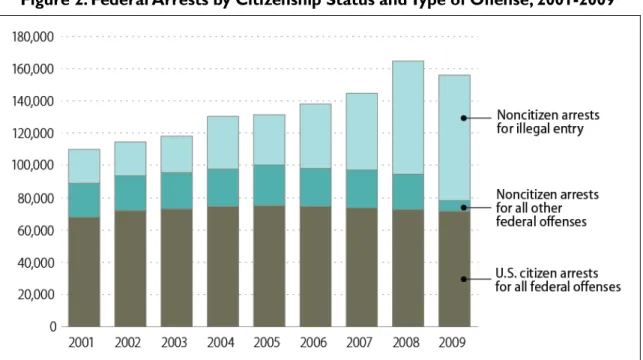
Most noncitizen federal arrests between 2001 and 2009 were for illegal entry. As Figure 2
illustrates, while federal arrests with known citizenship information increased 42%, from 109,699 to 156,052, during this period, noncitizen arrests for illegal entry—which increased noticeably after 2003—accounted for virtually all of this increase.14 Noncitizen arrests for all other federal
offenses accounted for a declining share of all federal arrests, from 19% in 2001 to 4% in 2009.15
The growth of illegal entry cases caused arrests of U.S. citizens to account for a declining share of all federal arrests (from 62% in 2001 to 46% in 2009) even as the total number of U.S. citizens arrested on federal charges increased during this period (from 68,200 in 2001 to 71,412 in 2009).
13 Individuals housed by Immigration and Customs Enforcement (ICE) are beyond the scope of this report because they
are not officially part of the U.S. criminal justice system. This report also does not present data on convictions.
14 Because Figure 2 does not include “status unknown” cases, figures cited in this section of the text differ from figures
presented in Table 1.
15 According to BJS analysts, the transition by the U.S. Marshall Service to a new prisoner tracking system beginning
These trends may reflect changes in enforcement and prosecution policies rather than increased noncitizen criminality. The number of Border Patrol apprehensions has always far exceeded the number of arrests for illegal entry,16 and DHS and DOJ have adopted policies to seek criminal
charges against a higher proportion of such aliens, particularly since 2005 through Operation Streamline and related programs.17 Increased Border Patrol appropriations during this period may
also have resulted in a higher proportion of illegal border crossers being apprehended, and thus a relatively larger pool of aliens who may be charged with illegal entry, even though the total number of apprehensions fell during this period.18
Figure 2. Federal Arrests by Citizenship Status and Type of Offense, 2001-2009
Source: Prisoner Tracking System, U.S. Marshall Service, as reported to the Bureau of Justice Statistics, Federal Justice Statistics Program website, http://bjs.ojp.usdoj.gov/fjsrc/.
Notes: Data presented are only for cases with known citizenship status. Changes in recording procedures in 2008 resulted in a disproportionately high number of cases with missing information in 2009. Data do not distinguish between legally present noncitizens, such as legal permanent residents, and the unauthorized alien population. Although persons arrested may have committed more than one federal offense, only the most severe offense is presented by the Bureau of Justice Statistics.
16 According to CRS’s analysis of DHS data, the Border Patrol apprehended an average of 972,000 removable aliens
per year during these years, most of whom could be charged with illegal entry, though this figure (like BJS arrest data) includes multiple observations of the same individuals; see Office of Immigration Statistics, Yearbook of Immigration Statistics FY2010, Washington, DC, 2011, p. 93.
17 Operation Streamline is a joint DOJ-DHS program to expedite criminal processing for unauthorized aliens in certain
border districts so that a higher proportion face criminal charges; see U.S. Customs and Border Protection, “DHS Launches ‘Operation Streamline II,’” press release, December 16, 2005, http://www.cbp.gov/xp/cgov/newsroom/ news_releases/archives/2005_press_releases/122005/12162005.xml.
18 Appropriations for the Border Patrol increased by 191%, from $1.1 billion in FY2000 to $3.5 billion in FY2009. The
20,202 CBP agents as of November 2009 represented a more than doubling of staff over that decade; see CRS Report R40642, Homeland Security Department: FY2010 Appropriations, coordinated by Jennifer E. Lake. Increased border enforcement also may have a deterrent effect on would-be border crossers.
Federal, State, and Local Incarceration Data
Incarceration represents a second measure of the criminal alien population. Table 2 presents CRS tabulations of the total citizen and noncitizen prison and jail populations publicly reported by the Bureau of Justice Statistics for 2001 through 2009. Estimates of state and, especially, local incarcerated populations should be interpreted with caution for the reasons noted in Appendix B. As of June 30, 2009, however, a total of 2,384,912 prisoners (U.S. citizens and noncitizens) were incarcerated: 206,577 in federal prisons, 1,410,901 in state prisons, and 767,434 in local jails (Table 2).19 Of this total, 172,766 were noncitizens, including 48,740 in federal prisons, 64,053 in
state prisons, and 59,973 in local jails.
Thus, according to BJS data presented in Table 2, noncitizens comprised 7.2% of the combined federal, state, and local prisoner population in 2009, including 23.6% of the federal prison population, 4.5% of the state prison population, and 7.8% of the local jail population. As a basis for comparison, noncitizens comprised 7.1% of the U.S. population in FY2009.20
The overall noncitizen proportion of the total prisoner population increased from 6.4% in 2001, with most of the change reflecting the growth of the noncitizen population in local jails. Indeed, the noncitizen proportion of federal prisoners actually declined between 2001 and 2009 (from 25.2% to 23.6%), as total federal incarcerations increased at a faster rate than noncitizen federal incarcerations.21 The noncitizens proportion of state prisoners increased slightly, growing from
4.3% of the total state-level incarcerated population in 2001 to 4.5% in 2009.22 And the
proportion of noncitizens among those incarcerated in local jails increased substantially, from 6.1% in 2001 to 7.8% in 2009, as the growth rate of noncitizens in local jails far exceeded the native-born growth rate in such institutions.23
19 All incarcerations for 2009 are as of midyear. See notes to Table 2. 20 CRS analysis of 2008 American Community Survey data.
21 Noncitizen federal incarcerations increased 33.1% (from 36,625 to 48,740) between 2001 and 2009, as total federal
incarcerations increased 42.1% (from 145,416 to 206,577); see Table 2.
22 Noncitizen state incarcerations increased 19.5% (from 54,031 to 64,053) between 2001 and 2009, as total state
incarcerations increased 13.1% (from 1.2 million to 1.4 million); see Table 2.
23 Noncitizen local jail incarcerations increased 55.5% (from 38,558 to 59,973) as total local jail incarcerations
Table 2. Total and Noncitizen Incarcerated Population, Federal and State Prisons and Local Jails, 2001-2009
Total Incarcerated Population Noncitizen Incarcerated Population Proportion of Noncitizen to Total Incarcerated Population Total Federal Prisons Prisons State Local Jails Total Federal Prisons Prisons State Local Jails Total Federal Prisons Prisons State Local Jails 2001 2,022,501 145,416 1,245,845 631,240 129,214 36,625 54,031 38,558 6.4% 25.2% 4.3% 6.1% 2002 2,069,507 156,993 1,247,039 665,475 140,772 38,927 54,804 47,041 6.8% 24.8% 4.4% 7.1% 2003 2,131,445 163,528 1,276,616 691,301 141,253 40,051 56,112 45,090 6.6% 24.5% 4.4% 6.5% 2004 2,182,591 173,059 1,295,542 713,990 147,481 42,232 57,393 47,856 6.8% 24.4% 4.4% 6.7% 2005 2,244,629 180,328 1,316,772 747,529 142,170 42,803 55,804 43,563 6.3% 23.7% 4.2% 5.8% 2006 2,293,748 187,618 1,340,311 765,819 155,315 44,323 57,352 53,640 6.8% 23.6% 4.3% 7.0% 2007 2,350,119 193,046 1,376,899 780,174 160,583 44,734 55,766 60,083 6.8% 23.2% 4.1% 7.7% 2008 2,383,778 199,618 1,398,627 785,533 163,774 45,756 64,687 53,331 6.9% 22.9% 4.6% 6.8% 2009 2,384,912 206,577 1,410,901 767,434 172,766 48,740 64,053 59,973 7.2% 23.6% 4.5% 7.8%
Sources: Total federal and state prison population figures: BJS, Prison Inmates at Midyear 2009-Statistical Tables report, Table 1; Noncitizen federal prison figures: BJS Federal Criminal Case Processing Statistics online, http://bjs.ojp.usdoj.gov/fjsrc/; Noncitizen state prison figures: BJS National Prison Statistics (NPS) program reported in Sourcebook of Criminal Justice Statistics, 2009, Table 6.42.2009; Total local jail figures: BJS Jail Inmates at Midyear 2010-Statistical Tables report, Table 1. Local jails’ number of noncitizens are derived by CRS from data on the proportion of noncitizens to total number of inmates presented in the Jail Inmates at Midyear 2007 report online, http://bjs.ojp.usdoj.gov/content/pub/pdf/jim07.pdf, for 2001 through 2007 and computed by CRS using the Annual Survey of Jails microdata files downloaded from ICPSR’s website, http://www.icpsr.org, for 2008 and 2009.
Notes: Federal and state total prison population figures and federal noncitizen population figures are measures of the incarcerated population as of December 31 of each year—except for 2009, which are measures of the incarcerated population as of June 30. They include inmates under jurisdiction of federal or state prisons or in the custody of federal or state prisons or local jails. (Jurisdiction refers to prisoners under the legal authority of state and federal correctional officials, regardless of where a prisoner is held. Custody refers to the number of inmates held in state or federal prisons or local jails, regardless of sentence length or the authority having jurisdiction.) State noncitizen prison and local jail population figures are measures of the incarcerated population as of June 30 for each year. Because total counts of noncitizens in local jails are not available for many reporting local jurisdictions, CRS imputed the noncitizen local jail figures by multiplying the total local jails figures by the percentages of noncitizens in local jails obtained from the Annual Survey of Jails (noted in sources above). In 2008, the difference between mid-year and end-year figures at both the federal and state levels was less than 0.1%.
Table 3 illustrates the types of crimes for which apprehended criminals were sentenced to federal prison in 2001, 2005, and 2009. It presents data from the U.S. Sentencing Commission by citizenship status and grouped into three categories: violent crimes, nonviolent crimes, and immigration crimes. The data indicate that for all three years shown, violent crimes made up less than 1% of all crimes committed by criminal aliens, compared to 5%-6% of all crimes committed by citizens. For noncitizens, immigration crimes grew as a proportion of total federal offenses for which they received sentences, increasing from 47.3% of all crimes in 2001 to 68.2% by 2009. For citizens, by contrast, immigration crimes made up less than 5% of all crimes for citizens in any of the three years shown. Moreover, the citizen proportion of crime categories changed relatively little over the three years shown.
Table 3. Offense Category of Sentenced Offenders, by Citizenship, 2001-2009
2001 2005 2009
Citizen Noncitizen Citizen Noncitizen Citizen Noncitizen
Violent crimes 6.3% 0.5% 5.4% 0.5% 5.0% 0.4%
Nonviolent crimes 91.2% 52.2% 90.6% 39.4% 90.9% 31.4%
Immigration crimes 2.6% 47.3% 4.1% 60.1% 4.0% 68.2%
Total 100% 100% 100% 100% 100.0% 100.0%
Source: CRS analysis of data from the 2001, 2005, and 2009 Sourcebook of Federal Sentencing Statistics, Table 9, United States Sentencing Commission.
Notes: Violent crimes include murder, manslaughter, kidnapping, sexual abuse, assault, robbery, and arson. Immigration crimes include alien smuggling, unlawful entering or remaining in the United States, trafficking in immigration documents or making false or fraudulent immigration statements, and acquiring fraudulent immigration documents. Nonviolent crimes refer to all other offenses.
Estimates from the American Community Survey
The American Community Survey (ACS) represents an additional source of information that can be used to corroborate CRS’s computations of the criminal alien population. The ACS is
conducted continuously and yields annual estimates on the size and characteristics of the U.S. population, including a measurement of persons living in institutions, or “group quarters,” which includes correctional facilities as well as juvenile facilities, nursing facilities, and other health care facilities.24 Although the ACS Public Use Microdata Sample does not distinguish among these various types of institutions, it can be used to derive an estimate of the criminal alien population by selecting characteristics of persons within the institutionalized population that would be most likely to indicate such persons were inmates incarcerated in correctional facilities rather than patients living in health care facilities. These characteristics include persons ages 18 to 55, living in group quarters, who were noncitizens.25
24 The annual ACS sample is approximately 3 million addresses, and data are collected from roughly one-twelfth of the
sample each month. The survey is mandatory, and interviews are conducted via mail, telephone, or personal visits.
25 This estimate relies on parameters derived from a recent U.S. Census analysis; see Stephanie Ewert and Tara
Wildhagen, Educational Characteristics of Prisoners: Data from the ACS, U.S. Census Bureau, Housing and Household Economic Statistics Division, SEHSD Working Paper #2011-8, Washington, DC, March 31, 2011. According to Ewert and Wildhagen, correctional facilities accounted for 93% of persons ages 18-55 living in such (continued...)
According to these data, 2,271,036 persons were living in group quarters in 2009, most of which consisted of correctional facilities. This figure closely matches the 2,284,913 figure produced by the Bureau of Justice Statistics for the same year.26 Of this estimated criminal population, the
analysis of ACS data yields an estimate for the noncitizen incarcerated population (between ages 18-55) of 161,960, or 7.13% of the total—an estimate comparable to CRS’s overall figure of 172,766 (Table 2). ACS data do not distinguish between federal, state, or local institutions.
Other Estimates of the Criminal Alien Population
While relatively few studies have attempted to quantify the criminal alien population,27 a body of
evidence suggests that the foreign born are less likely to commit crimes28 and less likely to be
incarcerated than the native born.29 For instance, a 2007 study estimated that the foreign born
(including noncitizens and naturalized citizens) made up 35% of California’s adult population but only 17% of its adult prison population.30 When the analysis expands to include all correctional
institutions (not only prisons but also jails, halfway houses, and similar facilities) and to focus on the sub-population most likely to commit crimes (males between ages 18-40) the difference increases, with native-born institutionalization rates 10 times those of the foreign born.31
While these studies confront methodological challenges similar to those discussed in Appendix B, they suggest that the noncitizen proportion among all U.S. criminals (i.e., the criminal alien population) likely is no more than—and possibly is below—the foreign-born proportion of the total U.S. population, or 12.6% as of 2009. This rate would suggest an upper bound estimate for the incarcerated criminal alien population of 300,500, based on a total incarcerated population of 2,384,912 (from Table 2).
(...continued)
group quarters.
26 U.S. Department of Justice, Bureau of Justice Statistics, Sourcebook of Criminal Justice Statistics Online,
Washington, DC 2010, http://www.albany.edu/sourcebook/pdf/t612009.pdf..
27 See, for example, John Scalia and Marika F. X. Litras, Immigration Offenders in the Federal Criminal Justice System, 2000, Bureau of Justice Statistics, Washington, DC, August 2002; A. Wunder, “Foreign Inmates in U.S. Prisons: An Unknown Population,” Corrections Compendium, vol. 20, no. 4 (April 1995), pp. 4-18. Foreign born here refers to both noncitizens and naturalized citizens
28 See, for example, Kristin F. Butcher and Anne Morrison Piehl, “Cross-City Evidence on the Relationship Between
Immigration and Crime,” Journal of Policy Analysis and Management, vol. 17, no. 3 (Summer 1998), pp. 457-493; John Hagan and Alberto Palloni, “Sociological Criminology and the Mythology of Hispanic Immigration and Crime,”
Social Problems, vol. 46, no. 4 (1999), pp. 617-632; Lesley Williams Reid, Harald E. Weiss, and Robert M. Adelman, et al., “The Immigration–Crime Relationship: Evidence Across U.S. Metropolitan Areas,” Social Science Research, vol. 34, no. 4 (December 2005), pp. 757-780 .
29 See, for example, Ruben G. Rumbaut, Roberto G. Gonzales, and Golnaz Komaie, et al., “Immigration and
Incarceration: Patterns and Predictors of Imprisonment among First-and Second-Generation Young Adults,” in
Immigration and Crime: Race, Ethnicity and Violence, ed. Ramiro Martinez Jr. and Abel Valenzuela Jr. (New York: New York University Press, 2006), pp. 64-89; and Kristin F. Butcher and Anne Morrison Piehl, Why Are Immigrants’ Incarceration Rates so Low? Evidence on Selective Immigration, Deterrence, and Deportation, National Bureau of Economic Research, NBER Working Paper 13229, Cambridge, MA, July 2007, http://www.nber.org/papers/w13229.
30 Kristin F. Butcher, Anne Morrison Piehl, and Jay Liao, Crime, Corrections, and California: What Does Immigration Have to Do with It?, California Counts: Population Trends and Profiles, San Francisco, CA, February 2008,
http://www.ppic.org/content/pubs/cacounts/CC_208KBCC.pdf.
The Government Accountability Office (GAO) recently enumerated the U.S. criminal alien population in federal prisons and criminal alien incarcerations for state prisons and local jails.32 To enumerate the federal prison population, GAO used Bureau of Prison (BOP) data, which are considered relatively reliable and are collected consistently.33 To undertake the more challenging task of enumerating the criminal alien population in state prisons and local jails, GAO relied on data from the Department of Justice’s State Criminal Alien Assistance Program (SCAAP).34 SCAAP data provide a direct count of cases for which state and local jurisdictions seek reimbursement for correctional officer salary costs incurred for incarcerating “undocumented criminal aliens”and thus provide an alternative method for estimating the criminal alien population to that presented by CRS above. However, because of the way SCAAP data are recorded, they do not accurately reflect the incarcerated criminal alien population at a given point in time.35 Based on these sources, GAO reported 52,929 criminal aliens in federal prisons, and
91,823 state prison and 204,136 local jail SCAAP incarcerations.36
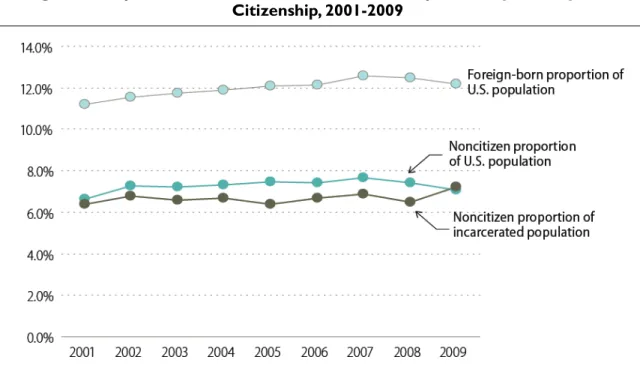
Incarceration of the criminal alien population over the past decade has occurred within the context of a foreign-born population that grew from 31.5 million to 36.8 million between 2001 and 2009.37 While their 2009 proportion of the U.S. population amounted to 12.2%, the foreign
born accounted for 26.4% of all U.S. population growth from 2001 to 2009 because their numbers grew more rapidly than those of the native born.38Figure 3 illustrates this demographic context
32 U.S. Government Accountability Office, Criminal Alien Statistics: Information on Incarcerations, Arrests, and Costs, GAO-11-187, March 24, 2011. Note that “the U.S. criminal alien population” refers to unique individuals, while “criminal alien incarcerations” refers to unique incarcerations that may involve the same individuals being incarcerated multiple times. In addition, the Senate Appropriations Committee reported in 2009 that “ICE extrapolated from various sources and estimated that there are about 300,000 to 450,000 criminal aliens, who are available for removal, detained each year at Federal, State, and local prisons and jails,” though the Committee report does not explain the methodology behind this estimate; see U.S. Congress, Senate Committee on Appropriations, Subcommittee on Department of Homeland Security, Department of Homeland Security Appropriations Bill, 2009, Report to accompany S. 3181, 110th
Cong., 2nd sess., June 23, 2008, S.Rept. 110-396 (Washington: GPO, 2008), p. 49. 33 See Appendix B for more information on the presentation of publicly available data.
34 SCAAP reimburses states and localities for correctional officer salary costs incurred for incarcerating
“undocumented criminal aliens” under certain circumstances. For more information on SCAAP, see CRS Report RL33431, Immigration: Frequently Asked Questions on the State Criminal Alien Assistance Program (SCAAP), by Karma Ester. Also see GAO, Criminal Alien Statistics.
35 SCAAP data may not be representative of the U.S. criminal alien population for at least three reasons. First,
reimbursement rules prevent SCAAP data from accurately capturing certain groups of individuals, including legal permanent residents, persons jailed for less than four days, and persons with only one misdemeanor. Second, not all states and eligible localities participate in the program equally. Those with higher costs, such as metropolitan jurisdictions that process large numbers of unauthorized aliens are more likely to do so than smaller localities. Third, individuals may be double-counted because they may appear in more than one jurisdiction if they are processed in several places for the same offense, for instance in a local jail and a state prison, or in different states. Such double counting may explain the sizable differences in the state and local criminal alien SCAAP incarcerations reported by GAO and the number of criminal aliens incarcerated in state prisons and local jails produced in this report, which relies exclusively on BJS data. In addition to the 2011 GAO report cited above, see also U.S. Government Accountability Office (GAO), Information on Criminal Aliens Incarcerated in Federal and State Prisons and Local Jails, GAO-05-337R, Apr. 7, 2005.
36 U.S. Government Accountability Office, Criminal Alien Statistics: Information on Incarcerations, Arrests, and Costs, GAO-11-187, March 24, 2011.
37 To obtain a consistent series across individual years for Figure 3 and corresponding text, CRS used figures obtained
from the Statistical Abstract of the United States, a reference guide published by the U.S. Census Bureau. Such figures were computed by the Census Bureau using the Current Population Survey (CPS) which produces estimates of the foreign born that are lower than those from the ACS. For instance, the ACS estimate of the foreign-born population for 2009 was 38.5 million.
38 Moreover, these figures do not include an estimated 13.9 million native-born children born to at least one
for the criminal alien population growth (shown in Table 2) and the close correspondence between CRS’s calculation of the proportion of noncitizens in the total prison population and the foreign-born population overall. Such trends receive empirical support from academic studies reviewed above and from the ACS.
Figure 3. Proportion of the U.S. and Incarcerated Population by Nativity and Citizenship, 2001-2009
Source: Total foreign born, noncitizen foreign born, and U.S. population figures: U.S. Census Bureau, Statistical Abstract of the United States (various years); Noncitizen proportion of incarcerated population, see Table 2. Nationally, incarcerated persons represent roughly one-third of the total correctional population, with persons on probation and parole comprising the other two-thirds.39 As with all persons in the
correction population, the relatively larger pool of noncitizens initially interacting with the criminal justice system is filtered down to a smaller population whose crimes are judged to merit prosecution and incarceration.
History of Criminal Alien Removal Programs
In 1986, with passage of the Immigration Reform and Control Act (P.L. 99-603), Congress made deporting aliens who had been convicted of certain crimes an enforcement priority. The law required the Attorney General “In the case of an alien who is convicted of an offense which
(...continued)
born parent. See CRS Report R41592, The U.S. Foreign-Born Population: Trends and Selected Characteristics, by William A. Kandel, pp. 14-16.
39 In 2009, the total year-end correctional population numbered 7,225,800, with 4,203,967 persons on probation,
2,284,913 persons incarcerated, and 819,308 persons on parole. See Sourcebook of Criminal Justice Statistics Online, Table 6.1.2009, http://www.albany.edu/sourcebook/pdf/t612009.pdf.
makes the alien subject to deportation … [to] begin any deportation proceeding as expeditiously as possible after the date of the conviction.”40
The former Immigration and Naturalization Service (INS) established a pair of programs in 1988 to comply with this requirement: the Institutional Removal Program (IRP) and the Alien Criminal Apprehension Program (ACAP).41 The programs forged partnerships with corrections facilities to
identify deportable aliens convicted of crimes before their release from jail or prison. They also worked with the Department of Justice Executive Office for Immigration Review to initiate deportation proceedings against aliens serving sentences for deportable offenses during their period of incarceration.42
The IRP and ACAP focused initially on aggravated felons, a class of serious criminal aliens created in immigration law by the Anti-Drug Abuse Act of 1988 (P.L. 100-690) and enumerated in § 101(a)(43) of the INA. The Anti-Drug Abuse Act defined aggravated felonies to include aliens convicted of murder, drug trafficking, or illegal trafficking in firearms or destructive devices. Between 1990 and 1996, Congress enacted a series of measures, including the Illegal Immigrant Reform and Immigrant Responsibility Act of 1996 (P.L. 104-208, Division C), that expanded the definition of aggravated felons and created additional criminal grounds for removal.43 The mandates of the IRP and ACAP likewise expanded to include this broader list of
criminal immigration offenses.
In 1999, the INS issued an Interior Enforcement Strategy, which named as the agency’s top interior enforcement priority the identification and removal of criminal aliens and the
minimization of recidivism (i.e., illegal reentry by previously removed aliens).44 Accordingly,
between 1998 and 2002, the INS devoted more resources to the removal of criminal aliens than to all other interior enforcement priorities combined.45 Nonetheless, INS failed to identify and
remove all criminal aliens.46
ICE Programs Targeting Criminal Aliens
In the wake of the September 11 attacks, the new Department of Homeland Security (DHS) focused its enforcement activities on suspected terrorists and homeland defense, but with the
40 P.L. 99-603, §701.
41 Prior to the enactment of the Homeland Security Act of 2002 (P.L. 107-296), immigration enforcement activities
were primarily the responsibility of the Immigration and Naturalization Service (INS) within the Department of Justice. The INS was dissolved on March 1, 2003 and made part of the Department of Homeland Security (DHS).
42 The Institutional Removal Program, originally known as the Institutional Hearing Program, focused on a small
number of federal and state prisons that held the largest number of criminal aliens; the Alien Criminal Apprehension Program covered other jails and prisons.
43 Immigration Act of 1990, P.L. 101-649 (1990); Immigration and Nationality Technical Correction Act of 1994, P.L.
103-416 (1994); Antiterrorism and Effective Death Penalty Act of 1996, P.L. 104-132 (1996); Illegal Immigrant Reform and Immigrant Responsibility Act of 1996, P.L. 104-208, Div. C (1996). See CRS Report RL32480,
Immigration Consequences of Criminal Activity, by Michael John Garcia.
44 U.S. General Accounting Office, Homeland Security: Challenges to Implementing the Immigration Interior Enforcement Strategy, GAO-03-660T, April 2003.
45 Ibid.
46 CRS Report RL33351, Immigration Enforcement Within the United States, coordinated by Alison Siskin; GAO, Challenges to Implementing the Immigration Interior Enforcement Strategy.
continued growth of the foreign-born population after 2000, programs targeting criminal aliens also remained an enforcement priority. Within DHS, the IRP and ACAP initially were managed jointly by Immigration and Customs Enforcement’s (ICE) Detention and Removal Operations (DRO) (renamed Enforcement and Removal Operations (ERO) in 2010) and its Office of Homeland Security Investigations. Between 2005 and 2007, the IRP and ACAP were combined into a single program within DRO now known as the Criminal Alien Program.47 ICE currently operates four programs wholly or partly focused on criminal aliens (discussed in more detail below): the Criminal Alien Program (CAP), Secure Communities, the § 287(g) program, and the National Fugitive Operations Program (NFOP).
These programs operate at several different points in the criminal justice process, and in some cases at more than one point (Figure 4). The CAP, Secure Communities, and certain § 287(g) programs are “jail enforcement” programs that screen individuals for possible immigration violations and for criminal-related grounds for removal in federal and state prisons and local jails. Most individuals screened by jail enforcement program are arrested by state or local officers, not ICE agents, for reasons unrelated to immigration law.48
Figure 4. ICE Enforcement and Removal Programs in the Criminal Justice Process
Source: CRS analysis of ICE enforcement programs.
Notes:CAP refers to the Criminal Alien Program; NFOP refers to the National Fugitive Operations Program; 287(g) refers to agreements entered pursuant to INA § 287(g) for jailing screening or task force programs. NA indicates “not applicable.”
Jail enforcement programs conduct immigration-related screening at two main points (Figure 4). First, all three of ICE’s jail enforcement programs conduct screening as individuals are being booked into jail. The booking process occurs after an arrest but before an arrestee faces specific criminal charges and typically involves the creation of a biometric record (i.e., capturing
47 See U.S. Congress, Senate Committee on the Judiciary, Subcommittee on Immigration, Border Security, and
Citizenship, Strengthening Interior Enforcement: Deportation and Related Issues, testimony of Department of Homeland Security Acting Director of Detention and Removal Operations, U.S. Immigration and Customs Enforcement Victor Cerda, 109th Cong., 1st sess., April 14, 2005.
48 See U.S. Department of Homeland Security Advisory Council, “Task Force on Secure Communities Findings and
photographs and fingerprints). Second, CAP also conducts immigration-related screening later in the criminal justice processing, focusing on individuals who have been convicted of crimes and are incarcerated.
In addition to these jail enforcement programs, two ICE “task force” programs are wholly or partly targeted at criminal aliens outside of jails and prisons.49 ICE’s NFOP targets at-large
criminal aliens, including fugitive aliens who have not been convicted of a crime (i.e., prior to entering the criminal justice process) and aliens who have been convicted of crimes and
subsequently released from prison (i.e., at the end of the process; see Figure 4). Certain § 287(g) programs also include task forces, though most § 287(g) task forces are not primarily focused on criminal aliens, as discussed below. Compared to the jail enforcement programs, these task force programs arrest far fewer removable aliens, though they include a higher proportion of high-priority cases (see “Enforcement Statistics”).
Jail Enforcement Programs
Criminal Alien Program (CAP)
The Criminal Alien Program (CAP) is an umbrella program that includes several different systems for identifying, detaining, and initiating removal proceedings against criminal aliens within federal, state, and local prisons and jails. According to ICE, “CAP aims to identify all foreign born nationals incarcerated in jails and prisons in the United States” by interviewing aliens and screening their biographic information against DHS databases. CAP’s mission is to prevent the release of criminal aliens from jails and prisons into the United States by securing final orders of removal prior to the termination of aliens’ criminal sentences and to ensure that aliens are transferred into ICE custody to be removed from the United States upon completion of their criminal sentences.50
CAP’s primary jail enforcement program includes 126 10-person teams that are assigned to federal, state, and local prisons and jails throughout the country to conduct screening operations both during booking and among incarcerated prisoners.51 In addition to onsite deployment of ICE
officers and agents, CAP uses video teleconference (VTC) equipment that connects jails and prisons to ICE’s Detention Enforcement and Processing Offenders by Remote Technology (DEPORT) Center in Chicago, IL. As of January 2011, more than 545 VTC units had been installed to support such remote screening.52 CAP also works with state and local correctional departments that provide ICE with inmate rosters. ICE analyzes roster data and compares prisoner data to immigration databases. Additionally, CAP maintains a special partnership with
49 ICE also operates the Joint Criminal Alien Removal Task Force (JCART) program, located within CAP and
established in 2009. The JCART pursues known at-large criminal aliens, including in particular aliens who have been convicted of drug trafficking offenses, violent crimes, and sex offenses and are subsequently released from federal, state or local custody. JCART is an inter-agency program that (in addition to ICE) includes other DHS enforcement branches, probation and parole offices, the United States Marshal’s Service, the Bureau of Prisons, and local law enforcement agencies. See ICE, “Fact Sheet: Criminal Alien Program,” http://www.ice.gov/news/library/factsheets/ cap.htm.
50 ICE, Fact Sheet: Criminal Alien Program, March 29, 2011, http://www.ice.gov/news/library/factsheets/cap.htm. 51 ICE, Congressional Budget Justifications FY2012.
52 ICE, Secure Communities: Quarterly Report FY2010, 4th Quarter, January 3, 2011, http://www.ice.gov/doclib/foia/
area law enforcement agencies (LEAs) through the Phoenix Law Enforcement Area Response program. Under this program, CAP officers respond to 100% of Arizona LEA requests 24 hours a day, 7 days a week.53 According to ICE, these CAP screening systems together with Secure
Communities (discussed below) covered persons being booked into 76% of all U.S. jails and prisons as of August 2011, including 100% of the 1,244 federal and state prisons in the United States and 64% (1,959 out of 3,047) of all local jails.54
Secure Communities
Secure Communities is an information sharing program between the Departments of Justice and Homeland Security that uses biometric data to screen for removable aliens as they are being booked into jails. Under the program, when participating law enforcement agencies submit the fingerprints of arrestees to the Federal Bureau of Investigation (FBI) for criminal background checks, the fingerprints also are automatically checked against DHS databases, and potential matches are forwarded to ICE’s Law Enforcement Support Center (LESC).55 ICE agents at the
LESC confirm the identity of matched prints and screen their records for immigration violations and criminal histories. When the LESC determines that the arrestee may be a removable alien, the LESC evaluates the alien’s criminal history and notifies the ICE Enforcement and Removal field office in the arresting jurisdiction about the match.
After being notified that a removable alien has been arrested, the local ICE field office supervisor reviews the record and decides how to proceed based on the priority attached to the case (see “DHS Enforcement Priorities and Discretion”) and the office’s available resources. If the office decides to initiate removal proceedings against an alien, ICE normally issues an immigration detainer. The detainer is a request that the arresting agency hold the alien following completion of his or her criminal proceeding for up to 48 hours (excluding holidays and weekends) to allow ICE CAP officers to take custody of the alien and to initiate removal proceedings.56
§ 287(g) Jail Screening Program
Section 287(g) of the INA permits the delegation of certain immigration enforcement functions to state and local law enforcement agencies. Agreements entered pursuant to INA § 287(g)
(commonly referred to as § 287(g) agreements) enable specially trained state or local officers to perform specific functions relating to the investigation, apprehension, or detention of aliens, during a predetermined time frame and under federal supervision.57 Although § 287(g) agreements were authorized as part of the 1996 Illegal Immigration Reform and Immigrant
53 ICE, Congressional Budget Justifications FY2012. 54 ICE email to CRS, August 8, 2011.
55 The Law Enforcement Support Center (LESC) is ICE’s national point of contact for local, state, and federal law
enforcement agencies, corrections systems, and court systems seeking information about aliens suspected, arrested, or convicted of criminal activity. The LESC staffs a 24-hour phone line to respond to queries, and provides customs, immigration, and identity information based on ICE records. See ICE, “Law Enforcement Support Center,” http://www.ice.gov/lesc/.
56 The regulations governing immigration detainers are found at 8 C.F.R. 287.7.
57 INA § 287(g)(5), 8 U.S.C. § 1357(g)(5); seeCRS Report R41423, Authority of State and Local Police to Enforce Federal Immigration Law, by Michael John Garcia and Kate M. Manuel.
Responsibility Act (P.L. 104-208, Div. C, IIRIRA), the first § 287(g) agreement was implemented in 2002, and 61 of the 69 current § 287(g) agreements were signed after 2006.58
About half (34 of 69) of the current § 287(g) agreements are jail enforcement agreements.59
Under these agreements, specially trained officers within state and local corrections facilities are authorized to identify criminal aliens by interviewing them and screening their biographic information against the same DHS databases used by CAP agents and officers. Section 287(g) officers also use ICE’s database and case management system (ENFORCE) to enter information about the alien and to generate the paperwork for an immigration detainer and a Notice to Appear (initiating the formal removal process). State and local corrections officers are supervised by CAP agents or other ICE Enforcement and Removal Office agents.
Task Force Programs
§ 287(g) Task Force Program
Twenty of the current § 287(g) agreements are for task force programs.60 In these programs,
designated law enforcement officers may, during the course of their regular law enforcement duties within the community or under the direction of a supervising federal immigration officer, identify and arrest certain removable aliens on immigration charges.61 In cooperation with local
ICE Homeland Security Investigations offices,62 the § 287(g) task force programs pursue a
variety of specific law enforcement targets, including document fraud, human smuggling, and drug enforcement.
In addition to jail enforcement and task force models, 15 of the current § 287(g) programs are “hybrid” programs that include jail enforcement agreements as well as task forces within the same jurisdiction. 63 For hybrid programs, ICE ERO agents supervise the jail enforcement
programs and Homeland Security Investigations agents supervise the task force operations.
National Fugitive Operations Program
The National Fugitive Operations Program (NFOP) pursues known at-large criminal aliens and fugitive aliens. ICE created the NFOP in 2003 to expand the agency’s ability to locate, arrest, and remove fugitive aliens, defined as aliens who have “failed to leave the United States based upon a final order of removal, deportation or exclusion, or who [have] failed to report to ICE after
58 ICE, “Fact Sheet: Delegation of Immigration Authority Section 287(g) Immigration and Nationality Act,”
http://www.ice.gov/news/library/factsheets/287g.htm#signed-moa.
59 Ibid.
60 ICE, “Fact Sheet: Delegation of Immigration Authority Section 287(g).”
61 SeeCRS Report R41423, Authority of State and Local Police to Enforce Federal Immigration Law, by Michael John
Garcia and Kate M. Manuel.
62 ICE Homeland Security Investigations (HSI) directorate oversees ICE’s criminal investigations covering
immigration crime, human rights violations and human smuggling, smuggling of narcotics, weapons and other contraband, financial crimes, cybercrime, and export enforcement issues; see ICE, “ICE Homeland Security Investigations,” http://www.ice.gov/about/offices/homeland-security-investigations/.
receiving notice to do so.”64 In 2009, with support from Congress,65 the NFOP expanded its focus
to locating, arresting, and removing at-large convicted criminal aliens, aliens who pose a threat to national security and community safety, members of transnational gangs, child sex offenders, and aliens with prior convictions for violent crimes.66
The NFOP consists of 104 fugitive operations teams that use data from the National Crime Information Center (NCIC)67 and other intelligence sources to pursue criminal aliens and other NFOP priority cases. Based on these leads, NFOP teams conduct enforcement actions at worksites, in residential areas, and at other locations.
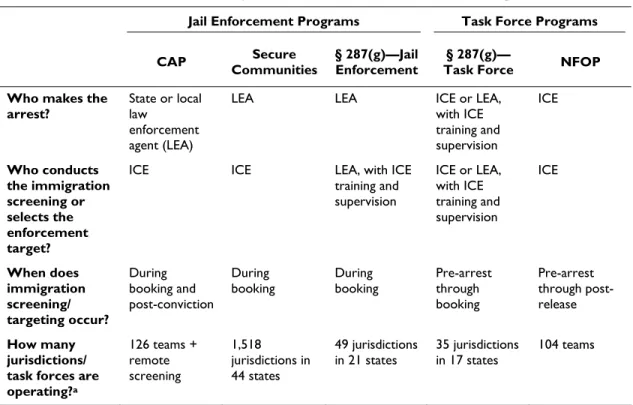
Differences Among Criminal Alien Enforcement Programs
Table 4 summarizes key differences among ICE’s four main programs targeting criminal aliens. One core distinction is between jail enforcement programs—including CAP, Secure
Communities, and most § 287(g) programs—and task force programs—including NFOP and 20 § 287(g) programs. By their nature, jail enforcement programs are not highly targeted: they are designed to screen the entire population of people passing through the criminal justice system. Those screened by jail enforcement programs are typically arrested by state and local law enforcement agents for non-immigration offenses.
Conversely, task force programs tend to be more targeted operations, pursuing specific serious criminal aliens, fugitive aliens, or other criminals who have been targeted by ICE or other law enforcement agencies. Under task force operations, ICE agents or other law enforcement officers with specific immigration training are the arresting agents.
64 ICE, “Fact Sheet: ICE Fugitive Operations Program,” http://www.ice.gov/news/library/factsheets/fugops.htm. 65 In 2009, House appropriators moved the NFOP from the general Detention and Removal Operations budget to
include it among a set of programs for the Identification and Removal of Criminal Aliens; see U.S. Congress, House Committee on Appropriations, Subcommittee on Homeland Security, Department of Homeland Security
Appropriations Bill, 2009, Report to Accompany H.R. 6947, 110th Cong., 2nd sess., September 18, 2008, H.Rept.
110-862 (Washington: GPO, 2008), pp. 51-53.
66 ICE, “Fact Sheet: ICE Fugitive Operations Program,”
67 The National Crime Information Center (NCIC) is the Federal Bureau of Investigation’s (FBI) national clearinghouse
of crime data, including 12 person files including Supervised Release, National Sex Offender Registry, Foreign Fugitive, Immigration Violator, Missing Person, Protection Order, Unidentified Person, U.S. Secret Service Protective, Gang, Known or Appropriately Suspected Terrorist, Wanted Person, and Identity Theft. NCIC includes 15 million active records and averages 7.5 million transactions per day. See FBI, “National Crime Information Center,” http://www.fbi.gov/about-us/cjis/ncic.
Table 4. ICE’s Primary Criminal Alien Enforcement Programs Jail Enforcement Programs Task Force Programs CAP Communities Secure § 287(g)—Jail Enforcement Task Force § 287(g)— NFOP Who makes the
arrest? State or local law enforcement agent (LEA)
LEA LEA ICE or LEA,
with ICE training and supervision ICE Who conducts the immigration screening or selects the enforcement target?
ICE ICE LEA, with ICE
training and supervision ICE or LEA, with ICE training and supervision ICE When does immigration screening/ targeting occur? During booking and post-conviction During
booking During booking Pre-arrest through booking Pre-arrest through post-release How many jurisdictions/ task forces are operating?a 126 teams + remote screening 1,518 jurisdictions in 44 states 49 jurisdictions
in 21 states 35 jurisdictions in 17 states 104 teams
Source: CRS Analysis of ICE programs. Secure Communities jurisdictions data as of September 20, 2011, from ICE, “Activated Jurisdictions,” http://www.ice.gov/doclib/secure-communities/pdf/sc-activated.pdf; § 287(g) jurisdictions data as of September 2, 2011, from ICE, “287(g) Results and Participating Entities,”
http://www.ice.gov/news/library/factsheets/287g.htm#signed-moa.
Notes:CAP refers to the Criminal Alien Program; NFOP refers to the National Fugitive Operations Program; 287(g) refers to agreements entered pursuant to INA § 287(g) for jailing screening or task force programs; LEA refers to law enforcement agent; ICE refers to the U.S. Immigration and Customs Enforcement agency.
a. Number of jurisdictions as of March 2011 for CAP, September 2011 for Secure Communities and § 287(g) program, and August 2009 for NFOP. The reported number of § 287(g) task forces counts 15 hybrid programs as both jail enforcement and task force models; as of October 13, 2011, ICE has § 287(g) agreements with a total of 69 law enforcement agencies in 24 states.
A second, related difference concerns who conducts immigration-related screening and who selects targets for immigration-related enforcement. Under all but the § 287(g) program, ICE agents conduct immigration screening either in the jail (under CAP) or remotely (under CAP and Secure Communities); and ICE and DHS select the targets for task force operations based on at-large aliens’ criminal records and immigration histories. Under the § 287(g) program, local corrections officers with ICE training conduct immigration screenings during the booking process (for jail programs), and local law enforcement agencies exercise some discretion about when and how to participate in immigration-related task force enforcement activities.
These ICE programs also target criminal aliens at different points in the criminal justice process, as noted above and summarized in Table 4. All three jail enforcement programs conduct
screening during the booking process, meaning that many potentially removable aliens are identified even though they have never been charged with or convicted of a crime. (As noted above, unauthorized aliens are potentially removable regardless of whether they are eventually convicted of a criminal offense. Certain legal aliens only become removable if they are charged and convicted of a removable criminal offense.) CAP also conducts screening of persons who
have been convicted of crimes and are incarcerated. The enforcement task forces target aliens at different points in the criminal justice process, with the NFOP focusing on at-large convicted criminal aliens (including those who have served jail time and then been released) and fugitive aliens, who may not have been convicted of criminal offenses, and § 287(g) task forces focusing on a range of different types of suspected criminals.
DHS Enforcement Priorities and Discretion
Not all potentially removable aliens who come into contact with DHS and other law enforcement agencies are placed in formal removal procedures. DHS estimates that there were about 10.8 million unauthorized immigrants in the United States in January 2010,68 and DHS apprehended
an average of 641,000 removable aliens per year from FY2008 to FY2010.69 These apprehension
numbers do not include additional removable aliens who are transferred to ICE after being apprehended by other federal, state, and local law enforcement agencies. Yet ICE and its partner agencies only have the detention bed space and institutional capacity to remove about 400,000 aliens per year.70
Thus, DHS—like the INS before it—has developed a system to prioritize certain aliens for removal.71 Accordingly, ICE has published a number of agency guidance memos concerning the
agency’s enforcement priorities and prosecutorial discretion, including in March and June of 2011. In August 2011, DHS Secretary Janet Napolitano announced that the recent memos apply to all DHS enforcement agencies.
March 2011 ICE Guidance Memo
In March 2011, ICE Director John Morton published agency guidelines that define a three-tiered priority scheme that applies to all ICE programs and enforcement activities related to civil immigration enforcement.72 Under these guidelines, ICE’s top three immigration enforcement
priorities are to (1) apprehend and remove aliens who pose a danger to national security or a risk
68 Michael Hoefer, Nancy Rytina, and Bryan C. Baker, Estimates of the Unauthorized Immigrant Population Residing
in the United States: January 2010, Office of Immigration Statistics, Department of Homeland Security, February 2011.
69 DHS apprehensions include U.S. Border Patrol apprehensions and ICE administrative arrests; see Department of
Homeland Security Office of Immigration Statistics, “Immigration Enforcement Actions: 2010,” June 2010, http://www.dhs.gov/xlibrary/assets/statistics/publications/enforcement-ar-2010.pdf.
70 John Morton, Memorandum on Civil Immigration Enforcement: Priorities for the Apprehension, Detention, and Removal of Aliens, US Immigration and Customs Enforcement, Washington, DC, March 2, 2011, http://www.ice.gov/ doclib/news/releases/2011/110302washingtondc.pdf.
71 Ibid. On INS policies related to prosecutorial discretion and the prioritization of certain aliens for removal see INS
General Counsel Bo Cooper, INS Exercise of Prosecutorial Discretion, U.S. INS, Washington, DC, July 11, 2000; INS Commissioner Doris Meissner, Exercising Prosecutorial Discretion, U.S. INS, Washington, DC, Novermber 17, 2000; and INS General Counsel Bo Cooper, Motions to Reopen for Considerations of Adjustment of Status, U.S. INS, Washington, DC, May 17, 2001.
72 ICE’s mission includes the criminal and civil enforcement of federal laws governing border control, customs, trade,
and immigration; see ICE, “ICE Overview: Mission,” http://www.ice.gov/about/overview/. Laws governing the detention and removal of unauthorized aliens generally fall under ICE’s civil enforcement authority, while laws governing the prosecution of crimes, including immigration-related crimes, fall under ICE’s criminal enforcement authority. Also see Hiroshi Motomura, “The Discretion That Matters: Federal Immigration Enforcement, State and Local Arrests, and the Civil-Criminal Line,” UCLA Law Review, vol. 58, no. 6 (August 2011), pp. 1819-1858.