The Evolution of a Multimedia Delivery
System and its Effects on Student
Perception and Performance
Vicki Jones, Jun Jo and Greg Cranitch
School of Information Technology Griffith University Gold Coast, AUSTRALIA
[email protected] [email protected] [email protected]
Abstract
In teaching a multimedia course it is important and relevant to apply what you are teaching. As a result, the first year
Multimedia course offered through Griffith University (Gold Coast) has been through many changes since it was first offered. The course content remains relatively constant, allowing for software upgrades and new and more suitable software. However, over the last few years the mode of
delivery has evolved to a combination of online and traditional approaches, more appropriate to teaching a subject of this nature. This paper will review the evolution of the teaching environment and delivery modes used in a multimedia course between 1998 and 1999, and analyse the impact of the change.
Keywords
Online learning, Online delivery, Multimedia, Internet, Education, Student performance
Introduction
The multimedia course (Multimedia I) offered through Griffith University, Gold Coast, consists of Web Page Design and Multimedia authoring. From its inception, text-based lecture notes and exercises were made available to the students through the university computer network. These documents could be downloaded from the multimedia lab computers only. This resource, while beneficial, was also limiting as students could only access the lab when not in use for other tutorials.
In 1998 an Internet presence was added with the tutorial notes and exercises being made available from the Internet and therefore accessible from home. This allowed the students the flexibility, not only of
downloading files via a remote computer, but also the opportunity to get the notes prior to attending class and getting a ‘head-start’ on their work. In 1999 a further major step towards more flexible delivery style was taken when lecture notes were also available over the Internet. The
lectures were conducted in traditional mode (face-to-face) for seven weeks and totally online for seven weeks. However, this progression into a more flexible delivery did not stop here. One of the most important factors was to use the technology being taught. This paper will review the evolution of the teaching modes at Griffith University and its effect on student
perception and performance through a comparative study.
Teaching Systems Design
Research conducted by Masie (2000) found that those involved in teaching and training considered that the following points were important factors in any teaching/learning system:
• Multiple delivery methods including both Web-based and classroom delivered • Communication with lecturers and tutors
• A mixture of new technologies with traditional methods
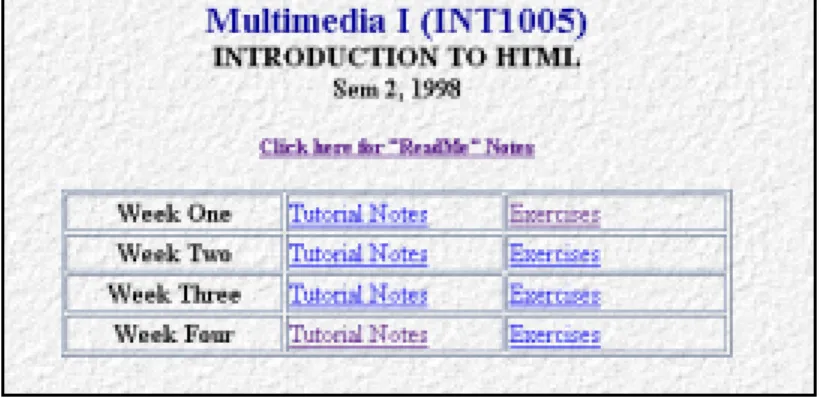
The system designed for the multimedia course used a blend of both new and traditional technologies with varied delivery methods. In an endeavor to maintain communication, interaction was encouraged between student and lecturer/tutor. In 1998 both online and face-to-face activities were used with an emphasis on face-to-face. Although information was available from the Internet, students were still required to attend lectures and tutorials. A web site was created - Figure 1 represents the HTML section. There was a separate opening page for Macromedia Director. The sites presented the notes and exercises in text form enhanced with some visual representations produced in Macromedia Shockwave.
Figure 1: Multimedia HTML Opening Web Page (1998)
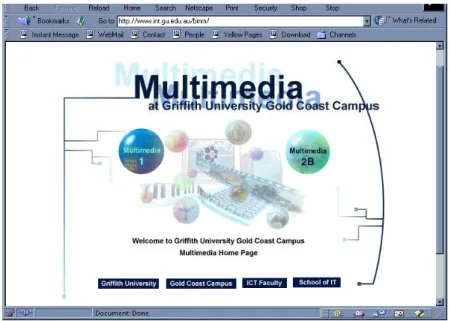
In 1999 a Flexible Learning System (FLS) was introduced. This was a major progression on the Internet presence of 1998. A dedicated Web site was produced specifically for Multimedia. It was a closed site and students needed a login and password for access. Unlike the initial page of the 1998 Web site, which was designed to be basic and informative, the initial page of the 1999 Web site was a visually appealing entry site (Figure 2). It was created using multimedia techniques taught within the course. A number of year 2 and 3 Multimedia students were involved in the design,
production and maintenance of this Web site. Based on what they had learnt during their course of study, they were able to collaborate and develop the site. This was undertaken with minor supervision and guidance from the lecturer and tutors who also collaborated on this project.
Figure 2: Multimedia Introductory Web Page (1999)
Teaching modes
In order to compare the two styles of teaching and delivery for 1998 and 1999, the methods will be referred to as Mode 1 (1998) and Mode 2 (1999). It is important to note that use of difference modes between the two academic study periods was not an engineered issue but happened as a natural progression, or evolution, of multimedia itself. As the course developed over time the need to put the available techniques to use arose. As a consequence, it has been found to be a great benefit to both students and educators. The students get to see the software and methods in practical use, and the educators get a chance to demonstrate the use of these techniques. Table 1 shows a comparison of the two modes.
Mode 1 Mode 2 Delivery Mode Mainly Face-to-Face
Online teaching (web browsing and
downloading)
Mainly Online Teaching (using streaming
technology)
Limited Face-to-Face Downloading with FTP Electronic Communication
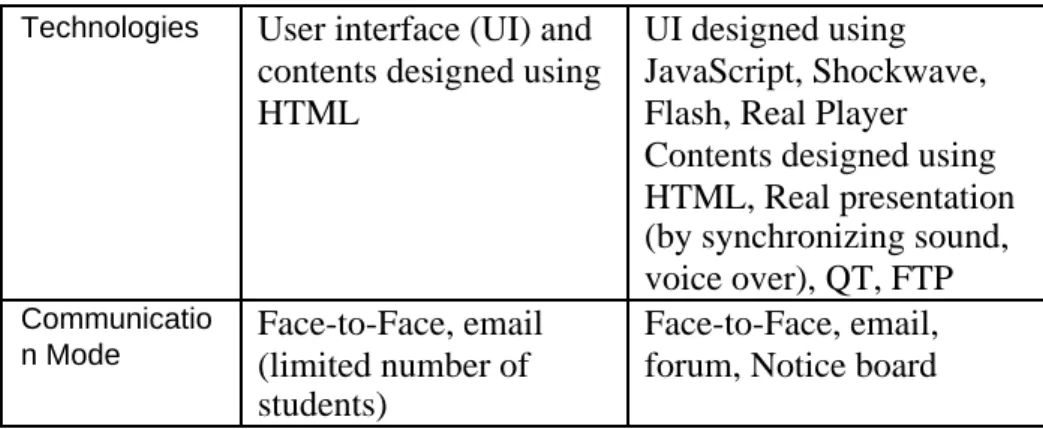
Technologies User interface (UI) and contents designed using HTML
UI designed using JavaScript, Shockwave, Flash, Real Player Contents designed using HTML, Real presentation (by synchronizing sound, voice over), QT, FTP
Communicatio
n Mode Face-to-Face, email(limited number of
students)
Face-to-Face, email, forum, Notice board Table 1: Mode 1 / Mode 2 Comparison
For Mode 1, a web server was used for students’ downloading and
browsing. Students attended face-to-face lectures and accessed the network to download the lecture notes in text format. This meant that students could access and read the notes prior to attending lectures; arrive fully prepared; and only need to add their own notes and comments as they listened. This saved time and gave the students more chance to concentrate on the topic. The tutorial notes and exercises were accessible from the Web prior to tutorials. During the tutorials, held in the computer lab, students could also download example files from the Web or the
university server. The tutorial notes were designed as a set of information pages tackling various aspects of the multimedia topics, HTML and Macromedia Director, and stepping through in lesson style. The students could then use what they learnt in conjunction with the exercises and example files to complete their set tasks.
Mode 2 was “technology greedy” – using HTML, JavaScript, Shockwave, Flash, Real Player, QT, FTP and presentations which synchronized sound and voice. Three different servers were used, Real Server, Web Server and FTP Server, to allow for streaming, browsing, downloading and
communication. Because of the newness of these technologies, there was much trial and error involved. There were many students (150 students in 1999) accessing the site simultaneously. This caused a number of
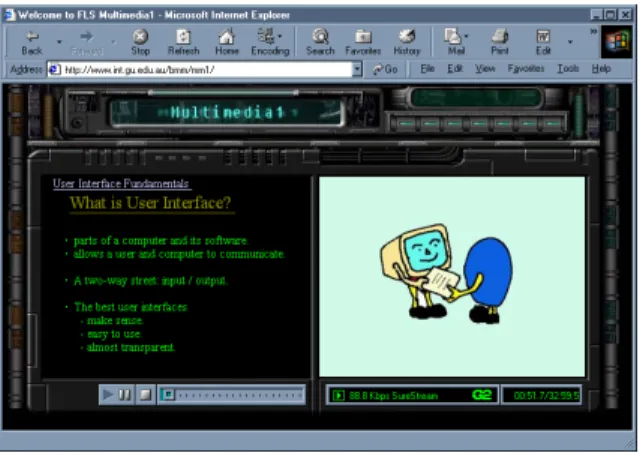
connection “drop-outs” and some server downtime. Each online-lecture was available from a specific time; for example, the Week 10 lecture would become available at the start of Week 10. However, students could repeat each lecture many times. Each Lecture comprised a text-based slide on the left hand side of the screen, picture or video clip on the right hand side and accompanying voice over and sound, Figure 3. The tutorial notes and exercises used basically the same content as in Mode 1. However, several improvements were made to keep the students up-to-date with
technology. The notes were made available through the same Web site as the lecture notes.
Figure 3: “Lecture Board” Web page
Comparison of the different Teaching systems
A survey study was conducted in 1998, part of which was reported in a paper by Jones and Jo (1999). The purpose of the research was to
investigate the application of multimedia and computer based instruction for online course delivery. Students’ performance and perception were evaluated and analysed. Information from that study has been incorporated into this research to provide the basis for comparison.
Student Perception
Student Perception of the course was compared using the results of questionnaires conducted after completion of each study period. The questions used can be seen in Table 2 below.
Mode 1 (1998) and Mode 2 (1999)
Question 1 In terms of its delivery the course material has met my expectations of this course.
Question 2 The lecture / tutorial notes and exercises were designed to encourage learning.
Question 3 The objectives and goals for each section were clear.
Question 4 The course material was user-friendly and easy to navigate.
Question 5 The examples, illustrations, animations / Movies, etc were helpful and gave me a clearer understanding of the content.
Question 6 I believe I have gained a good understanding of the content
of the lectures and tutorials.
Table 2: Corresponding questions from Mode1 and Mode 2. As seen in the graph below (Figure 4), students regarded the course with favour, the average response falling within 2.05 and 2.28 for all questions. However, it can be seen that students undertaking the course in 1999 rated questions one to four higher (closer to 1) than the 1998 students, and the students in 1998 felt they had gained a better understanding of the topic (see questions five and six). Students were asked to rate their answers on a scale of 1 to 5 (with 1: Strongly Agree and 5: Strongly Disagree).
Comparison of Perception-based questions
1.00 2.00 3.00 4.00 5.00 1 2 3 4 5 6 Question Number Rating 1 to 5 1998 1999
Student Performance - Academic Records
The academic records for the Multimedia I course in 1998 and 1999 were compared. The delivery and teaching modes were the only variables, as the subject, conditions, marking criteria, exam questions format and teaching staff were the same. This comparison of student outcomes between 1998 and 1999 can be seen in Table 3.
Category 1998 1999
Number of enrolled students 112 150
Number of students failed (number / %) 16 (14.3%)
23 (15.3%) Number of students failed with Non
Submission (number / %)
4 (3.6%) 12 (8%)
Average percentage overall 62% 61%
Table 3: Comparison of students’ academic record
1999 saw an increase of 34% in student enrolment. However, the average mark showed little fluctuation, being 62% in 1998 and 61% in 1999. This is not a significant difference and could not reasonably be attributed to the variation in delivery mode. The failure rate did increase from 1998 to 1999 by 1%, but again not significant enough to be due to the different delivery mode. The number of students who received “Failure with Non Submission” did increase, from 3.6% in 1998 to 8% in 1999. However, no record is kept of why the students did not submit work so whether or not it was a direct result of the delivery mode cannot be established.
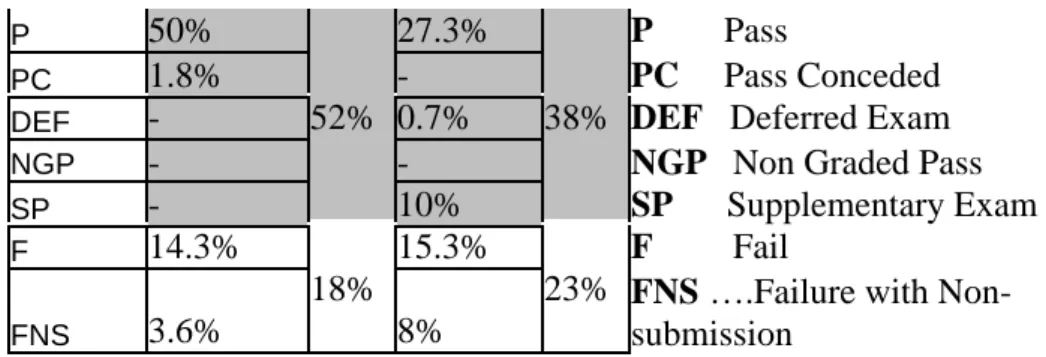
A comparison was made of the actual grades achieved by students in this course through 1998 and 1999, Table 4 (with graphical representation in Figures 5 and 6). Of the students who passed, the achievement level was higher in 1999. In 1998 30% of students received a CREDIT or higher, against 39% in 1999. The percentage of students who passed with less than a CREDIT was 52% in 1998 and 38% in 1999.
Grade
Percentage 1998
Percentag e 1999
The abbreviated grades are described below: HD 1.8% 1.3% HD High Distinction D 8.9% 8.7% D Distinction C 19.6% 30% 28.7% 39% C Credit
P 50% 27.3% P Pass
PC 1.8% - PC Pass Conceded
DEF - 0.7% DEF Deferred Exam
NGP - - NGP Non Graded Pass
SP -52% 10% 38% SP Supplementary Exam F 14.3% 15.3% F Fail FNS 3.6% 18% 8%
23% FNS ….Failure with Non-submission
Table 4: Grade Percentage 1998 and 1999
4 16 0 0 02 56 22 10 2 0 1 0 2 0 30 4 0 50 60
Num ber of students FNS F SP NG D EF PC P C D HD
Student grades for MM1 in 1998
Figure 5: Student grades in 1998
12 23 15 01 0 41 43 13 2 0 1 0 20 30 40 5 0
Num ber of stude nts HD D C P PC D EF NGP SP F FNS
Student grades for MM1 in 1999
Figure 6: Student grades in 1999
Discussion Student perception
A favourable response was received from students in regard to their perception of the course. In both cases (Mode 1 and Mode 2) the course material met expectations, encouraged learning, was easy to use, and objectives were made clear. However, the Mode 2 students rated these qualities slightly higher than Mode 1 students, suggesting the increased use of technology may have influenced their opinion. In response to question five, explanatory examples and animations, the students in Mode 1 were more positive even though they received limited technology in this area. This may reflect the fact that some of the obstacles encountered in Mode 2 were a direct result of technical issues, such as download time and plug-in problems, which was not the case in Mode 1. An interesting point is that students in Mode 1 rated their belief that they had gained a good
understanding of the course content much higher than the students in Mode 2. However, there was little difference when comparing their final marks.
The Mode 2 students were subjected to practical use of the technologies they were learning about. It is possible that they have gained a better understanding of what actually happens in the “real world” when using multimedia technologies. In this way they could see the difficulties as well as the benefits. One can only speculate as to whether this is what happened in this case, but it seems that the Mode 2 students may have had less confidence in their learning achievement because of the shortfalls in the technology.
Student achievement
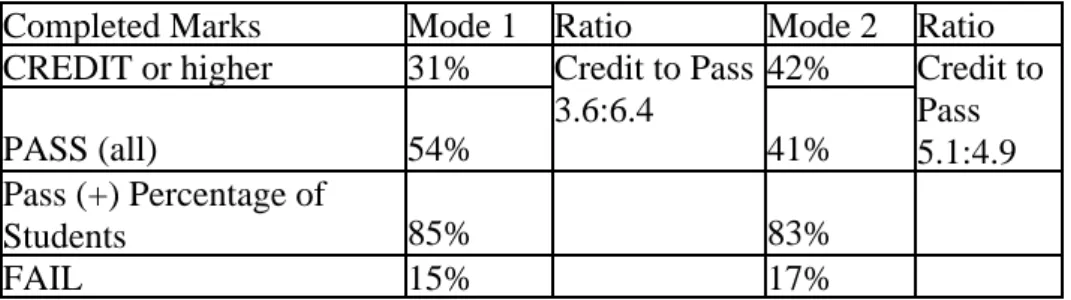
Although there was no significant difference in the overall marks of Mode 1 and Mode 2, the students in Mode 2 who passed the course, seem to have attained higher grades than those in Mode 1. When the marks are compared for only those students who completed the course (submitted all work) there is a similar percentage of successful students (received PASS or above), 85% (Mode 1) to 83% (Mode 2), Table 5. However, the difference is found in the percentage of higher-level marks as seen in the table. More than half the students who passed the course in 1999 received
CREDIT or higher (a ratio of 5.1:4.9), compared to a ratio of 3.6:6.4
(31% to 54%) in 1998.
Completed Marks Mode 1 Ratio Mode 2 Ratio
CREDIT or higher 31% 42% PASS (all) 54% Credit to Pass 3.6:6.4 41% Credit to Pass 5.1:4.9 Pass (+) Percentage of Students 85% 83% FAIL 15% 17%
Table 5: Completed Marks
The combination of online and traditional methodologies may have contributed to this variation in marks by providing a more rounded blend of these approaches. In this way students in Mode 2 were in a position to see the technologies first-hand.
Problems
The main technical problems encountered occurred with the
implementation of the online course for Mode 2. These included slow download speed for students accessing from remote computers and problems with plug-ins. Macromedia Shockwave was used initially for some of the animation but later replaced by using JavaScript. Many students did not have Shockwave installed or had older versions.
Shockwave is an excellent medium when hardware and bandwidth allow it, but it is not practical for use on older computers with slow modem connections. Using JavaScript eliminated these problems. There were other problems with plug-ins being required for Flash, Real Player and QuickTime movies. While this may not be problematic it can be an inconvenience for busy students.
Another problem was the lack of contact between lecturer and students. While students were encouraged to initiate contact with the lecturer (a weekly consultation time was set), the mere fact that for seven weeks the students did not need to attend lectures and see the lecturer was a
disadvantage. Few students attended consultation until late in the semester.
Some students were intimidated by the technology and did not feel competent and comfortable using online lectures. Others did not visit the web site until the final week before the exam. And some students did not have computers at home (especially the overseas students). For these students it was necessary for them to visit the multimedia computer lab after hours, which at times was inconvenient or impractical. The verbal feedback received indicated that the students did not like to be
inconvenienced as they were generally running on a tight schedule. No technical problems were found with the Mode 1 group. The students received traditional lectures throughout the semester, the tutorials were written in basic HTML with limited additional techniques and there was ample opportunity for personal contact with lecturer and tutors.
Benefits
Online education is considered to be especially valuable for mature-age students who tend to have permanent jobs and the added responsibility of family commitments. Mature-age students are also inclined to be more highly motivated than the younger students (Thomas, 1999). Many of
today’s students, both school-leavers and mature-age, need to work part or full time to make ends meet. With a major component of the multimedia course offered online, students have access to the flexibility needed to complement a busy schedule.
All multimedia students have access privileges to the multimedia computer labs after hours and on weekends by way of a special
access/proximity card. This allows them to work at their own pace and time. Many students prefer to work at home and have access to a computer and the Internet at home. With the current price of computer systems at a low, and easy payment terms offered by many companies, it is not impractical for most students to afford to buy a system. Second-hand is also an option. Therefore all students have access to the technologies they are learning about. By incorporating these technologies within the online learning system itself, they can see how practical it may be to use such technologies. They also gain a better understanding about both the benefits and shortcoming of their use.
Conclusion
Computer and Internet access are not only essential elements in a subject of this type but also in the general academic and business environment. Multimedia students are expected to know and understand the
technologies of their field. During this research it was found that the progression of this course had taken on an evolutionary quality. The old adage “Necessity is the mother of invention” could be seen here. A more complex system was required to cater for the needs of the students. As student enrolment in this course grows with each semester, the online delivery of lectures will enable the educators to accommodate the requirements of the students.
A positive research outcome to the online delivery of Mode 2 was
achieved, with good responses from students towards the FLS. However, areas for improvement were discovered which suggest that research will be on-going as the system evolves. The use of a FLS in a
multimedia/information technology subject is a practical and appropriate practice well suited to this field. There is also a need to give a clear understanding of the technology to students studying multimedia. Online communication must be further developed to allow for effective lecturer-student contact.
When comparing the two modes of delivery, very little difference was found in student perception and performance. However, the use of Mode 2 could prove more economical as it can be prepared once and updated when needed. It is “reusable” with better performance in particular areas such as visual appeal. Developing the Mode 2 system of lecture material was expensive and time-consuming. Therefore, by reusing the system it becomes more economical over time. With the evolution of the
multimedia online system the initial system can be used as a base to work and build on.
This statement by Thomas (1999) provides some insight:
“The potential impact of online education is enormous. Some believe it could be the greatest door-opener to knowledge in recorded history. But if people are going to win the learning game, everyone must be allowed to play.”
Involvement and interaction are important and relevant to multimedia. It should be delivered hands-on and its capabilities demonstrated.
Future research will focus on a better delivery system using CDs to enhance the lecture content and reduce the download time. A Hybrid Delivery System is being developed with the inclusion of a database system (Jo, Jones and Cranitch, 2000). This will allow for easier access to information, fewer downloads required and more student control of learning pace, time and place.
References
Masie, E. (2000) Balance Between Classroom And E-Learning is Vital to Success, Computer Reseller News, Jan 31, 2000 p57.
Jones, V. and Jo, J. H. (1999) The Evaluation of Student Performance and Perception in Web-based Instruction in Regard to Age and Gender, Conference Proceedings Ascilite’99: Responding to Diversity, Brisbane, Australia, December 1999.
Jo, J. H., Jones, V. and Cranitch, G. (2000) Hybrid Delivery System (HDS) for Internet-Based Learning, Conference Proceedings ED-ICT 2000, Vienna.
Thomas, S. (1999) Adult Learning Goes Online, Computer Shopper, Oct 1999, 19(10) p331
Copyright 2000 V.Jones, J. H. Jo and G. Cranitch.
The authors assign to ASCILITE and educational non-profit institutions a non-exclusive licence to use this document for personal use and in courses of instruction provided that the article is used in full and this copyright statement is reproduced. The authors also grant a non-exclusive licence to ASCILITE to publish this document in full on the World Wide Web (prime sites and mirrors) and in
printed form within the ASCILITE 2000 conference proceedings. Any other usage is prohibited without the express permission of the authors.