Job Growth in Television
Job growth in television: cable
versus broadcast, 1958–99
Dominic Toto
Dominic Toto is an economist in the Division of Monthly Industry Employment Statistics, Bureau of Labor Statistics.
As the television industry matured over the last 50 years,
technological improvements, increased demand
for video programming, and the easing of some regulations
helped shift employment from broadcast television
to cable and other pay television services
B
roadcast television made its public debut at the New York World’s Fair in 1939, dramatically changing the way people live, work, and spend their free time.1 A decade later, community antenna television, an early form of cable television, spread broad-cast signals over rural Pennsylvania and Or-egon.2 Currently, nearly all homes in the United States with televisions have access to some form of cable television, with approxi-mately two-thirds of U.S. households sub-scribing to a local cable service.3For more than 40 years, employment in all areas of television program delivery has risen substantially. During the first half of this pe-riod, radio and television broadcasting ac-counted for most of the job gains, while during the second half, more of the growth occurred in cable and other pay television services. Throughout the period, changing legislation has greatly affected the way video service pro-viders conduct their business, contributing to the trend toward more rapid growth in cable services. In addition to key regulatory and policy changes, growing consumer demand for television entertainment and related technologi-cal innovations have helped boost employment levels in all video-providing industries.
This article compares the employment his-tory of cable and other pay television services
with that of radio and television broadcasting; it also reviews some of the more significant regulatory and economic changes that have occurred over the period. The chronology is broken into three phases: The first phase (1958–72) covers the early years up to when the Federal Communications Commission (FCC) introduced new rules regarding cable television in March 1972.4 The second phase (1972–84) covers the subsequent period of rapid employ-ment growth in the television industry up to when Congress enacted the Cable Communi-cations Policy Act of 1984. The third phase— during which employment growth slowed down considerably and additional regulatory and economic changes took place, covers the period from 1984 to 1999.5 The first part of the analysis focuses on employment during the study period, and the second half looks at some of the technological changes that have shaped the industry since its inception.
The television industry
According to the 1987 Standard Industrial Clas-sification (SIC) system, the primary function of television broadcasting stations (SIC 4833) is “broadcasting visual programs by television to the public.”6 Cable and other pay television services (SIC 484), including satellite services,
Table 1. Top 10 occupations in cable and other pay-TV and radio and television broadcasting, 1998
1 Installers and repairers ... 40,520 21.1 2 Customer service representatives ... 34,920 18.2 3 Order clerks ... 6,130 3.2 4 First-line supervisors—product ... 5,230 2.7 5 Dispatchers, except police and fire ... 5,170 2.7 6 All other sales and related ... 5,120 2.7 7 First line supervisors-administrative ... 5,090 2.7 8 Sales agents, advertising ... 5,000 2.6 9 General managers and executives ... 4,680 2.4 1 0 Engineering and related technicians ... 4,030 2.1
1 Announcers ... 46,100 18.7 2 Sales agents, advertising ... 25,280 10.3 3 Broadcast technicians ... 22,990 9.4 4 Producers, directors, actors ... 17,890 7.3 5 Reporters and correspondents ... 11,320 4.6 6 General managers and executives ... 8,620 3.5 7 Camera operators ... 6,900 2.8 8 Photographers ... 6,800 2.8 9 Writers and editors ... 6,040 2.5 1 0 Other professionals and technicians ... 5,670 2.3
distribute “visual and textual television programs, on a sub-scription or fee basis.”7 Broadcast and cable establishments may also produce taped television programs, but it is not their main line of business. (Firms mainly producing taped televi-sion or motion pictures are classified in the services indus-try—specifically, in SIC 7812, motion picture and video tape production.)
What the workers do. The workforces of the two video dis-tribution markets differ significantly. Table 1 shows the top 10 occupations in cable and other pay television services (SIC 484) and in radio and television broadcasting stations (SIC 483).8 Installers and repairers (21 percent) and customer service representatives (18 percent) stand out as the top two job categories in cable and pay television, together making up nearly two-fifths of employment in the industry. In radio and television broadcasting, however, employment is con-centrated among announcers (19 percent), advertising sales agents (10 percent), and broadcast technicians (9 percent). That announcers occupy the top of this list most likely re-flects the “radio” portion of the industry more than the “tele-vision” portion. Advertising sales agents and general manag-ers are the only occupations to make both lists, but they are more heavily used in radio and television broadcasting. Within cable and other pay television, 6 of the top 10 job categories were sales related, customer service, or su-pervisory occupations. More “artistic” categories—such as announcers, actors, reporters, photographers, and writ-ers—appear among the leading occupations in radio and television broadcasting.
What the workers earn. In 1999, nonsupervisory workers in the radio and television broadcasting industry earned, on av-erage, $18.38 per hour. This was about 26 percent more than the average hourly earnings for cable and other pay televi-sion services, and 39 percent more than workers in the total private economy.9 However, when looking at average weekly earnings, which take the number of hours worked during the survey period into account, workers in radio and television broadcasting earned $656 per week, only about 9 percent more than workers in cable television. Nonsupervisory work-ers in cable television averaged 41.4 hours per week, or 5.7 hours more than workers in radio and television broadcasting. Employment trends
The employment data used in this article are from the BLS
Current Employment Statistics (CES) program, also known as the “establishment survey.”10 CES employment estimates for all communications (SIC 48) and for radio and television broad-casting (SIC 483) begin in 1958. (See table 2.) Although the employment history for cable and other pay television ser-vices (SIC 484) does not begin until 1988,11 a reasonable proxy series can be constructed back to 1958, by subtracting telephone communications (SIC 481) and radio and televi-sion broadcasting (SIC 483) from total communications. The resulting composite series “pay television and other com-munications” (SIC 482,4,9), can be used as a rough estimate of the growth in cable and other pay television services. Us-ing this proxy series, the followUs-ing analysis compares em-ployment in pay television and other communications over
Rank Occupation Level of industry totalPercent
Cable and other pay television (SIC 484)
4 8 Communications ... 1958 860.0 1,417.1 1,279.9 1,551.5
481 Telephone communications ... 1947 732.1 1,071.8 901.1 1,069.7
483 Radio and television broadcasting ... 1958 83.6 210.3 227.1 247.8
4832 Radio broadcasting stations ... 1982 – 107.7 117.5 116.3
4833 Television broadcasting stations ... 1982 – 102.6 109.6 131.5
482,4,9 Pay television and other communications ... 1958 44.3 135.0 151.6 234.0
484 Cable and other pay television services ... 1988 – – 110.8 200.5
482 Telegraph and other communications ... 1985 – – 16.1 11.1
489 Communications services, n.e.c. ... 1985 – – 24.7 22.4
the last 40 years with that of television broadcasting over the same period.
Cable and other (nonbroadcast) distributors of television shows have made great strides in establishing themselves as major employers in video services.12 From 1958 through 1999, employment in pay television and other communica-tions grew by an average annual rate nearly twice that of the total nonfarm economy. Radio and television broadcasting, by contrast, grew at a pace closer to that of the overall economy. (See tables 3 and 4.) In 1958, radio and television broadcasting employed nearly twice as many workers as pay television and other communications; by 1999, however, employment levels in the two industries were about the same. While the 40-year trend indicates more rapid employment growth in pay television and other communications, it masks some interesting, more short-term trends. (See chart 1.) Over-the-air television stations had already been in existence for at least 12 years by 1958, and radio and television broad-casters—the principle distributors of broadcast signals—ac-counted for roughly 84,000 workers at the time. Over the ensuing 14 years, employment in radio and television broad-casting rose at a brisk pace, accounting for 79 percent of the job growth in the combined total radio and television ser-vices (SIC 483 and 482,4,9) from 1958 to 1972. Employment in pay television and other communications expanded at a much slower pace over the same period.
The trend changed significantly during the 1972–84 pe-riod, with the introduction of new FCC rules governing cable in 1972,12 as well as the advent of the satellite and surging consumer demand for video services. Employment in total radio and television services grew more rapidly than the over-all economy, with pay television and other communications expanding twice as rapidly as radio and television broadcast-ing (9.1 percent versus 4.2 percent). A combined total of 191,000 jobs were added over the period—86,000 in radio and television broadcasting and 105,000 in pay television and
other communications.
In the years following 1972, the FCC altered or abolished many of the rules regarding cable television, important deregulatory moves that at least partly explain the hiring surge in the industry over the 1972–84 period. In 1977, for ex-ample, many of the franchise standards were eliminated, and in 1978, a simple registration process replaced the former process of applying for a certificate of compliance, making it easier and less costly to operate a cable system.14 Then, in July 1980, the FCC repealed rules that had limited a cable system’s right to import distant signals and that required ex-clusive or nonduplicative programming by local cable opera-tors.15 In 1983, the FCC eliminated its rule requiring cable television operators to file financial information.16 These deregulatory changes helped free cable systems from restric-tions put in place in the 1960s and early 1970s.
In October 1984, Congress formally amended the Com-munications Act of 1934 by enacting the Cable Communica-tions Policy Act of 1984.17 In some important ways, 1984 marks a turning point for employment growth in the televi-sion industry. Following that year, employment peaked in 1985 for both radio and television broadcasting and pay television and other communications. Through 1999, annual job growth decelerated to less than 1 percent in radio and television broadcasting. Losses accrued in pay television from 1986 to 1988, and employment did not fully recover until 1994, when growth began to accelerate once again. The period from the late 1980s through the early 1990s was one of consolidation for cable television. Many of the new alternatives to cable (such as satellite systems) did not fare well in the mid-1980s. In addition, increased video rentals had a negative effect on the cable industry. Home satellite dishes, complete with ex-panded channel capacity, started to make an impact in the early 1990s, and this development helped offset some of the drags on employment in pay television and other communications. The revision of the SIC system in 1987 paved the way for
[In thousands]
Employment in communications, annual averages for selected years, 1958–99 Series
beginning date 1958 1982 1988
Industry SIC
code 1999
Dash = data not available. n.e.c.= not elsewhere classified. Table 2.
Table 3. Employment in the television and radio communications industry, selected years, 1958–99
1958 1972 1984 1999
Level Percent Level Percent Level Percent Level Percent
Total television
and radio ... 127.9 100.0 195.9 100.0 386.9 100.0 481.8 100.0
Radio and television
broadcasting ... 83.6 65.4 137.2 70.0 223.5 57.8 247.8 51.4
Pay television & other
communications ... 44.3 34.6 58.7 30.0 163.4 42.2 234 48.6
Table 4.
1958–99 1958–72 1972–84 1984–99
Average Average Average Average
annual Level annual Level annual Level annual
percent percent percent percent
change change change change
Total nonfarm ... … 2.3 … 2.6 … 2.1 … 2.1
Total television
and radio ... 353.9 3.3 68.0 3.1 191.0 5.9 94.9 1.5
Radio and television
broadcasting ... 164.2 2.7 53.6 3.6 86.3 4.2 24.3 0.7
Pay television & other
communications ... 189.7 4.3 14.4 2.1 104.7 9.1 70.6 2.5
Level Industry
BLS to begin publishing employment data specifically for cable and other pay television services (The composite in-dustry “pay television and other communications” used in this study includes telegraph and other communications, such as radar and satellite tracking, and communications services, not elsewhere classified.) In early 1988, employment in cable and other pay television services (SIC 484) about equaled that of television broadcasting stations (SIC 4833); by the end of the year, cable employment exceeded that of television broad-casters. The gap continued to widen over the next decade, with employment in cable and other pay television services growing by an average of 5.6 percent per year. In contrast, television broadcasting stations grew by only 1.7 percent an-nually over the same period. (See chart 2.)
In summary, from 1958 through 1972, the maturing radio and television broadcasting industry added jobs more rapidly than cable and other pay television services. Over the next 12 years, both industries grew much faster, with pay television (9.1 percent) outpacing radio and television broadcasting (4.2 percent). After 1984, the employment trends in both series slowed until the early 1990s, when they began to accelerate after 1992, especially in pay television and other communi-cations. From 1988 forward, cable and other pay television services (SIC 4841) maintained relatively steady annual growth, as its employment level surpassed and pulled away from that
of television broadcasting. In 8 of the last 11 years, employ-ment in cable and other pay television services has grown by 4 percent or more. By 1999, there were 52 percent more workers in cable and other pay television services than in television broadcasting stations.
The growth of cable television
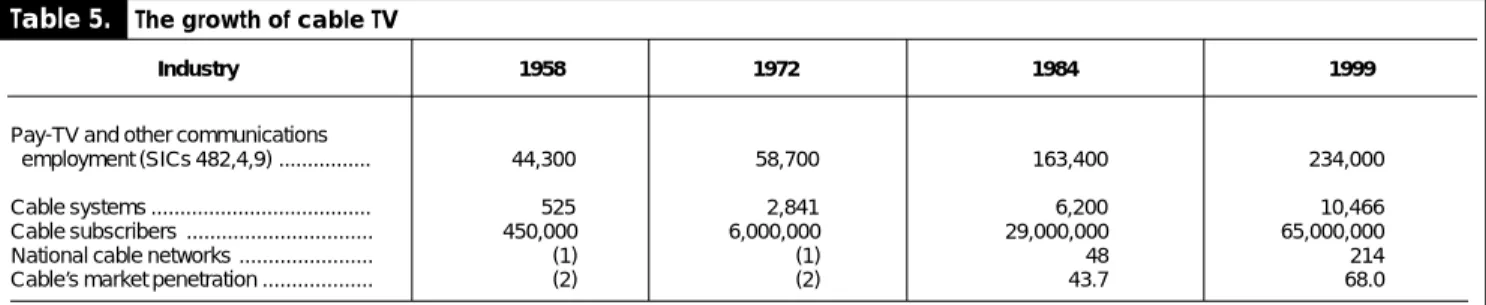
In addition to rapid employment growth, other statistics docu-ment growth in the cable television industry. By 1999, two-thirds of households with televisions subscribed to cable ser-vices. The growth of cable subscribers mirrors that of the industry’s employment until the mid-1980s. While employ-ment stagnated until after the 1990–91 recession, the num-ber of subscrinum-bers continued to expand, with more than 65 million households subscribing to cable television in 1999.18(See table 5.)
Cable systems, which provide service in a given geographic area and generally serve 50,000 or more subscribers,19grew more rapidly over the period than television broadcasting sta-tions, cable’s main competition. In 1958, there were approxi-mately equal numbers of television broadcasting stations and cable systems. Since then, annual growth for television sta-tions averaged only 2.8 percent through 1999, compared with 7.7 percent for cable systems. (See chart 3). The growth of
[Levels in thousands]
Industry
Employment change in the television and radio communications industry, selected periods, 1958–99
Chart 2. Employment in cable and other pay television versus broadcast television, 1988 99 [In thousands] 1988 1989 1990 1991 1992 1993 1994 1995 1996 1997 1998 1999 100 120 140 160 180 200 100 120 140 160 180 200
Cable and other pay television
Broadcast television [In thousands] 1958 1962 1966 1970 1974 1978 1982 1986 1990 1994 1998 0 50 100 150 200 250 300 0 50 100 150 200 250 300
Employment in ra dio a nd te le vision broa dca sting ve rsus ca ble a nd othe r pa y tele vison service s, 1958 99
Radio and television broadcasting
Cable and other pay television services
Cable Rules of 1972 Cable Act of 1984
Cha rt 1.
Table 5. The growth of cable TV
1958 1972 1984 1999
Pay-TV and other communications ...
employment (SICs 482,4,9) ... 44,300 58,700 163,400 234,000
...
Cable systems ... 525 2,841 6,200 10,466
Cable subscribers ... 450,000 6,000,000 29,000,000 65,000,000
National cable networks ... (1) (1) 48 214
Cable’s market penetration ... (2) (2) 43.7 68.0
1 Cable network data begin in 1976, when the number totaled 4. 2 Market penetration data begin in 1975, with 13.2 percent penetration.
SOURCES: Employment data: BLS Division of Monthly Industry
Employ-ment Statistics. Systems, Subscibers: Warren Publishing, Inc., Television &
Cable Factbook, Services Volume No. 67, 1999. Networks: National Cable Television Association, Cable Television Developments, Spring/Summer 2000. Market Penetration: Nielsen Media Research, from NCTA’s Cable Television Developments, Spring/Summer 2000.
Industry
cable systems accelerated during the 1980s, but it leveled off in the 1990s, due mainly to a wave of consolidation in the industry.20
Although closely related, it is the greater number of chan-nel choices with better reception that sets the cable market apart from regular television broadcasting. Today, cable op-erators provide video programming to their customers using satellite earth stations and coaxial cable or fiber optics as the main lines for transmitting television signals. This advanced technology did not exist during the early years of television and prevented rapid expansion in the number of video pro-grams offered by cable distributors.
The early years of television
Six television broadcasting stations were in operation in 1946,21 and the earliest cable systems were built during the following 4 years. These latter systems were constructed to serve homes on the “fringe” of the broadcast area, those who otherwise would not be able to receive clear signals from the television station. Cable distributors placed community an-tennas on mountain tops or other high points and connected homes to the towers with cables, allowing them to receive broadcast signals.22
At the time, cable television was a very labor-intensive business, and despite high demand, it was difficult to find enough capital to launch a new cable enterprise. Another obstacle faced by the cable pioneers was obtaining permis-sion to use public rights-of-way and utility poles.23 Cable television was a simple application of available technology in the early years, and operators were capable of carrying only a few channels, because of the primitive transmission technology involved and the relatively sparse number of broadcast signals to retransmit.24
Cable television went largely unregulated until the mid-1960s. In their book on the industry, Patrick R. Parsons and Robert M. Frieden identify several historical phases of cable television within the period from 1947 to 1972. During the initial 5 years of this era, the first modern systems began to install wire-based television. After that, many family-owned,
“Mom-’n-Pop” operations sprouted up until about 1964. Fi-nally, during the 8 years ending in 1972, the FCC began insti-tuting rules regulating cable television.24 Nevertheless, cable television continued to expand, but not without growing pains. Regulation in the industry, 1940–72. By 1940, the FCC had tested on-air television stations and authorized limited com-mercial television operation.26 Regulation of television oc-curred because the broadcast spectrum was a publicly owned, but limited resource. 27 From 1948 to 1952, the FCC placed a 4-year freeze on awarding licenses for new television broad-casting stations. The airwaves were becoming congested, and the FCC needed more time to sort out issues on standards.28 Meanwhile, largely due to the freeze, demand for cable televi-sion services increased in areas not yet served by any form of television, and cable systems responded by forwarding broad-cast signals to these additional communities.
In 1958, the FCC took the position that it had no jurisdiction over cable television, because the cable operator simply pro-vided a piece of equipment and did not carry a signal.29 As cable grew, however, local television stations regarded the importation of distant signals as a competitive threat. Because cable opera-tors received broadcast signals essentially free of charge, addi-tional stations in a viewing area could fragment local advertising dollars and drive the local broadcaster off the air.30 Heavy lob-bying ensued on both sides.
A year later, the FCC launched its first study on how the cable television industry affected the television broadcast-ing market, but nothbroadcast-ing was found that could be used to restrict the entry or continuation of cable systems.31 By the mid-1960s, however, the FCC had become the regula-tory authority over cable television. In 1962, the Commis-sion ruled that cable operators could use microwave sys-tems to relay distant broadcast signals, with the provision that there be no adverse economic effects on broadcast-ers.31 In 1966, the FCC froze the expansion of all cable firms in the top 100 markets and stipulated that cable systems obtain the consent of any remote broadcast station before importing that channel and distributing it to viewers.33
monopoly: an entity that incurs significant economies of scale as output (the number of subscribers) increases.34 Local franchising authorities granted these monopolies on the basis that inefficiencies, such as redundant line du-plication, would have arisen if more than one firm pro-vided video programming.
Although the first formal FCC restrictions on cable were in place by the late 1960s, the cable industry had managed to evolve from a transmission service to an active player in the video program delivery market. More specifically, chan-nel capacity had risen from 3 or 4 to about a dozen.35 Cable television was basically reborn, and as the financial health of the industry improved, larger businesses, and their capital, were increasingly attracted to cable. By the mid-1960s, televi-sion broadcasters themselves owned nearly 30 percent of all cable systems.36
Cable and satellite growth, 1972–84
After several years of restricting cable firms from receiving and distributing long distance television broadcasting signals, in March 1972 the FCC issued new rules that eased some of the limitations and restrictions—the Cable Rules of 1972. Cable firms were granted permission to import distant sig-nals into major markets, but they were still limited in terms of quantity and variety.37
The early and more restrictive pay television rules limited
cable operators’ ability to offer better products outside of broadcast channels. With the introduction of satellite tech-nology in the industry, cable television gained the support of a communications network in the sky, ushering in a new era in video program delivery. The first use of satellites allowed for more long-range capture of remote broadcast signals. In 1975, Home Box Office (HBO) rented a satellite to distribute a boxing program to cable systems in Florida and Mississippi.38 The fusion of cable and satellite technology permanently changed the way television is viewed in the United States. Satellites allowed cable franchises to expand channel capacity and offer more programming alternatives. Similar to the earlier effect of cable television on the entire television market, the eventual role of satellites in the video programming service industry would change from a program delivery tool to a distri-bution competitor. New channels, ESPN and MTV for example, targeted special interest groups such as sports enthusiasts and teenagers. In short, cable became a more marketable ser-vice after satellites were introduced, and the growth of cable television accelerated.
The extensive cable satellite system also attracted more advertisers because it allowed for a larger audience base. Us-ing satellite technology, for example, Ted Turner was able to expand his local television broadcasting station into a national cable network and thus sell advertising at more lucrative rates. In 1975, WTBS became the first satellite-delivered broadcast station and soon became known as the first “superstation.”39
Chart 3. Index of growth of ca ble systems a nd television broadca sting stations, 1958 99
Index 1958 = 100 Index 1958 = 100 1958 1962 1966 1970 1974 1978 1982 1986 1990 1994 1998 0 500 1,000 1,500 2,000 2,500 0 500 1,000 1,500 2,000 2,500 Cable systems
Television broadcasting stations
. Top company ... 24.0 25.2 24.8 29.3 Top 2 companies ... 36.7 37.9 37.3 47.7 Top 3 companies ... 42.0 43.2 42.4 55.6 Top 4 companies ... 45.6 48.2 47.2 62.3 Top 10 companies ... 61.6 64.6 63.3 79.8 Ranking
Today, superstation TBS has about 75 million subscribers and roughly 12,000 affiliates nationwide.40
Rising demand for television entertainment, marketing ef-forts, and technological innovations furthered the growth of cable television in the 1970s and early 1980s. HBO became the nation’s first pay television network and created the first tele-vision production originated by a cable company. Their parent company, Time Inc., invested in motion picture production to differentiate Home Box Office as a premium channel and to improve the quality and quantity of movies available on HBO.41 The Cable News Network (CNN) became the first all-news cable channel, when it began satellite service in 1980.42 More va-riety and better services meant more revenue for cable firms, which in turn meant more growth for the industry. With satel-lite technology firmly entrenched, the number of cable sys-tems had grown to 6,200 by 1984. Cable networks, number-ing only 4 in 1976, numbered 48 in 1984. (See table 5.) Deregulation and consolidation, 1984–99 Key legal aspects of the cable television industry were clari-fied when Congress enacted the Cable Communications Policy Act of 1984, which deregulated the industry further and re-versed many of the restrictions from 1972. The purpose of the 1984 Cable Act was to streamline the expansion of cable sys-tems and promote competition.43 After some consideration, the FCC concluded that less cable regulation was needed. Spe-cifically, the Commission no longer regulated cable rates in markets where sufficient competition existed, but cross-own-ership of a cable and broadcast system was disallowed.44 The FCC contended that as cable service grew, rates charged to customers would be checked by competition from develop-ing video delivery alternatives, such as home satellites and videocassette rentals.
The 1980s were characterized by increased competition be-tween television broadcasters and cable operators. Meanwhile, decreased viewing time for all forms of television further
compli-cated the issue.45 Among other things, videocassette recorders (VCRs) reduced time spent watching cable and broadcast televi-sion—the number of VCRs in use increased from 15.5 million in 1984 to 170.3 million in 1998.46 In addition, new alternatives to cable and television broadcasting, such as home satellites, struggled to make their way into the video market.47 Despite the move toward other viewing options, basic cable networks still managed to gain ground relative to over-the-air television broadcasters.48 (See chart 4.)
In the 1990s, cable system ownership became more concen-trated, due to the many mergers and acquisitions that took place during the period, and this activity tended to dampen growth, especially that of employment. Time Warner, for ex-ample, merged with Turner Broadcasting Systems in 1996.49 On the programming side, the Walt Disney Company acquired Capital Cities/ABC and Westinghouse bought CBS.50 In 1975, the top 10 cable companies supplied 40 percent of all cable television subscribers.51 According to a later source of in-dustry concentration data, by 1997, the market share of the top 10 cable companies had doubled to 80 percent. (See table 6.) Also, in 1992, multiple cable system operators owned all or part of 15 of the 25 largest cable networks.52
In response to the accumulated market power of cable tele-vision operators, Congress enacted the Cable Teletele-vision Con-sumer Protection and Competition Act of 1992. More restric-tive measures were implemented in the following years and included rate regulation in the absence of effective competi-tion, the prohibition of exclusive franchising, and must-carry rules, which obligated cable operators to carry all available local broadcast signals.53
Technological advances. While competition from other video viewing options served to slow growth, technological innovation continued to play a large role in the maturation and competitive status of the cable television industry. Fiber optics, a key breakthrough that took place during the 1980s, enabled faster and better quality cable connections. Further technical improvements, such as digital compression tech-nology, allowed more system capacity,54 and numerous new cable channels, such as Disney, The Weather Channel, and Discovery, entered the market.55
With the proliferation of cable television channels, over-the-air television audiences became more fragmented, and ad-vertising revenues increasingly were diverted to cable. “Narrowcasting” allowed advertisers to target specific niche audiences that come with unique cable channels.56 More than one-third of all television advertising dollars were directed toward cable audiences in 1997, compared with only 6 per-cent in 1984.57 New products—such as NFL football on cable, “at-home” shopping, video-on-demand, and even the cover-age of the Gulf War by CNN—served to increase the popular-ity of cable among consumers as well.58 The number of cable subscriptions continued to grow despite hikes in cable
tele-SOURCE: Paul Kagan Associates, Inc., cited in Annual Assessment of the Status of Competition in the Market for the Delivery of Video Program-ming: Fourth Annual Report, FCC 97–423 (Federal Communications Com-mission, January 2000), p. E-4.
Cable industry concentration ratios, 1990–97
Market share [In percent]
Table 6
—
Cha rt 5. Consumer Price Index (CPI) for cable television and for a ll urba n consumers, annual a vera ges, 1983 99
Index 1982/84 = 100 1983 1984 1985 1986 1987 1988 1989 1990 1991 1992 1993 1994 1995 1996 1997 1998 1999 100 150 200 250 100 150 200 250 Index 1982/84 = 100
Cable television CPI
CPI for all urban consumers
Cha rt 4. Television viewing sha res: ca ble versus broadcast television, 1985 99
Percent Percent 1985 1986 1987 1988 1989 1990 1991 1992 1993 1994 1995 1996 1997 1998 1999 0 10 20 30 40 50 60 70 0 10 20 30 40 50 60 70 Cable television Broadcast television
SOURCE: Cable TV Facts 2000 (Cabletelevision Advertising Bureau, 2000), on the Internet at http://www.cabletvadbureau.com (visited July 2000).
vision prices, which since the early 1980s have risen more than twice as rapidly as the Consumer Price Index for all Ur-ban Consumers (CPI-U). (See chart 5.) Despite climbing pro-gramming costs—as cable networks began charging local systems for program content, whereas previously the net-works had paid the local systems to get in their channel lineup—by the late 1980s, the revenue picture appeared to be quite rosy for the cable industry.59
Cable companies made use of their increased revenues by investing in plant and equipment, and in programming. From 1984 through 1992, the cable industry spent more than $15 billion on hardware.60 Similarly, cable systems’ programming expenditures rose more than 300 percent to $7.5 billion from 1984 to 1998.61 These investments improved the competi-tive position of cable relacompeti-tive to that of broadcasters.
Following the 1992 legislation, and as the U.S. economy began recovering from the 1990–91 recession, the trend in video delivery programming began to change once again. This time the move was from “cable” to “other” in the cable and other pay television industry. Like the first cable television customers who were out of reach from a strong broadcast television signal, direct-to-home satellite services initially served viewers who were not able to receive cable television services from an operator in their geographic area.
Similarly, the technological and market history tended to repeat itself as direct-to-home satellite service customers soon enjoyed better picture quality and more channels than cable or broadcasters offered. These new services also de-veloped a technological advantage in the form of digital tele-vision service.62 Just as cable accompanied the development of television broadcasting, the same held for satellites with respect to cable television’s growth. In both cases, the older industry was at first helped by the new technology, only to later find itself in direct competition with the younger form of video distribution.
The Telecommunications Act of 1996. The television indus-try was further deregulated when Congress passed the Tele-communications Act of 1996, which was intended to provide a “pro-competitive national policy framework.”63 The act also sought to remove additional barriers to competitive entry in order to expedite competition with other multi-channel video programming deliverers.
Cable rates were deregulated on their extended basic tier, which included specialty channels such as ESPN, MTV, and
TNT. The rates were no longer regulated if a telephone com-pany, for example, offered cable service comparable to those of the competing cable system.64 Finally, the FCC was given the authority to suspend its rules on a short-term basis in order to promote new or improved technology or services.65 This opening to more competition and better technology proved to be a double-edged sword for cable companies in the 1990s. Direct Broadcast Satellite, for example, began to move into
both cable and television broadcasting stations markets. Information and entertainment. Industry classifications sepa-rating the delivery of information from that of entertainment became blurred in recent years, creating a new kind of video product, sometimes called infotainment. Firms began “bundling” their services—a single company might offer cable television, local and long-distance phone service, and Internet access, for example. These “full-service” telecommunications enterprises are expected to become increasingly prevalent, as technology continues to improve with the change from analog to digital distribution.66 Cable television providers expanded their ser-vices by offering quicker access to the Internet, using high speed cable modems rather than regular telephone lines. Similarly, television broadcasting companies improved their strategic po-sition by investing in cable networks, such as when the National Broadcasting Company and Microsoft began MSNBC, a 24-hour cable news network.67 In addition, the satellite market was at-tractive enough that AT&T purchased a 2.5-percent equity stake in DirecTV in 1996.68
Many cable firms reacted by offering new channels and bet-ter service as a direct result of new competition from satellite television providers. Cable was able to increase its program-ming services by enabling digital compression technology for the first time. The technological cycle had come full circle: Satellites or other pay television services were able to offer better picture quality and increased channel capacity, just as cable services had enjoyed an advantage over broadcast televi-sion in the early years of the industry.
EMPLOYMENTINTHETELEVISIONINDUSTRY has grown immensely since 1958, with radio and television broadcasting leading the way up to 1972, and pay television and other communications adding more jobs since then. The latter industry, however, cur-rently still trails slightly in terms of the total number of work-ers. Looking at the more specific industry data available since 1988, job creation in cable and other pay television services has outpaced that of television broadcasting. Although the two industries had similar employment levels in 1988, cable had added 52 percent more jobs than broadcast television by 1999. Workers in cable and other pay television services earn less per hour than their broadcast television counterparts, but they also tend to work more hours per week. The occupational make-up of the two industries is quite different, with installers and re-pairers leading the list for pay television, while announcers make up the leading occupation in radio and television broadcasting. For more than 40 years, the employment and market trends in broadcast and cable television have gone through unique phases, as both industries matured at different times. Cable television began as a rural-based supplement to broadcast television, but increased demand and technological innovations spurred tremendous growth in the industry. Legislation and regu-lation in the industry both checked and boosted cable television
expansion. The establishment of a national cable and satel-lite distribution network followed the relaxation of some of the more restrictive policies. Technical advantages enabled cable to eventually exercise a certain degree of market power over broadcast television in their respective geographic mar-kets.
As cable systems improved their market positions, they responded by upgrading their infrastructure and improving their service levels, channel capacity, and reception quality.
1 Robert L. Hilliard and Michael C. Keith, The Broadcast Century: A
Biog-raphy of American Broadcasting (Stoneham, MA, Butterworth-Heinemann,
1992), p. 88.
2 Hilliard and Keith, The Broadcast Century, p. 150.
3 Annual Assessment of the Status of Competition in Markets for the
Delivery of Video Programming: Sixth Annual Report, FCC 99–418 (Federal
Communications Commission, January 2000), appendix B, table B-1.
4 See Federal Communications Commission Fact Sheet: Cable Television
Information Bulletin, June 2000, on the Internet at http:www.fcc.gov/csb/facts/
csgen.html (visited July 2000), pp. 1–2.
5 Federal Communications Commission Fact Sheet: Cable Television, p.
2.
6 Standard Industrial Classification Manual: 1987 (Executive Office of
the President, Office of Management and Budget, 1987), p. 283.
7 Standard Industrial Classification Manual: 1987, p. 283.
8 These data are from the BLS Occupational Employment Statistics
(OES) survey, “a periodic mail survey of nonfarm establishments that collects occupational employment data on workers by industry;” see BLS
Handbook of Methods, bulletin 2490 (Bureau of Labor Statistics, April
1997), ch. 3, pp. 32–35.
9 Average hourly earnings data are from the Current Employment
Statis-tics (CES) Program. Average hourly earnings are gross payrolls (including premium pay such as overtime) divided by total paid hours. Therefore, average hourly earnings differ from wage rates, which are the payments for a unit of time worked. Retroactive payments, irregular bonuses, and benefits are excluded. The data are for nonsupervisory workers only.
10 For more information on the
CES, see “Employment, hours, and earnings from the establishment survey,” in BLS Handbook of Methods, bulletin 2490
(Bureau of Labor Statistics, April 1997), ch. 2, pp. 15–31. From the
Hand-book (p. 15): “BLS cooperates with State employment security agencies in
the Current Employment Statistics (CES) survey to collect data each month on employment, hours, and earnings from a sample of nonfarm establish-ments (including government). In early 1996, this sample included over 390,000 reporting units. From these data, a large number of employment, hours, and earnings series in considerable industry and geographic detail are prepared and published each month [by BLS].”
11 The industry group “cable and other pay television services” was not
classified independently until 1987, when the SIC system was revised with the publication of the new Standard Industrial Classification Manual: 1987.
12 Other pay-TV services include, but are not limited to, closed circuit
televi-sion, multichannel multipoint distribution systems, satellite master antenna sys-tems, direct broadcast satellite, and other home satellite dishes.
13 Federal Communications Commission Fact Sheet: Cable Television, p. 2. 14 Ibid., p. 2.
15 Patrick R. Parsons and Robert M. Frieden, The Cable and Satellite
Television Industries (Needham Heights, MA, Allyn and Bacon, 1998), p. 56.
16 Federal Communications Commission Fact Sheet: Cable Television, p. 2. 17 Ibid., p. 2; where it also says that “The 1984 Cable Act established
poli-cies in the areas of ownership, channel usage, franchise provisions and re-newals, subscriber rates and privacy, obscenity and lockboxes, unauthorized reception of services, equal employment opportunity, and pole attachments. The new law also defined jurisdictional boundaries among Federal, State and local authorities for regulating cable television systems.”
18 Television and Cable Factbook (Washington,
DC, Warren Publishing, Inc., 1999), p. J-96.
19 Television and Cable Factbook, p. J-97.
20 Paul Kagan Associates, Inc., cited in Annual Assessment of the Status of
Competition in the Market for the Delivery of Video Programming: Fourth
Annual Report, FCC 97–423 (Federal Communications Commission, January
2000), p. E-4.
21 Television and Cable Factbook, p. J-97.
22 National Cable Television Association, The History of Cable
Televi-sion information sheet, on the Internet at www.ncta.com/glance.html
(vis-ited July 2000).
23 Parsons and Frieden, The Cable and Satellite Television Industries, p.
33.
24 Robert W. Crandall and Harold Furchtgott-Roth, Cable TV: Regulation or
Competition? (Washington, DC, The Brookings Institution, 1996), pp. 2–3.
25 Parsons and Frieden, The Cable and Satellite Television Industries, p.
20.
26 Hilliard and Keith, The Broadcast Century, p. 92.
27 Douglas F. Greer, Industrial Organization and Public Policy, 2nd ed.
(New York, NY, Macmillan Publishing Company, 1984). p. 436.
28 Parsons and Frieden, The Cable and Satellite Television Industries, p.
27.
29 Ibid., p. 38. 30 Ibid., p. 36.
31 Inquiry into the Impact of Community Antenna Systems, quoted at
The National Cable Television Center and Museum website, on the Internet at http://www.cablecenter.org (visited August 1999).
32 Parsons and Frieden, The Cable and Satellite Television Industries,
pp. 42–43.
33 Ibid., p. 44.
34 Greer, Industrial Organization and Public Policy, pp. 434–35. 35 Parsons and Frieden, The Cable and Satellite Television Industries,
p. 45.
36 From Television Magazine, March 1967, cited in Parsons and Frieden,
The Cable and Satellite Television Industries, p. 47.
37 Parsons and Frieden, The Cable and Satellite Television Industries, p. 49.
Strong job growth continued. Meanwhile, competition from telephone companies, utilities, wireless industries, and home satellites began to provide rivalry in the market for video program delivery, as these related industries crossed over or entered into pay television. Today, cable, broadcast, and other television services continue to both influence and adapt to the rapidly changing world of telecommunications. If tech-nology keeps pace with demand, employment in the industry should continue to expand as well.69
38 Ibid., pp. 53–54. 39 Ibid., pp. 53–55.
40 Cable TV Developments (National Cable Television Association), fall 1998/
winter 1999.
41 The National Cable Television Center and Museum website, on the Internet
at http://www.cablecenter.org (visited August 1998).
42 Hilliard and Keith, The Broadcast Century, p. 230.
43 Cable Communications Policy Act of 1984, Public Law 98-549, 98th
Congress, Sec 601, Title VI, Part I, General Provisions, Purposes, 47 USC 521.
44 Cable Communications Policy Act of 1984, Sec 623, 622, 613, and 634. 45 J. Fred MacDonald, One Nation Under Television (New York,
NY, Pan-theon Books, 1990). p. 258.
46 Television and Cable Factbook, 1999, p. J–3.
47 Parsons and Frieden, The Cable and Satellite Television Industries,
p. 60.
48 Nielsen ratings, cited in Cable TV Developments (National Cable
Televi-sion Association), spring/summer 2000, p. 5.
49 Parsons and Frieden, The Cable and Satellite Television Industries,
p. 16.
50 James Walker and Douglas Ferguson, The Broadcast Television
Indus-try, (Needham Heights, MA, Allyn and Bacon, 1998). p.37.
51 Crandall and Furchtgott-Roth, p. 9. 52 Crandall and Furchtgott-Roth, p. 15.
53 Cable Television Consumer Protection and Competition Act of 1992,
Pub-lic Law 102–385, 102nd Congress, Oct. 5, 1992.
54 The National Cable Television Center and Museum website, on the Internet
at http://www.cablecenter.org (visited August 1998).
55 Communications Engineering and Design (
CED) magazine website, on the Internet at http://www.cedmagazine.com/retro/eighties.html (visited June 1998).
56 MacDonald, One Nation Under Television, p. 254. 57 Television and Cable Factbook, p. J-12.
58 The National Cable Television Center and Museum, on the Internet at
http://www.cablecenter.org (visited, August 1998).
59 Cable TV Developments (National Cable Television Association), fall,
1997, p. 8.
60 National Cable Television Association information sheet on the 1980s. 61 Cable TV Developments (National Cable Television Association), fall 1998/
winter 1999.
62 Parsons and Frieden, The Cable and Satellite Television Industries, p.14. 63 Annual Assessment of the Status of Competition in the Market for the
Delivery of Video Programming: Third Annual Report, CS Docket No. 96–133
(Federal Communications Commission, January 1997), sec. 2, par. 5.
64 Telecommunications Act of 1996, 104th Congress, Jan. 3, 1996, S.652,
section 301.
65 Telecommunications Act of 1996, 104th Congress, Jan. 3, 1996, S.652,
section 303.
66 Parsons and Frieden, The Cable and Satellite Television Industries, p.12. 67 The National Cable Television Center and Museum web site: http://
www.cablecenter.org (visited August 1998).
68 Parsons and Frieden, The Cable and Satellite Television Industries,
p. 134.
69 A discussion of the outlook for jobs in both the broadcast and cable
television industries can be found in Career Guide to Industries: 2001–01