Determinants of Group
Health Insurance Demand
Jorge Muñoz Pérez
Instituto Tecnológico Autónomo de México mupjo80@yahoo.com.mx
and Tapen Sinha
ING Chair Professor, Department of Actuarial Studies Instituto Tecnológico Autónomo de México
Professor, School of Business University of Nottingham
tapen@itam.mx
Abstract: We examine the determinants of claims for a group health care plan. Since all persons in the group are covered, the premium does not enter the consideration of
demand in this case. Hence, we are able to isolate other variables that affect the demand for health insurance. We show that income of the employees affect the claims in an unexpected way.
Acknowledgement: We thank the Instituto Tecnológico Autónomo de México (ITAM) and the Asociación Mexicana de Cultura AC for their generous support of our research. The results were presented at the Actuarial Research Conference in Montreal in 2006.
Introduction
In most developed countries, group health insurance account for a large
proportion of health insurance sold. Yet, decision-making about health insurance inside a company is very little researched. Most often, insurance companies simply base their pricing on past experience of average losses, add a markup and use that as a rule of thumb. If, in a given year, they experience losses, they simply adjust their price for the following year upward without analyzing the root cause of loss experienced.
If individual health policies are bought, health insurance companies will raise the premium if losses are experienced or they might refuse to renew the contract. In case of large group policies, health insurance companies are reluctant to do that. They attribute sudden increase of losses due to chance occurrence. They are extremely reluctant to lose large block of business.
From the point of view of insured persons within a group policy, they remain covered regardless of how much they claim in a given year. To put it differently, once an employee in a given company is covered, the health insurance company can no longer charge extra for a given employee simply because there was a large claim by a particular employee. Therefore, the demand for health insurance for a given employee no longer depends on the price (the premium) paid. However, it does depend on the socioeconomic characteristics of the employees. In this paper, we investigate the importance of these factors other than the price of the product – health insurance.
Characteristics of the dataset
The data set contains information concerning 42,237 employees and their dependents. There is only one company data used in this entire study. Therefore, the premium charged per employee is exactly the same regardless of the use of the service. It does not vary from person to person. In our dataset, the dependents are the partners and the children of all the employees. The age for employees and partners ranges from 15 to 69 years old. On the other hand, the age range for children ranges from just-born and 24 years old – as by law, only children up to age 24 can be claimed as dependents.
This insurance has the following coverage for any illness or accident covered by the policy: hospital expenses, doctor and medicine expenses. For each person, we have the following information: sex of the person, age of the person, the relation with the employee if the person is not the employee and the income of the employee. We consider the employee and the dependents as one unit so we assigned the income of the employee to his or her dependents.
For each employee, we also have information about claims made. The information about claims during a given year is: amount of claim if any, reason for making a claim, days in hospital and the form of payment. The reason for a claim could be due to an accident or sickness. The form of payment could be direct or reimbursement. It is direct when the insurance company pays to the hospital and the doctors directly; and reimbursement when the insured employee first pay the expenses out of pocket and then the insurance company reimburse him or her the money.
Figure 1: Distribution by sex and age
8.29% 6.99% 5.24% 2.79%
4.13% 6.37%
7.71% 5.43% 2.82% 0.28%
0.87% 0.09%
2.27% 4.58% 7.19%
6.51% 4.31%
2.95% 4.97% 6.48% 7.92%
1.21% 0.40% 0.16%
0 - 4 years 5 - 9 years 10 - 14 years 15 - 19 years 20 - 24 years 25 - 29 years 30 - 34 years 35 - 39 years 40 - 44 years 45 - 49 years 50 - 54 years 55 - 59 years
WOMEN MEN
Figure 1 shows the population distribution by sex and age of our sample. It is bimodal. The largest concentration is in the ages between 25 and 34 for both sexes. In this range, the employees and their partners are concentrated. The other concentration is in the zero to four years. In this range, the children of these employees are located. Overall, this population is relatively young. We have few people above 50 years old and the mean age is 20.8 years old.
There are 12,538 employees in our sample. The sample is made up of 30% employees, 23% of partners and 47% children of the employees. By income, 40% of employees earn less than 5,000 pesos a month, another 50% earned between 5,001 and 20,000 pesos a month and the rest earned more than 20,001 pesos a month with a maximum of 500,000 pesos a month.
By sex, there are 48% females and 52% males. In Table 1, we examine the broad distribution of cost between males and females. For males, frequency of claims and the average amount are both lower.
Table 1: Claim by sex
Sex Amount % No. cases %
Female 32,538,662.39 54.07% 1,807 58.18%
Male 27,638,558.68 45.93% 1,299 41.82%
Total 60,177,221.07 3,106
Table 2: Claims distribution by age and sex
Age Frequency Mean Amount Claim Cost Frequency Mean Amount Claim Cost
0 - 4 years 5.17% 12,836.44 664.09 6.28% 14,487.47 910.38 5 - 9 years 4.05% 14,287.96 579.03 4.57% 11,980.59 547.89 10 - 14 years 2.43% 13,176.48 319.85 3.39% 22,971.71 777.82 15 - 19 years 5.22% 17,542.19 915.86 4.50% 17,697.74 795.57 20 - 24 years 9.72% 15,832.21 1,538.88 3.90% 19,295.39 751.91 25 - 29 years 14.37% 18,230.13 2,619.46 5.87% 21,679.55 1,273.37 30 - 34 years 14.85% 19,373.82 2,876.10 7.06% 24,073.81 1,700.02 35 - 39 years 11.16% 17,556.92 1,959.84 7.76% 25,222.38 1,957.95 40 - 44 years 9.59% 25,395.26 2,436.25 8.31% 23,562.21 1,958.57 45 - 49 years 12.84% 23,998.09 3,081.72 10.39% 39,308.20 4,084.97 50 - 54 years 16.81% 20,255.86 3,404.35 11.24% 36,162.57 4,065.61 55 - 59 years 24.32% 57,474.66 13,980.32 16.42% 27,816.26 4,566.85
Total 8.83% 18,007.01 1,590.35 5.97% 25,049.01 1,494.18
F E M A L E M A L E
In Table 2, we break down the claims by age and sex. We have the frequency (for each group), the mean amount and the claim cost for each age group divided by sex. As the age of the person rises from 0 to 4 years to higher ages, the frequency and the mean amount of claims fall for both males and females. But, for age ranges above fifteen years olds, it begins to increase almost monotonically. Furthermore, average claims cost for
females is greater than male ones in almost every age range. This result is somewhat surprising given that women live longer than men, on the average.
Figure 2: Average claims by age for males and females
0.00 2,000.00 4,000.00 6,000.00 8,000.00 10,000.00 12,000.00 14,000.00
0 - 4 5 - 9 10 - 14 15 - 19 20 - 24 25 - 29 30 - 34 35 - 39 40 - 44 45 - 49 50 - 54 55 - 59
Female Male
Figure 2 details claims by age ranges and sex. There are two striking features. First, claims between the ages 20 to 39 for females increase. This is easily explained by the fact that these are the childbearing years for women. Second, we can observe unusually high claims rates at the age range of 55 for the females.
Table 3: Who claims what – employees, partners and children
Relationship Amount No. Cases Frecuency Average Claim Claim Cost
Employee 23,791,948.88 1,081 8.62% 22,009.20 1,897.59 Partner 22,267,958.14 1,104 11.44% 20,170.25 2,307.08 Children 14,117,314.05 921 4.59% 15,328.25 704.21
Table 3 shows the amount, the number of cases, the frequency, the mean amount and the claim cost by relation: employee, partner and children. The biggest per capita claims come from the partners of the employees and the lowest comes from the children. Hence, the partners represent a riskiest segment for the insurance.
Table 4: Distribution of claims cost by levels of income
Minimum Maximum Amount Frecuency Average Claim Claim Cost
0.00 2,500.00 861,203.810 3.63% 23,275.78 844.32 2,501.00
5,000.00 16,593,011.860 5.36% 17,938.39 961.58 5,001.00
7,500.00 5,332,977.560 5.17% 17,717.53 916.48 7,501.00
10,000.00 4,558,118.830 6.26% 19,071.63 1,193.54 10,001.00
15,000.00 9,774,139.570 8.96% 17,803.53 1,595.00 15,001.00
20,000.00 6,361,269.830 11.54% 19,276.58 2,225.00 20,001.00
25,000.00 4,026,273.170 13.16% 19,736.63 2,597.60
25,001.00
30,000.00 2,286,509.180 11.81% 18,741.88 2,213.46
30,001.00
37,000.00 1,955,855.950 12.10% 22,481.10 2,720.24
37,001.00
44,000.00 1,435,231.410 14.22% 24,325.96 3,458.39
44,001.00
50,000.00 984,217.810 12.76% 39,368.71 5,021.52
50,001.00
100,000.00 3,076,890.220 16.70% 20,931.23 3,496.47
100,001.00
500,000.00 2,931,521.870 14.92% 36,191.63 5,398.75
Total 60,177,221.07 Income
Table 4 displays the amount, frequency, mean amount and the claims by ranges of income. It shows that the claims frequency and the mean claims steadily rises with the level of income of the employees. To put it differently, higher income employees have more frequent claims and the average claims rise with the level of income of the
employees. As we shall see later, even after accounting for other factors, this relationship holds: high-income employees claim more.
Table 5: Claims by cause
Cause Amount No. Cases Mean Amount
Accident 9,263,583.83 692 13,386.68 Sickness 50,913,637.24 2,414 21,090.98 Total 60,177,221.07 3,106 19,374.51
Table 5 describes a classification of claims by cause. Sicknesses account for four times as many cases as accidents. Moreover, the claims made due to sickness is almost double that of claims due to accidents.
Table 6: Claims by types of payment
Form of Payment Amount No. Cases Mean Amount
Direct 50,766,024.05 2,047 24,800.21 Reimbursement 9,411,197.02 1,059 8,886.87 Total 60,177,221.07 3,106
Table 6 describes claims by types of payment. There is a clear preference for direct payment over reimbursement. Direct payment cost averages three times as much per claim and twice as many cases.
Models
Our basic question is: what factors affect claims of the employees? To answer that question we posit a general model of the following form:
General form: Claims = β0 + β1Age + β2 Sex + β3 Relation to Employee + β4Income +
β5Cause + β6Hospital Days + β7Form of Pay
We run four different regression models. First, we run a model with the entire group for persons with positive claims. Second, observing that low claims display a different behavior than high claims, we run separate regressions for claims under 50,000 pesos and claims over 50,000 pesos. Finally, we run a Tobit model given the censored
nature of the data. We experiment with different transformations of each variable as some of the variables appear very skewed.
We have two sets of data in categorical form: sex and relationship with the employees. So, to make the model operational, we assign: male = 0, female = 1 and the relationship with the worker as follows: employee = 0, partner = 1, dependent children = 2. The cause also takes two values. If the cause (of hospitalization) is a disease, it takes the value 0. If it is accident, it takes the value 1. Finally, for the form of pay, we define the value equal 0 if it is direct payment and 1 if the payment is made through
reimbursement. This induces fixed distance between persons. For example, it means partners are of distance 1 and children distance 2 for any employee. While such forced distance is somewhat arbitrary, it is necessary for quantitative regression modeling.
Results
First, we run a regression with all the observations with positive claims. Table 7: Claims amount as a function of age, sex, relationship and income
ß t value
Age 0.0074 6.4478
Sex 0.0187 0.9342
Relation 0.0261 1.347
Log10(Income) -0.0232 -1.0869
The results are displayed in Table 7. It shows that the only variable that is significant is age. The rest of the variables do not matter for this overall regression result. An examination of the residuals of the model suggested a clear break for small claims and large claim. Thus, we divide our sample into small and large claims and run separate
age, sex and income level. As expected, higher age means higher claims, and lower income also meant higher claims. Men tend to have lower claims than women.
Relationship with the employee does not seem to affect the claims at all. Surprisingly, for large claims (over 50,000 pesos) none of the variables appears significant.
Table 8: Claims under 50,000 pesos
ß t value
Age 0.0052 4.9289
Sex 0.0631 3.4702
Relation 0.0198 1.1111
Log10(Income) -0.0565 -2.8765
Table 9: Claims over 50,000 pesos
ß t value
Age 656.3765 0.8152
Sex -11,181.60 -0.6803
Relation 10,712.33 0.7466
Income 0.0762 0.48
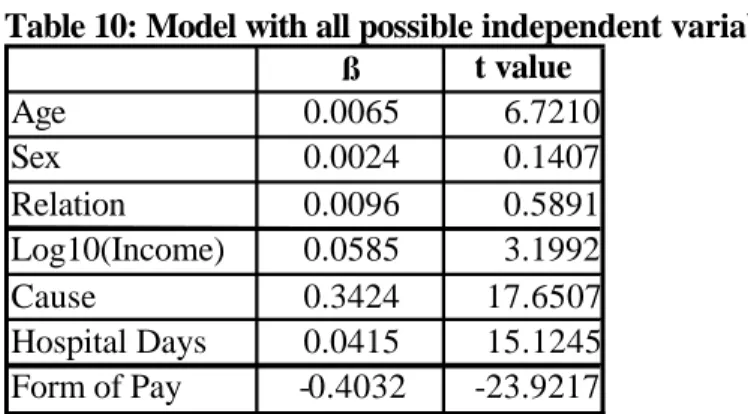
Finally, we analyze the data with all the variables in our list. The single most important variable is the form of payment. There is a very strong link: claims are most likely to be paid for in the form of direct payment rather than out of pocket payment with reimbursement. The only way this would be the case is people go to the hospitals that allow for direct payment when they are sick or have an accident. Another important variable is the “cause” variable. Diseases (rather than accidents) are much more
important as an explanatory variable for claims. As expected, the number of hospital days is an important explanatory variable – the longer one stays in the hospital, the more is the claim. One surprising element is the Income variable. Despite all the other added
claim more. Age of the person, as expected is an important variable: older people claim more.
Table 10: Model with all possible independent variables
ß t value
Age 0.0065 6.7210
Sex 0.0024 0.1407
Relation 0.0096 0.5891
Log10(Income) 0.0585 3.1992
Cause 0.3424 17.6507
Hospital Days 0.0415 15.1245 Form of Pay -0.4032 -23.9217
In all our models above, we ran the regression only for the 3,106 claims. However, there were 42,237 insured persons. Thus, in a sense, we ignored the observations of the people who did not claim.
The Tobit model, named after James Tobin, takes into account such censored data. Tobit model describes a relationship between a dependent variable yi that cannot take values below zero and a vector of variables xi.
Specifically, there exists a latent unobserved variable yi* that depends on xi. There is an error variable ui with a Normal distribution with mean 0.
Thus, we have
0 if yi* = 0 yi
yi* if yi* > 0
where yi* is the latent variable: yi* = ß xi + ui
Thus, our Tobit model takes the following form:
Claims = ß0 + ß1Age + ß2Sex + ß3Relation + ß4Income + ß5Hospital days
The result of Tobit regression is reported in Table 11. The only significant variables now become “Hospital days” and Age.
Table 11: Tobit Regression results
ß z value
Age 405.4885 3.9092
Sex -2,192.32 -1.2124
Relation 1,141.31 0.6476
Income 0.0504 1.8985
Hospital days 6,662.58 22.3764 Conclusions
We studied the factors that contribute to claims data in a group where the impact of health insurance premium is taken out. We show that the age distribution of the group comes out as an important factor as does income. Higher age leads to more claims as do higher income. This implies that health insurance companies should take into account both income and age distributions for setting premium levels.
Appendix: Classification of diseases and accidents with frequency and amount
Types of ca se Amount Number Frequency Average amount
External cause of mortality and morbidity
955,104.29
50 2%
19,102.09 Perinatal conditions 841,000.21 44 1%
19,113.64
Pregnancy and childbirth
3,986,060.31
322 10%
12,379.07
Endocrine, nutritional and metabolic diseases
641,840.67
38 1%
16,890.54
Standard checkup and followup 3,735,933.78
313 10%
11,935.89
Infections and parasites
1,960,336.52
193 6%
10,157.18 Congenital, deformation and chromosomal problems
863,618.38
41 1%
21,063.86
Hearing and related problems
184,085.83
23 1%
8,003.73
Eyes and related problems
1,323,235.66
109 4%
12,139.78
Skin related problems
244,311.82
28 1%
8,725.42 Unclassified clinical problems
450,199.81
29 1%
15,524.13
Circulatory system problems
1,931,223.09
76 2%
25,410.83 Digestive problems 9,681,003.08 326 10%
29,696.33 Genital and urinal problems
3,740,210.31
198 6%
18,889.95
Problems of nervous systems
1,629,698.94
60 2%
27,161.65
Problems of bones
7,746,172.38
190 6%
40,769.33 Respiratory system problems
5,610,767.60
321 10%
17,479.03
Mental and behavioral problems
7,864.34
2 0%
3,932.17
Trauma, poisoning and other external causes 8,263,834.25
647 21%
12,772.54 Tumors 6,380,719.80 96 3%
66,465.83 Total 60,177,221.07 3,106