1
university of Pittsburgh self-study rePort 2012
University of
Pittsburgh
Using a University-wide
Culture of Assessment for
Continuous Improvement
A Self-Study Submitted to the middle StAteS CommiSSion on higher eduCAtioni
university of Pittsburgh self-study rePort 2012
University of Pittsburgh
MIDDLE STATES SELF-STUDY REPORT 2012
Abbreviated Table of Contents
I. INTRODUCTION ...1
II. USING ASSESSMENT TO IMPROVE
INSTITUTIONAL EFFECTIVENESS ...12 Introduction ...13 Using Assessment in University-level
Planning and Budgeting, Annual Planning,
and Benchmarking ...13 Using Assessment in Unit-level
Planning and Budgeting, Annual Planning,
and Benchmarking, Selected Schools ...19 Using Assessment to Improve Institution-
wide Infrastructure Investment ...30 Summary of Findings and Suggestions ...46
III. USING ASSESSMENT TO IMPROVE THE
STUDENT EXPERIENCE ...48 Introduction ...49 Assessment of Student Learning
Outcomes ...49 Assessment of Student Retention,
Satisfaction, and Graduation ...67 Assessment of Undergraduate
Recruitment and Admissions ...83 Summary of Findings and Suggestions ...87
IV. SUMMARY OF CONCLUSIONS
AND FINDINGS ...90
University of Pittsburgh
MIDDLE STATES SELF-STUDY REPORT 2012
Analytic Table of Contents
I. INTRODUCTION ...1
A. History and Overview of the University of Pittsburgh ...1
B. Summary of Major Accomplishments ...2
C. Challenges and Opportunities ...3
D. Why the University Chose the Topic of Assessment ...3
E. Assessment as a Strategic Tool to Advance the University ...5
F. Leadership in Assessment of Student Learning Outcomes ...8
G. Expected Outcomes of the Self-study ...9
H. Description of the Self-study Process ...10
I. General Summary of Conclusions and Suggestions ...11
II. USING ASSESSMENT TO IMPROVE INSTITUTIONAL EFFECTIVENESS ...12
A. Introduction ...13
B. Using Assessment in University-level Planning and Budgeting, Annual Planning, and Benchmarking ...13
1. The University’s Planning and Budgeting System ...14
2. Annual Planning at the University of Pittsburgh ...15
3. University of Pittsburgh Benchmarking Activities...16
C. Using Assessment in Unit-level Planning and Budgeting, Annual Planning, and Benchmarking, Selected Schools ...19
1. Kenneth P. Dietrich School of Arts and Sciences ...20
a) Planning, Assessment, and Links to Institutional Goals ...20
b) Using Assessment in Planning, Program Development, and Resource Allocation ...21
c) Benchmarking Data in the Assessment Process ...23
d) Improving and Refining a Sustainable Assessment Process ...23
2. School of Social Work ...24
a) Planning, Assessment, and Links to Institutional Goals ...24
b) Using Assessment in Planning, Program Development, and Resource Allocation ...25
c) Benchmarking Data in the Assessment Process ...25
d) Improving and Refining a Sustainable Assessment Process ...25
3. School of Nursing ...26
a) Planning, Assessment, and Links to Institutional Goals ...26
iii
university of Pittsburgh self-study rePort 2012
c) Benchmarking Data in the Assessment Process ...27
d) Improving and Refining a Sustainable Assessment Process ...27
4. University of Pittsburgh at Bradford ...28
a) Planning, Assessment, and Links to Institutional Goals ...28
b) Using Assessment in Planning, Program Development, and Resource Allocation ...29
c) Benchmarking Data in the Assessment Process ...29
d) Improving and Refining a Sustainable Assessment Process ...30
D. Using Assessment to Improve Institution-wide Infrastructure Investment ...30
1. Information Technology ...30
a) Planning, Assessment, and Links to Institutional Goals ...31
b) Examples of Assessment Used to Improve Infrastructure ...31
c) Improving and Defining a Sustainable Assessment Practice ...32
2. Facilities ...32
a) Planning, Assessment, and Links to Institutional Goals ...32
b) Examples of Assessment Used to Improve Infrastructure ...33
c) Improving and Defining a Sustainable Assessment Practice ...34
3. The University Library System ...34
a) Planning, Assessment, and Links to Institutional Goals ...35
b) Examples of Assessment Used to Improve Infrastructure ...35
c) Improving and Defining a Sustainable Assessment Practice ...36
4. International Activities ...36
a) Planning, Assessment, and Links to Institutional Goals ...36
b) Improving and Defining a Sustainable Assessment Practice ...37
5. Budget and Finance ...38
a) Budget Monitoring ...39
b) Asset Allocation Plan ...41
c) Internal Systems of Financial Controls ...43
d) Procurement Process ...44
E. Summary of Findings and Suggestions ...46
III. USING ASSESSMENT TO IMPROVE THE STUDENT EXPERIENCE...48
A. Introduction ...49
B. Assessment of Student Learning Outcomes ...49
1. Structure of Assessment of Student Learning Process at Pitt ...50
a) Requirements ...50
b) Responsibility ...50
c) Accountability ...51
d) Reporting by Programs with Specialized Accreditation ...51
2. Building a Culture of Assessment ...51
3. Documentation of Assessment of Student Learning ...56
4. Examples of Developing a Culture of Assessment ...57
a) Developing a Culture of Assessment in the School of Law ...57
b) Developing a Culture of Assessment in the Dietrich School of Arts and Sciences ...58
5. Examples of How Assessment of Student Learning Is Leading to Curricular Change ..59
a) History, Dietrich School of Arts and Sciences ...59
b) Actuarial Mathematics, Dietrich School of Arts and Sciences ...60
c) Criminal Justice, Pitt–Greensburg ...60
d) Biology, Pitt–Bradford ...60
e) Industrial Engineering, Swanson School of Engineering ...60
f) Graduate Programs ...60
6. General Education ...61
7. Examples of General Education Assessment ...63
a) Writing in the Disciplines, Dietrich School of Arts and Sciences ...63
b) Second Language, Dietrich School of Arts and Sciences ...64
c) Quantitative Reasoning, School of Nursing ...64
d) Economic Analysis, Swanson School of Engineering ...65
e) Writing, Pitt–Greensburg ...65
f) Oral Communication, Pitt–Johnstown ...65
g) Mathematics, Pitt–Titusville ...65
8. How Assessment Is Used to Make Changes and Drive Progress ...66
C. Assessment of Student Retention, Satisfaction, and Graduation ...67
1. Structure of Assessment Activities ...68
a) Measures Used to Assess Retention, Graduation, Student Satisfaction, and Student Placement ...68
b) Data Sources ...69
c) Retention and Graduation Rates ...69
d) Student Surveys ...69
e) Graduating Senior, Recent Graduate, Alumni, and Employer Surveys ...72
f) Groups and Expert Consultants ...72
2. Documentation for Assessment of the Student Experience ...72
3. Developing a Culture of Assessment: Student Affairs Model ...73
4. Assessing Student Retention and Satisfaction: Pittsburgh Campus ...75
a) Using Assessment Results to Guide Programmatic Investments on the Regional Campuses ...78
5. Examples of Using Assessment to Enhance the Student Experience ...78
a) The Outside the Classroom Curriculum ...78
b) RealWorld Action Program at Pitt–Johnstown ...79
c) Using Assessment to Improve Academic Support Services ...81
d) Improving Registration and Access to Student Data: All Campuses ...82
v
university of Pittsburgh self-study rePort 2012
D. Assessment of Undergraduate Recruitment and Admissions ...83
1. Background ...83
2. Admissions Processes ...84
3. Assessing the Admissions and Recruitment Processes ...84
a) Selected Examples of How Assessment Has Led to Improvements in Recruitment and Admissions Processes ...85
b) Assessing Marketing Strategies: Pitt–Bradford and Pitt–Johnstown ...86
c) Quantitative Assessment of Admissions and Awarding Strategies ...86
E. Summary of Findings and Suggestions ...87
IV. SUMMARY OF CONCLUSIONS AND FINDINGS ...90
V. APPENDICES ...94
A. Introduction ...95
B. Using Assessment to Improve Institutional Effectiveness ...95
vii
university of Pittsburgh self-study rePort 2012
Executive Summary
STANDARDS WHOLLY OR PARTIALLY COVERED IN THE SELF-STUDY:
The standards wholly addressed in this self-study include Standard 7: Institutional Assessment and Standard 14: Assessment of Student Learning.
The standards partially covered in this self-study include the following:
Standard 2: Planning, Resource Allocation, and Institutional Renewal
Fundamental Element 2.6: Periodic assessment of the effectiveness of planning, resource allocation, and institutional renewal processes
Standard 8: Student Admissions and Retention
Fundamental Element 8.8: Ongoing assessment of student success, including but not necessarily limited to retention, that evaluates the match between the attributes of admitted students and the institution’s mission and programs and reflects its findings in its admissions, remediation, and other related policies
Standard 9: Student Support Services
Fundamental Element 9.10: Ongoing assessment of student support services and the utilization of assessment results for improvement
Standard 11: Educational Offerings
Fundamental Element 11.13: Assessment of student learning and program outcomes relative to the goals and objectives of the undergraduate programs and the use of the results to improve student learning and program effectiveness
Standard 12: General Education
Fundamental Element 12.6: Assessment of general education outcomes within the institution’s overall plan for assessing student learning and evidence that such assessment results are utilized for curricular improvement
I
Introduction
HISTORY AND OVERVIEW OF THE UNIVERSITY OF PITTSbURGH SUMMARY OF MAjOR
ACCOMPLISHMENTS CHALLENGES AND OPPORTUNITIES
WHY THE UNIVERSITY CHOSE THE TOPIC OF ASSESSMENT ASSESSMENT AS A STRATEGIC TOOL TO ADVANCE THE
UNIVERSITY
LEADERSHIP IN ASSESSMENT OF STUDENT LEARNING OUTCOMES EXPECTED OUTCOMES OF
THE SELF-STUDY DESCRIPTION OF THE SELF-STUDY PROCESS GENERAL SUMMARY OF CONCLUSIONS AND SUGGESTIONS
1
university of Pittsburgh self-study rePort 2012
I
HISTORY AND OVERVIEW OF THE UNIVERSITY OF PITTSbURGH
The University of Pittsburgh of the Commonwealth System of Higher Education is a nonsectarian, coeducational, state-related public research university made up of five cam puses located throughout Western
Pennsylvania. The Pittsburgh campus, located in the cultural and medical center of the city of Pittsburgh, is within a one-hour com-muting distance of the metropolitan area’s 2.4 million people. The Johnstown campus, a four-year undergraduate college in Cambria County, serves the region at the foothills of the Allegheny Mountains. The Bradford campus, a four-year undergraduate college located in the Allegheny Mountains at the Pennsylvania/ New York border, serves the predominantly rural areas of Western Pennsylvania and western New York. The Greensburg campus is a four-year undergraduate college located east of Pittsburgh that serves Westmoreland County and the eastern Pittsburgh areas. The Titusville campus is a two-year college located in northwestern Pennsylvania.
The University was founded in 1787 as a small private school named the Pittsburgh Academy. In 1819, it was renamed the Western University of Pennsylvania and then renamed again, in 1908, as the University of Pittsburgh. The Johnstown campus was established in 1927, while the Bradford, Greensburg, and Titusville campuses were established in 1963. The University of Pittsburgh remained private until 1966, when it became a public state-related institution and was renamed the University of Pittsburgh of the Commonwealth System of Higher Education.
The University is the most compre-hensive educational institution in Western
Pennsylvania, enrolling approximately 36,000 students. Through its five campuses, the University is able to fulfill its commitment to student access by offering an excellent undergraduate experience across a range of aspirations, abilities, and interests. The Pittsburgh campus, located in Allegheny County, offers certificate, baccalaureate, mas-ter’s, first professional, and doctoral programs. The campuses in Johnstown and Bradford offer certificate, associate’s, and baccalaureate programs. The Greensburg campus offers certificate and baccalaureate programs, while the Titusville campus offers certificate and associate’s degree programs. In total, the
University offers more than 440 distinct degree programs and numerous dual, joint, and coop-erative degree programs.
The University Board of Trustees is responsible for advancing the purposes of the University; promoting and protecting its inde-pendence, academic freedom, and integrity; and enhancing and preserving its assets for the ben-efit of future generations of students and soci-ety at large. The complete membership of the board includes the Chancellor and four catego-ries of trustees—term (17), special (15), alumni (six), and commonwealth (12)—for a total of 51 members. The governor of Pennsylvania, the commonwealth secretary of education, the chief executive of Allegheny County, and the mayor of the City of Pittsburgh serve as ex officio members without vote.
The Board of Trustees delegates general administrative, academic, and managerial authority to the Chancellor of the University. The Provost and Senior Vice Chancellor is responsible for general academic policies and standards and for overall academic matters in all schools and colleges, regional campuses, and centers. Schools of the health sciences
Introduction
report to the Senior Vice Chancellor for the health sciences.
Based on a total enrollment of approxi-mately 36,000 students, more than 25,000 are undergraduate students and approximately 10,000 are graduate and professional students. The University employs a total of more than 4,000 full-time and about 900 part-time faculty members, more than 7,000 staff members, and approximately 1,000 research associates and postdoctoral associates.
SUMMARY OF MAjOR ACCOMPLISHMENTS
During the past 15 years, the University of Pittsburgh’s progress and reputation as a world-class public research university have been steadily advancing. The ranking of Pitt among public research universities in U.S. News & World Report increased from the second tier (51st–115th) in 1995 to 19th tied with three others in the most recent ranking in 2011. For four consecutive recent years, Pitt ranked in the very top cluster of U.S. public research universities in the assess-ment independently produced each year by the Center for Measuring University Performance. In international rankings in 2012, Pitt ranked 35th among U.S. universities (16th among public universities in the United States) and 59th worldwide, according to the Times Higher Education World University Rankings.
The University of Pittsburgh enhanced its position as the institution of choice for many students during this period, drawing from an increasingly talented and accomplished applicant pool and thereby profoundly changing the profile of undergraduate students enrolling on all cam-puses. On the Pittsburgh campus, for example, the midpoint of freshman SAT scores rose from 1100 in 1995 to 1280 in 2011, and the fresh-men in the top 10 percent of their high school graduating class increased from 22 percent to 54 percent in that same period.
Pitt’s educational programs have regularly produced students earning the very highest forms of national and international recognition in this period, including four Rhodes Scholarships,
a Gates Cambridge Scholarship, a Churchill Scholarship, five Udall Scholarships, six Marshall Scholarships, five Truman Scholarships, and 34 Goldwater Scholarships. On the alumni side, Pitt graduates have been recognized with such prestigious awards as the Nobel Peace Prize, the Nobel Prize in Medicine, the National Medal of Science, and the Pulitzer Prize.
Pitt’s reputation for offering excellent undergraduate experiences that keep students at the University has been growing as well. While graduation rates fell for one-third of U.S. four-year colleges over a five-four-year period from 2003 to 2008, Pitt had the fifth highest increase, according to a 2010 ranking in The Chronicle of Higher Education.
Pitt’s research expenditures totaled $5.33 billion in the past 10 years, a level of funding that not only drives pioneering research but also serves as a sign of institutional stature. Pitt now ranks among the top five universities in fund-ing that its faculty attracts from the National Institutes of Health—in 2008 joining Harvard University; Johns Hopkins University; the University of Pennsylvania; and the University of California, San Francisco—and is among the nation’s top 10 universities in total federal science and engineering research and develop-ment obligations1, joining such others on the list as the University of Michigan; the University of California, Los Angeles; Duke University; Penn; and Harvard.
The University consistently ranks in the top 20 among research universities in the
number of national awards and honors bestowed on its faculty, according to the Center for
Measuring University Performance, referenced earlier. In the most recent rankings of the National Research Council, Pitt had a number of programs that had substantially advanced from where they were in 1995, including molecular pharmacology, microbiology, nurs-ing, bioengineernurs-ing, biostatistics, neuroscience, epidemiology, psychology, computer science, mathematics, and political science. These, among others, are developing in the tradition of 1 www.nsf.gov/statistics/infbrief/nsf09313/nsf09313.pdf
3
university of Pittsburgh self-study rePort 2012
historically leading programs, such as philosophy and the history and philosophy of science.
Construction, renovation, and restoration on all five campuses have elevated the Pitt environment in instruction, research, recreation, student life, campus living, and virtually every other area in which people of the University are engaged. Working from a long-term facili-ties plan (see Facilifacili-ties section in Institutional Effectiveness), the University made capital investments in many areas of critical importance. Deferred maintenance was dramatically reduced, existing facilities were significantly renovated to support new programs, campus utility and network infrastructures were modernized, much-needed new facilities were constructed, and addi-tional student housing and recreaaddi-tional facilities were added to all campuses.
CHALLENGES AND OPPORTUNITIES
While the academic reputation of the University has been advancing, state support has been diminishing. In fiscal year 2001, the com-monwealth appropriation was approximately 16 percent of Pitt’s annual budget, and by fiscal year 2011, it was less than 10 percent. In response to this situation, the University had already made operational efficiency a long-term priority, which is reflected in staged actions over recent years such as budget cuts, the redesign of benefits plans, cost-reduction initiatives, successful efforts to increase productivity, and the imposition of University-wide salary freezes.
Following this decade of diminishing support, on March 8, 2011, the governor proposed cuts totaling more than $100 million, or 52 percent of the appropriation. Negotiations within the legisla-ture resulted in a partial restoration of these funds and a net decline in the commonwealth appropria-tion of more than $40 million or 22 percent.
The University has benefited from stable leadership, flourishing under the guidance of Chancellor Mark A. Nordenberg and former Provost James Maher, who retired in 2010. The Chancellor and most of his senior staff have been in place for a full decade, and the average tenure of deans and campus presidents is about nine years.
The University made a smooth transition to a new Provost and Senior Vice Chancellor when Dr. Patricia E. Beeson, the former vice provost for undergraduate and graduate studies at the University of Pittsburgh, was appointed Provost in June 2010. In her first year as Provost, Dr. Beeson developed a vision for building on the University’s continuing momentum, including a plan to guide Pitt’s global and international initiatives. A national leader on assessment and an early proponent of its implementation on the Pitt campuses, the Provost was the coordinator of University-wide academic assessment in her previous role.
Despite the present fiscal realities, University leaders are confident that Pitt will advance and are committed to investing in the programmatic excellence that has come to distinguish the University of Pittsburgh. This confidence is based on the strong role that planning, budgeting, and assessment have played throughout these past decades and because of the good practices now in place that will enable the University to build on its momentum in a focused and purposeful manner.
WHY THE UNIVERSITY CHOSE THE TOPIC OF ASSESSMENT
For its self-study, the University of
Pittsburgh chose the topic of “Using a University-wide Culture of Assessment for Continuous Improvement.” By primarily addressing the stan-dards of institutional assessment and assessment of student learning, this self-study provides the University with the opportunity to look in depth at a strategy to which it has been deeply commit-ted for some time. The standards addressed
in this study include Standard 7: Institutional Assessment; Standard 14: Assessment of Student Learning; portions of Standard 2: Planning, Resource Allocation, and Institutional Renewal; Standard 8: Student Admissions and Retention; Standard 9: Student Support Services; Standard 11: Educational Offerings; and Standard 12: General Education.
The foundation for developing a systematic approach to planning, setting goals, and assess-ing and achievassess-ing those goals was established more than 20 years ago. In 1992, the University instituted its Planning and Budgeting System (PBS) to promote transparency, cooperation, and coordination among members of the University community; to increase accountability; and to improve planning and budgeting decision mak-ing. PBS incorporates long-range planning and budgeting, operational planning and budgeting, and ongoing assessment of all University pro-grams and responsibility centers.
In the mid-1990s, the University set forth its new vision of becoming one of the nation’s preeminent research universities, and the formal mission statement, as adopted in 1995, articulates that aspiration.
Building on that foundation, in 1996 and again in 2000, the Board of Trustees approved resolutions that set the strategy and tone for all future goals and successes:
1996 Resolution (in part): To fulfill its insti-tutional mission and increase its overall stature, it is essential that the University place special emphasis on undergraduate education in the months and years ahead devoted to increasing the academic standards for its undergraduate programs; ensuring that all undergraduates achieve quantitative and communicative skills and are well prepared for their chosen life path; improving the quality of student life; and attracting, retaining, and graduating a more diverse (multicultural, racial, geographic, etc.) undergraduate student body. (Appendix A1) 2000 Resolution (in part): Our overarching goal is to be among the best in all that we do. We will add—significantly, measurably, and
Mission Statement of the University of Pittsburgh Approved by the board of Trustees on February 16, 1995
The University of Pittsburgh, founded in 1787, is one of the oldest institutions of higher education in the United States. As one of the nation’s distinguished comprehensive universi-ties, the resources of the University constitute an invaluable asset for the intellectual, economic, and social enrichment of Pennsylvania, while the international prestige of the University enhances the image of Pennsylvania throughout the world.
The University’s mission is to:
• provide high-quality undergraduate programs in the arts and sciences and professional fields, with emphasis upon those of special benefit to the citizens of Pennsylvania;
• offer superior graduate programs in the arts and sciences and the professions that respond to the needs of Pennsylvania as well as to the broader needs of the nation and the world;
• engage in research, artistic, and scholarly activities that advance learning through the extension of the frontiers of knowledge and creative endeavor;
• cooperate with industrial and govern- mental institutions to transfer knowledge in science, technology, and health care;
• offer continuing education programs adapted to the personal enrichment, professional upgrading, and career advancement interests and needs of adult Pennsylvanians; and
• make available to local communities and public agencies the expertise of the University in ways that are consistent with the primary teaching and research functions and contribute to social, intel-lectual, and economic development in the commonwealth, the nation, and the world.
5
university of Pittsburgh self-study rePort 2012
visibly—to institutional quality and reputa-tion through the accomplishments of our people; the strength of our programs; and the regional, national, and international impact of our work … becoming among the country’s most selective public universities in the credentials and com-mitment of students; striving continuously and creatively to ensure that the opportunities for learning and growth offered to undergradu-ates are second to none; enhancing existing strengths in graduate and professional educa-tion; [and] increasing the scope, quality, and visibility of our exceptional research programs. (Appendix A2)
In alignment with these board resolutions and the University’s mission and in consultation with the faculty and administration, the Provost developed a set of long-range academic goals:
1. Become one of the nation’s top 25 research universities.
2. Offer truly superb undergraduate experiences in a research university of nationally recognized stature.
3. Nurture a world-class environment that results in increased sponsored research and scholarly and creative output. 4. Strategically develop areas of excellence
in collaborative research scholarship. 5. Take advantage of academic
opportuni-ties available in an urban environment. 6. Become engaged with external
constitu-encies with whom the University has common goals and interests.
7. Expand the University’s global focus by increasing international study and research opportunities.
Over an extended period of time, the Provost presented and discussed these strategic academic goals with many groups of faculty, administrators, and staff—both within and outside the traditional academic areas—with the aim of focusing the University community’s attention on the academic priorities of the insti-tution. During this period of presentations and
discussions, not only were the academic goals of the University extensively communicated, but the framework through which progress toward these goals would be assessed was made clear (Appendix A3).
The University also developed and refined the processes it would use to evaluate its effectiveness in achieving its mission and goals, to ensure that students and graduates achieve the appropriate learning and other outcomes, and to make efficient use of avail-able resources. The institutionalization of these processes organized the University’s think-ing about assessment into major objectives consistent with institutional goals, presented areas where critical success factors could be identified and used to gauge the success of the University’s efforts, and determined how the results of assessment could most effectively be both analyzed and used to effect change.
This combination of sustained and inte-grated activities—the statement of mission and strategic goals by the Board of Trustees, the insti-tutional Planning and Budgeting System, the identification of academic goals supported by an annual planning system for academic units, and an overall system of processes for institutional assessment—constitute the framework of the comprehensive model in place at the University of Pittsburgh. It is a model for planning; setting goals; assessing progress toward those goals; and, ultimately, for using a University-wide culture of assessment for continuous improvement.
ASSESSMENT AS A STRATEGIC
TOOL TO ADVANCE THE UNIVERSITY
Today, assessment is valued throughout the University and is integrated at both the programmatic and operational levels. Rather than having a separate office of assessment, each unit is responsible for assessing outcomes and progress toward the goals for which the unit has responsibility. Accountability is ensured through documented reporting processes and the linking of planning, assessment, and budgeting. In some cases, activities are further coordinated through
campus- or school-level committees. Each school and campus reports annually on its assessment of progress toward goals as part of the annual plan-ning and budgeting cycle.
Oversight responsibility at the institutional level depends upon the category of assessment. Institutional effectiveness responsibilities are assigned to appropriate levels within the institu-tion with ultimate oversight and responsibility by the corresponding vice chancellors and the chancellor. Oversight for the assessment of stu-dent experiences is provided by the Enrollment Management Committee on the Pittsburgh campus, and other campuses have similar struc-tures all ultimately reporting to the Provost. The faculty of each program is responsible for the assessment of student learning with oversight by the appropriate dean, president, and vice provost and, ultimately, the Provost.
The progress of the University of Pittsburgh over the past 15 years has been driven signifi-cantly by the effective use of assessment as a guide to planning and budgeting and as a tool for making change. During this time, there has been a notable increase University-wide in the use of assessment to help measure progress toward the stated goals and in the degree to which faculty, staff, and administrators recognize the importance of assessment in helping the University to attain these goals.
Institutional planning, driven by the University’s Planning and Budgeting System, combines long-range planning and budgeting; operational plans and budgets; personnel, capital, and financial budgets; and the assessment of University programs and responsibility centers. This self-study report demonstrates how assess-ment has led to many institutional advanceassess-ments in operational efficiency and effectiveness and how the University has used assessment to make decisions about institution-wide infrastructure investment. These include the critical areas of information technology, facilities, and the library system (Institutional Effectiveness section II D).
The successful use of assessment in plan-ning, program development, and resource
allocation within the academic units also is demonstrated in this report. The academic plan-ning process provides for resource allocation based on the stated long-term goals of the unit. The plans include strategies and actions, targeted outcomes, and methods of assessment that can include reviews of planning and budgeting documents, examination of a wide range of data collected by various units, and evaluations of proposals for new programs, to name a few. Resources are reallocated based on the consistent application of a variety of assessment practices followed by thoughtful reflection that indicates a change of strategy is warranted. This report provides examples of how assessment became the decision-making tool that led to revisions in academic programs and majors, reallocations of faculty lines, and improvements in student services (Institutional Effectiveness section II C).
Major developments in data collection and evaluation methods have included the bench-marking of performance indicators relative to peer and aspirational institutions (see Figures 1 and 2 in the Institutional Effectiveness section), which serves an important function in planning and resource allocation, and in the systematic collection of data used in making assessments that result in improvements in the student expe-rience. These include retention and graduation rates, student satisfaction surveys, participation in national student surveys, graduation and alumni surveys, and many others (Student Experience section III D).
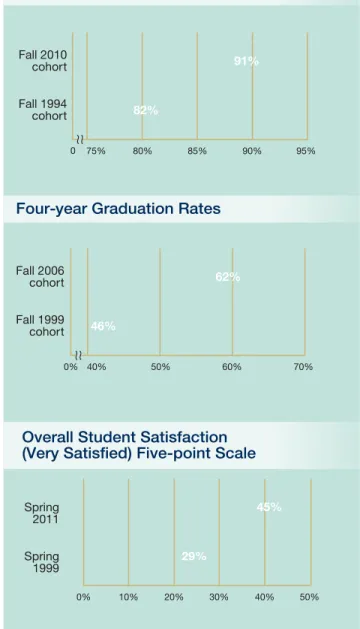
The regular review of this information has provided senior administrators with important feedback on the progress of the institution in achieving its stated mission and goals as well as in identifying areas of challenge and opportunity for future investigation and emphasis. Using internal benchmarks and student surveys, for example, the University has been able to dem-onstrate progress on a number of key criteria and answer the question “Is the University of Pittsburgh getting better?” The following charts show progress over time on some of these key indicators:
7
university of Pittsburgh self-study rePort 2012
0% 50% 100%
1100
1280
Fall 2011
Fall 1995
1000 1100 1200 1300
Midpoint of Freshman SAT Scores
22%
54%
Fall 2010
Fall 1995
Freshmen in the Top 10 Percent of Their High School Class
82% 91% Fall 2010 cohort Fall 1994 cohort
75% 80% 90% 95%
Freshman-to-Sophomore Retention Rates
85%
61% 78%
Fall 2004 cohort
0% 20% 60% 100%
Six-year Graduation Rates
Fall 1995 cohort
40% 80%
0
0
Student Satisfaction with the Social Environment (Very Satisfied)
Five-point Scale 29% 45% Spring 2011 Spring 1999
0% 10% 30% 50%
Overall Student Satisfaction (Very Satisfied) Five-point Scale
30% 44% Spring 2011 Spring 1999 0% 20% 46% 59% Fall 2004 cohort Fall 1993 cohort
0% 20% 60% 80%
African American Six-year Graduation Rates
40%
$230
$737
FY 2010
$0 $200 $800
Total R&D Expenditures (Millions)
FY 1995
$400 $600 40%
40% 20%
10% 30% 50%
Student Satisfaction with the Social Environment (Very Satisfied)
Five-point Scale 29% 45% Spring 2011 Spring 1999
0% 10% 30% 50%
Overall Student Satisfaction (Very Satisfied) Five-point Scale
30% 44% Spring 2011 Spring 1999 0% 20% 46% 59% Fall 2004 cohort Fall 1993 cohort
0% 20% 60% 80%
African American Six-year Graduation Rates
40%
$230
$737
FY 2010
$0 $200 $800
Total R&D Expenditures (Millions)
FY 1995
$400 $600 40%
40% 20%
LEADERSHIP IN ASSESSMENT OF STUDENT LEARNING OUTCOMES
As noted in this self-study report, another area in which there has been considerable development at the University is in assessing student learning outcomes (Student Experience section III B). Because the University has had a long-standing tradition of ongoing and periodic evaluation of academic programs, program eval-uations and reaccreditation reviews increasingly included the assessment of student learning as a critical component of the program evaluation. In 2006, the Council of Deans (COD) formalized the process by which the assessment of student learning occurred, guided by the belief that assessment will be effective in helping to shape the University’s academic programs only if the effort is led by the program’s faculty, as long as that faculty is held accountable. The COD also believed that to be effective, the assessment of student learning must be an integral part of the planning efforts of the individual units, schools, and campuses.
The formal assessment process of student learning has been in place for five years now, and the University can document renewed energy in the curriculum as faculty regularly review and assess whether or not the curriculum is helping students to learn what the University expects them to learn. The process of assessing student learning is now part of the culture of the University, with virtually all programs having meaningful assessment processes in place (see extensive discussion in the Student Experience section on Assessment of Student Learning Outcomes).
The University of Pittsburgh has not only taken an early leadership position on assessment of student learning on its own campuses, but many schools and campuses of the University are recognized for their assessment leadership on a national basis, reinforcing the success that can come from a decentralized model of assessment. Following are a few of the many examples.
Faculty members from the Swanson School of Engineering have earned a national reputation in the field of engineering education
assessment. They first achieved national recogni-tion 16 years ago with the development of the Pittsburgh Freshman Engineering Attitude Survey, an instrument that has been used by more than 30 schools and continues to be used today. This led to a succession of grants funded primarily by the National Science Foundation focused on engineering education assessment, as well as a series of papers, 11 of which have been published in the Journal of Engineering Education.
The School of Medicine is recognized for its expertise in evaluation of program effectiveness, including innovative approaches to gathering information about student experi-ences and the development of systematic methods for analysis of evaluation data. One approach to providing in-depth evaluation consultations to each course and clerkship resulted in a detailed, synthetic report of how the course is performing, opportunities for improvement, and identification of resources that would support that improvement. The methodology was presented at the Innovations in Medical Education conference of the Association of American Medical Colleges.
The School of Law has been recognized for its leadership within the legal academy for its initiatives related to the assessment of student outcomes. Presentations include those made at a legal education conference on assessment in 2009, to the American Bar Association in 2010, and to the McGeorge School of Law at the University of the Pacific in 2011. Pitt faculty published on assessment in the University of Toledo Law Review’s Leadership in Legal Education symposium series.
In the most recent accreditation team visit to the Joseph M. Katz Graduate School of Business, the team cited the assessment of learning approach in the business school as a best practice. Katz was recognized for its comprehensive and innovative approach that included “concept inventories” developed by faculty interest groups, which were used to assess the students’ awareness and understanding of core concepts in each of the business disciplines,
9
university of Pittsburgh self-study rePort 2012
and the development of a detailed instrument and the statistical tools to assess the extent to which each student possessed the knowledge and skills that every graduate of an effective MBA program should possess.
The School of Pharmacy also was rec-ognized by its accrediting body in the 2009 evaluation team report that identified its assess-ment process as a “noteworthy practice.” As a result, the American Association of Colleges of Pharmacy invited school faculty in 2010 and 2011 to present at annual and interim meetings. The school also has been recognized for its use of a mastery scale to assist students in self-assessing and mapping their learning as they progress through the didactic and experiential compo-nents of the curriculum.
The School of Dental Medicine was twice asked to present its innovations related to the assessment of teaching and learning. The Systematic Course Evaluation Policy was presented to the American Dental Education Association’s Commission on Change and Innovation in Dental Education—a think tank composed of leaders in dental education from across the United States and Canada. The school’s Curriculum Management Tool, a Web-based application that provides a link to the required competencies for each course, was
presented to the American Dental Education Association.
EXPECTED OUTCOMES OF THE SELF-STUDY
Because assessment is an ongoing process and should lead to continuous improvement, the self-study is expected to help the University to develop a deeper understanding of the current methods of assessment and the degree to which those methods are supporting improvements. The University expects to further its understand-ing of the ways in which campuses, schools, and units have integrated assessment into their planning and how the assessment of student learning is driving curricular change. The self-study can help to determine the degree to which an assessment mind-set and assessment practices have taken hold at Pitt, reflecting a cultural shift over time toward stronger accountability and a platform for communicating and raising aware-ness of accomplishments to the University com-munity. The University anticipates that analyses, deliberations, and final recommendations from the self-study will provide a foundation for subsequent groups to address existing challenges and to implement any changes that will foster continuous improvement.
DESCRIPTION OF THE SELF-STUDY PROCESS
A 20-person steering committee—which included faculty, senior administrators, staff, and students—and two working groups reporting to the steering committee examined assessment practices at the University, and their reports form the basis of this self-study. A third group was formed to demonstrate compliance with those standards and fundamental elements not covered in this self-study by developing the Document Road Map (Appendix A4).
Working Group I—Using Assessment to
Improve the Student Experience—was charged with examining the extent to which assessment of programs, activities, and plans has assisted the institution in improving the student experience, both within and outside the classroom, on all five campuses.
Working Group II—Using Assessment
to Improve Institutional Effectiveness— was charged with examining the extent to which assessment of programs, activities, plans, and processes has contributed to
the advancement of the University’s academic goals.
Working Group III was to prepare a
docu-ment road map that listed all the primary supporting documentation and an annota-tion for each standard.
Different approaches were taken by the three working groups. The group on institutional effectiveness interviewed the key leaders in each review area. In the student experience group, the composition of the committee itself was designed to include the necessary expertise on the topic. The third group’s members were cho-sen based on their experience with specialized accreditations that gave them familiarity with the process but not necessarily the University of Pittsburgh approach.
The working groups met numerous times over the course of a year and prepared detailed reports of their findings and recommendations, providing the basis for the final development of the self-study, which was overseen by the steer-ing committee. Dursteer-ing the extended period of the development of the self-study, a number of presentations were made and discussions were
11
university of Pittsburgh self-study rePort 2012
held with a variety of University groups and organizations, including the Council of Deans, Faculty Assembly, University Senate Educational Policies Committee, Academic Affairs and Libraries Committee of the Board of Trustees, and various Boards of Visitors.
In the fall of 2011, the leaders of constitu-ency groups—including faculty, staff, and stu-dents as well as senior administrators—were sent a draft of the self-study, asked to share the docu-ment with appropriate members of their units, and asked to submit comments and revisions. The self-study was made available in January 2012 to the entire University community on all campuses through the University portal in the self-study community prior to the Middle States Commission on Higher Education visitation. Several articles in the University Times and the Pitt Chronicle covered accreditation during this period (Appendix A5).
GENERAL SUMMARY OF
CONCLUSIONS AND SUGGESTIONS
In general, the working groups report the evolution of a culture of assessment that has resulted in ongoing improvements and advance-ment of the University of Pittsburgh. The work-ing group reports—Uswork-ing Assessment to Improve Institutional Effectiveness and Using Assessment to Improve the Student Experience—both include a section on findings that are summarized at the end of the two main chapters in this self-study document and in a final section that reiterates all conclusions. Some broad suggestions are recounted below:
• Timeliness of Benchmarking Information: For some schools and departments, the Kenneth P. Dietrich School of Arts and Sciences in particular, it has been traditionally difficult to get peer institution data in a timely fashion. Recent initiatives by the Office of the Provost to deal with the situation include becoming engaged through a consortium to obtain access to Student Experience in
the Research University (SERU) data and providing extensive, detailed information on a departmental basis through the purchase of a program called Academic Analytics, a comprehensive and well-tested method for the assessment of faculty productivity. The University intends to continue to identify additional solutions of this type to deliver more timely information.
• Making Information More Widely Available: The Office of the Provost— which already runs a number of student surveys, including the Senior Survey, Student Satisfaction Survey, and Freshman Survey—intends to put more processes in place to distribute that information more broadly and in more meaningful ways. The creation of the data warehouse and the Management Information Center intranet are two successful examples of this more expansive distribution. This information, in turn, can be used more widely in planning and assessment.
The University is finding new ways to access its own internal data that will enable individual units to do ongoing assessment. Recent examples include incorporating such solutions as the PeopleSoft Student Information System and purchasing Dashboard tools, looking at more user-friendly approaches such as Cognos inter-face and portal communities, and making regular reports to key groups such as the Enrollment Management Committee.
• Continuing to Focus on Outcomes: Because assessment is an ongoing process that should lead to continuous improve-ment, the annual plans will become even more streamlined in the future, facilitating more focused goals tied to results against which progress can be more easily measured. The University also will review the timing cycle of planning to determine if it is appro-priately synchronized with the availability of data.
II
Using Assessment
to Improve Institutional
Effectiveness
INTRODUCTION
USING ASSESSMENT IN UNIVERSITY-LEVEL
PLANNING AND bUDGETING, ANNUAL PLANNING, AND bENCHMARKING
USING ASSESSMENT IN UNIT-LEVEL PLANNING AND bUDGETING, ANNUAL PLANNING, AND bENCHMARKING, SELECTED SCHOOLS
USING ASSESSMENT TO IMPROVE INSTITUTION-WIDE INFRASTRUCTURE INVESTMENT
SUMMARY OF FINDINGS AND SUGGESTIONS
II
13
university of Pittsburgh self-study rePort 2012
INTRODUCTION
The following sections report on the findings of the Working Group on Using Assessment to Improve Institutional
Effectiveness (WGIE)2. WGIE’s charge was to examine how the University uses assess-ment to improve the institution in areas that are not related to the student experience but that are instead related to planning and bud-geting, benchmarking, and infrastructure.
The first section of this chapter presents an overview of the University-level planning and budgeting system, annual planning, and benchmarking. This section describes the systems and processes and indicates how the University uses assessment to help achieve its goals. The second section offers four examples of unit-level planning, budgeting, and bench-marking processes. Highlighted within this section are linkages between unit-level and institutional goals; the use of assessment to guide planning, program development, and resource allocation; the role of benchmarking in the assessment process; and the sustain-ability of the assessment process. The final section explores how the University has used assessment to improve institutional effective-ness in relation to infrastructure.
USING ASSESSMENT IN
UNIVERSITY-LEVEL PLANNING AND bUDGETING, ANNUAL
PLANNING, AND bENCHMARKING
The University of Pittsburgh is a com-plex, decentralized organization composed of a wide range of schools, programs, campuses,
and administrative units. Planning, budgeting, and benchmarking activities are designed to foster alignment between individual units and the University while allowing sufficient flexibility to recognize individual needs and requirements of the units. The activities encourage assessment at every level of the University, and they are themselves reviewed on a regular basis to seek improvements in the process. The resulting processes reflect the diversity of the units while at the same time encouraging them to advance the overall goals and mission of the University. An in-depth examination of the planning, budget-ing, and benchmarking for the Provost-area schools is provided in this report to illustrate the impact of assessment on planning, resource allocation, programming, and deci-sion making across the University.
The responsibility for planning and budgeting at the University of Pittsburgh is shared among administrators, faculty, staff, students, and trustees. The chancellor develops the vision for the University and has final authority for planning and budgeting, subject to appropriate action by the Board of Trustees. Other participants in planning and budgeting include the Provost, who, as the senior academic officer, is responsible for the academic mission of the University. The Council of Deans and University Senate provide advice to the Chancellor and Provost on all aspects of planning and budgeting. The University Planning and Budgeting Committee (PBC), chaired by the Provost, acts in an advisory capacity to the Chancellor. The senior vice chancellors and the chairs and heads of responsibility centers, with
II
Using Assessment to Improve
Institutional Effectiveness
the participation of their planning and budget-ing committees, develop unit-level plans and budgets. Thus, each unit has an individualized planning and budgeting process that fits into the overall structure of the University’s Planning and Budgeting System.
The University’s Planning and
Budgeting System
The University adopted its Planning and Budgeting System (PBS)3 in 1992, replacing the earlier Planning and Resource Management System. PBS combines long-range planning and budgeting; operational plans and budgets based on performance, personnel, capital, and financial budgets; budget modifications and augmenta-tions; facilities management and development; and evaluation of all University programs and responsibility centers.
PBS was intended to promote transparency, cooperation, and coordination among members of the University community; to increase accountability; and to improve planning and budgeting decision making.
Since its creation in 1992, PBS has been reviewed and revised twice. In 1995, the Ad Hoc Planning and Budgeting System Review Committee was charged with evaluating PBS and recommending modifications for its improvement. After significant research and analysis, the committee noted in its 1996 report that “PBS has made a difference in the quality and effectiveness of planning and budgeting activities and can continue to do so” (see Institutional Effectiveness Working Group Report). Nonetheless, the committee developed 12 specific recommendations to address PBS’s shortcomings or areas identified for improve-ment, which can be summarized as follows:
• PBS has not yet fully achieved its goals but has the potential to evolve into a process that will change the management culture of the University.
• The PBS guidelines should continue to steer, in the short term, University planning and
budgeting activities. The guidelines should provide adequate flexibility to recognize differences among units and the role of other governance structures. A future review should consider reformulating the guidelines as the University gains more experience with PBS.
• University leaders should support and be comfortable with PBS and shared gover-nance and make effective use of unit-level planning and budgeting committees (PBC) to improve decision making.
• Widespread dissemination of PBC activities will promote transparency and the effective-ness of the planning and budgeting process and will enhance unit accountability.
The committee’s recommendations were adopted in a subsequent revision of PBS. Consistent with one of the recommendations, a second Ad Hoc Planning and Budgeting System Evaluation Committee was charged in 2002. Based on assessment results, this commit-tee made seven recommendations, all of which were adopted into a revised PBS in 2003. The recommendations further clarified the roles of key stakeholders, including the Faculty Assembly, Staff Association Council, Senate Council, deans, department chairs, and the Provost, and encour-aged regular reporting and assessment of plans and budgets at all levels of the University.
As a result of accrued experience using PBS and the recommendations provided by two ad hoc review committees, PBS itself has improved markedly over time, facilitating the University’s efforts to achieve its mission by promoting the articulation of clear and measurable goals, trans-parency, and open dialogue and communication.
The University Senate also facilitates assessment of PBS. The Senate Budget Policies Committee (SBPC) monitors planning and budgeting processes, fosters broad participation across the University, ensures transparency, and considers benchmarking data in its recommenda-tions. The senate can affect University-level goals and decisions by highlighting University policies and processes (see PBS Document, section 3 www.academic.pitt.edu/pb/index.htm
15
university of Pittsburgh self-study rePort 2012
1.3.3). Where there are major policy differences with the administration, SBPC raises those issues. SBPC uses benchmarking data in forming its recommendations. For example, benchmark-ing data about compensation levels at member institutions of the Association of American Universities informed its salary increase recom-mendations. SBPC also surveys responsibility centers to ascertain whether unit-level PBCs are operating, and, in the spirit of transparency and benchmarking, it ensures that information about average salaries at the University of Pittsburgh and peer group comparisons is disseminated to the University community.
Annual Planning at the University
of Pittsburgh
The annual planning process for the Provost’s area responsibility centers begins in December, when the Provost sends a letter to deans, directors, and campus presidents with instructions for the upcoming fiscal year annual plan. Each school and unit develops a 5–10-year strategic plan, annually assesses progress against the goals in the strategic plan, and adjusts strate-gies as necessary for the following year.
The annual plans are first reviewed by the planning and budget committees within each school or unit. The responsibility centers then submit their annual plans to the Provost in March. In April, the Provost’s Area Planning and Budgeting Committee (PAPBC), which comprises members of the unit-level PBCs, assesses the annual plans, the processes used for their development and review, and how well the plans align with University-level goals and strategies. The annual plans also are assessed by senior staff members in the Office of the Provost. When both groups have completed their reviews and communicated their findings to the Provost, typically in May, the Provost sends a letter to each dean, director, and campus president pro-viding detailed feedback on his/her annual plans and guidance for continued improvement along with a copy of PAPBC’s review.
Retrospective analysis of the last 12 years of this planning and assessment process
demonstrates improvements in the planning process that are partly based on increased use of additional assessment tools and strategies. For example, Provost Maher commented in his review of annual plans for fiscal year 2001 that responsibility centers should not embark on a massive reformulation of plans each year:
“Rather, our planning should
foster a culture of continuous improve- ment wherein an annual reflection on the successes and failures of the past year and on changes in the national and international scene that carry implications for the unit’s priorities combine to form a midcourse correction to improve the plan.”
The Provost continued to encourage a commitment to continuous improvement in subsequent annual instructions to the responsi-bility centers, stating in 2002 that “We have now moved into a culture of continuous improve-ment, looking to build upon the strengths of our identified priorities toward improvements beyond our realized successes.” In 2005, he requested “consideration of what you have learned about your unit and how that knowledge can help you improve further.”
In 2007, the Provost convened an ad hoc working group to formulate instructions for improving planning, charging it with developing new annual planning instructions “that would be responsive to the urgency that we [the University] continually better ourselves, clearly show results of the previous year’s activities in terms of the goals articulated in the previous year’s plans, and commit to goals for the coming year in support of the longer range goals for improvement of the school or unit, as well as the University.” The ad hoc working group recommended improving the alignment of the responsibility centers’ activities with the University mission and the key goals of the Provost’s area and recommended that annual plans develop more specific short- and long-term goals and use metrics to measure incremental progress toward longer-term goals. This recom-mendation resulted in the creation of a new template model for annual plans. By using the
template, schools and units would submit plans with better-defined strategic priorities, more clearly described goals, specific continuing actions that will lead to those goals, and specific measure-able outcomes to assess success in reaching each goal. These recommendations became the basis of instructions for the fiscal year 2009 plans. The fiscal year 2010 and fiscal year 2011 plans expanded on and emphasized the need to include quantitative metrics to measure progress and document success.
University of Pittsburgh
Benchmarking Activities
In 2003, the University adopted its current set of peer and aspirational peer institutions as well as metrics against which it would measure progress toward key goals. Based on similarity of mission, student characteristics, academic program offerings, geographic location, and rankings on key metrics, the peer institutions were selected. Aspirational peer institutions were universities similar in scope to the University of Pittsburgh but were superior on key uni-versity benchmarks (see Figure 1, Uniuni-versity Benchmarks 2002–11).
These metrics were chosen because they are useful indicators of performance among American research universities. In addition, relevant data for peer and aspirational peer institutions could be readily obtained, making it possible to gauge performance at any given point in time and rates of change over time across institutions. Similar benchmarking strategies were adopted by the regional campuses, which identified separate peer and aspirational peer institutions and metrics relevant to their unique missions and scopes. Over time, this strategy has been implemented at all levels of the University.
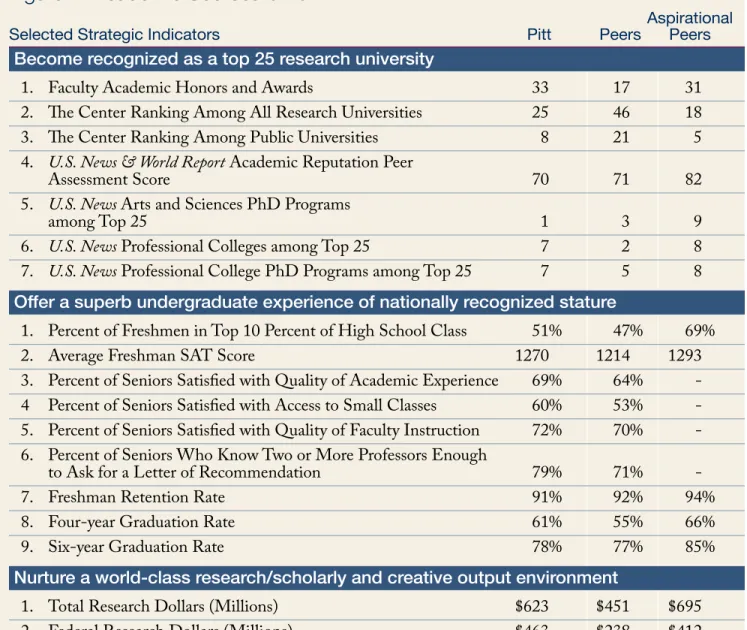
In 2006, the benchmarking process was refined to generate an annual “academic scorecard,” which summarizes the University’s standing relative to peer and aspirational peer institutions and explicitly highlights annual progress on 41 key strategic indicators organized under six goals linked to the mission of the University (see Figure 2, Academic Scorecard
2011). These annual scorecards provide a valuable snapshot of the University’s most recent perfor-mance and also indicate how it is progressing from year to year in comparison with its identi-fied peer and aspirational peer institutions. This information, used reflectively, can point out areas in which the University is doing well and areas in which it needs to work for improvement.
Data generated through the benchmarking process serve important functions for planning and resource allocation purposes. They provide operational measures for assessing progress toward achieving University goals, provide the information for communication of the University’s criteria for success to the University community and external constituents, and serve as checkpoints for strategic planning. Each year, these data are disseminated in a variety of forms to University administrators; faculty; and external constituents, such as University alumni. The University Planning and Budgeting Committee annually reviews these data to identify key areas for financial investment.
Benchmarking data have provided the raw materials that helped to shape University poli-cies. For example, it was recognized that annual total research dollars provided an important measure for gauging the University’s progress toward becoming a leading research institution. In fiscal year 2001, total research and develop-ment (R&D) expenditures were $349 million, compared to a mean amount of $418 million reported by our aspirational peers. By fiscal year 2009, however, R&D expenditures had increased to $623 million, ranking only slightly below the mean of the University’s aspirational peers. Achieving success in obtaining external funding requires both talented faculty members and a state-of-the-art research infrastructure to support their work. New policies were promoted to ensure an appropriate faculty talent pool, including recruitment strategies that emphasize both teaching and research potential, tenure and promotion guidelines that reward a faculty member’s ability to generate external research support, support for developing the ability to identify funding sources and secure funding, and
17
university of Pittsburgh self-study rePort 2012
figure 1: university benchmarks 2002–11
Student Characteristics
• Fall First-time, Full-time Freshman Test Scores, SAT/ACT 25th and 75th Percentiles
• Freshmen in the Top 10 Percent and Top 25 Percent of Their High School Graduating Class
• Total First-time, First-year Applications
• Percent of First-time, First-year Applicants Accepted
• Percent and Number of First-time, First-year Accepted Applicants Who Matriculated
• Percent of Undergraduate Student Body by Race/Ethnicity, Sex, and Residency
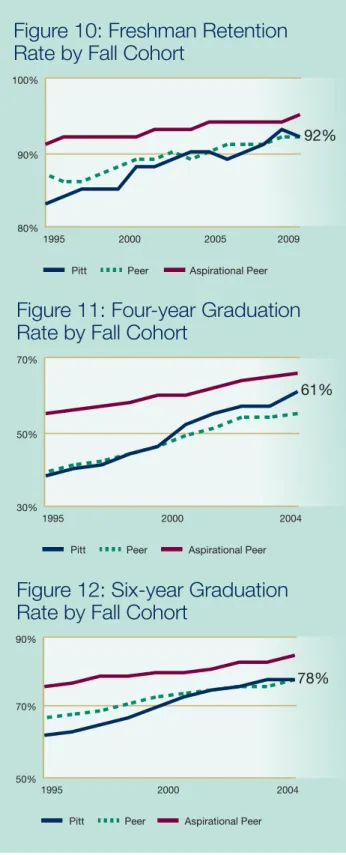
• Freshman-to-Sophomore Retention Rate
• Four-year and Six-year Graduation Rate
• Graduate and First Professional Enrollment as a Percentage of Total Head Count Enrollment
Research and Intellectual Activity • Total Faculty Who Are National
Academy Members
• Total Volumes Held in the Library
• Rank in the Association of Research Libraries Index
• Total Library Expenditures per Teaching Faculty and per Full-time Student
• Total R&D Expenditures and Federally Financed R&D Expenditures
• Distribution of Total R&D Expenditures by Source and by Field
• National Science Foundation Ranking among Universities
• Invention Disclosures Received
• Total U.S. Patent Applications Filed and Issued
• Licenses and Options Executed
• Gross License Income Received per License/ Option Yielding License Income
Finance
• Total Voluntary Support
• Alumni Donors as a Percentage of Alumni of Record
• Average Amount Given per Alumni Donor
• National Ranking in Annual Giving
• Distribution of Voluntary Support by Source
• University Endowment as of June 30
• Average Salaries of Professors, Associate Professors, and Assistant Professors
Instruction
• Percent of Top Three Faculty Ranks with Tenure
• Percent of Faculty Who Are Full Time
• Percent of Full-time Faculty with Highest Terminal Degree
• Student:Faculty Ratio
• Total Degrees Granted
• Bachelor’s Degrees as a Percentage of Total Degrees Granted
• Percent of Bachelor’s Degrees Awarded in the Arts and Sciences
• Total Doctoral Degrees Granted
• Percent of Undergraduate Class Sections with Fewer than 20 Students
• Percent of Undergraduate Class Sections of 50 Students or More