Dr. Sarla Biloniyaet al IJSRE Volume 05 Issue 04 April 2017 Page 6313 Volume||5||Issue||04||April-2017||Pages-6313-6325||ISSN(e):2321-7545 Website: http://ijsae.in
Index Copernicus Value- 56.65 DOI: http://dx.doi.org/10.18535/ijsre/v5i04.04
Calculation of Topological Descriptor For Qsar Study on Carbonic Anhydrase
Inhibitor-I (Ca-I)
Authors
Dr. Sarla Biloniya1, Dr. R.G. Verma2, Dr. Aruna Solanki3
1,2
PMB gujrati science college Indore
3
BLP Govt. College, Mhow (M.P.)
E-mail: [email protected], [email protected]
ABSTRACT:
In this paper we report that QSAR study on carbonic anhydrase inhibitor-I (CA-I) using some topological descriptor on substituted aromatic sulphonamide. We restrict ourselves on topological indices viz. Balabon index (J) Randic connectivity based index (χ) Winner index (W), JHETZ, JHETM, JHETV, JHETP, BAC.
Keywords: CA-I, J, W, χ, JHETZ, JHETM, JHETV, JHETP, BAC
INTRODUCTION
Quantitative Structure Activity (QSAR) technique represents an effort to link structural or property descriptors of compound with activities. These physico-chemical descriptors which obtain in parameters to accounts for hydrophobicity, topology, electronic parameters and steric effects, are determined empirically or more recently by computational methods. Quantitative Structure Activity Relationship (QSAR) is currently being applied in assessment.bioactive molecules have been discovered by one of several methods1:
QSAR has reward of speed and simplicity and it can, in some cases, account for some transport and metabolic processes which occur once the compound is administered. Hence, the method is often applicable
to the analysis of in vivo data. Quantitative Structure Activity (QSAR) is the method of choice. The method,
using multivariate statistics, was developed by Hansch and Fujita2,
The sulfonamides represent an important class of biologically active compounds with at least five different classes of pharmacological agents that have obtained from the sulfonamide structure as lead. The antibacterial sulfonamides continue to play an important role in chemotherapy, alone or in combination with other drugs. Furthermore, the sulfonamides that inhibit the zinc enzyme carbonic anhydrase pouses many
applications as diuretic, antiglucoma or antiepileptic drugs among others3. Some antithyroid drugs have also
been developed starting from the sulfonamide structure as lead molecule4.
Carbonic anhydrase (CA) catalyzes the inter-conversion of carbon dioxide to biocarbonate. There are three classes α, β, and γ of CA, divided into three genetically unrelated families, viz: animal, plant and bacterial CAs, respectively 5-6.
CAs were proved to be very important as they are involved in crucial physiological processes, connected with the catalysis of the reversible hydration of carbon dioxide to bicarbonate and a proton, as these chemical species are important in many physiological processes. This is a crucial reaction for respiration and
transport of CO2/bicarbonate between metabolizing tissues and excretion sites, secretion of electrolytes in a
Dr. Sarla Biloniyaet al IJSRE Volume 05 Issue 04 April 2017 Page 6314
inhibitors (CAIs) may be exploited for the design of therapeutic agents useful in the management and
prevention of many diseases.7-11
A great number of sulfanilamide derivatives were synthesized, characterized, tested and are widely used in
clinical medicine as pharmacological agents with a wide variety of biological actions.12-13More specifically,
sulfonamide inhibitors of CA are extensively used in clinical medicine and as diagnostic tools, their main applications being in the treatment of glaucoma, macular edema, epilepsy and other neurological disorders. Carbonic anhydrase – I is a zinc dependent enzyme. It catalyzes the reversible hydration of carbon dioxide
through a two step zinc hydroxide mechanism.14-15
CA catalyses the interconversion of CO2 to HCO3-in a two-stage reaction. Human CA catalyzes the
reversible hydration of CO2 in two distinct half reactions.16-17 The first step of the reaction involves the
tapping of the CO2 substrate within a putative hydrophobic pocke18. The CO2 displaces a water molecule,
‘the deep water’, in the active site by associating with the amide nitrogen of Thr199 in a hydrogen-bonding interaction prior to a nucleophilic attack on the substrate carbon to form biocarbonate. The bicarbonate is then displaced from the zinc ion by an active-site water molecule, concluding the first-half (Equation (a)). The second-half reaction involves the transfer of a proton from the zinc-bound water molecule to residue
His64 through a chain of hydrogen-bonded water molecules.19 This intramolecular proton transfer is
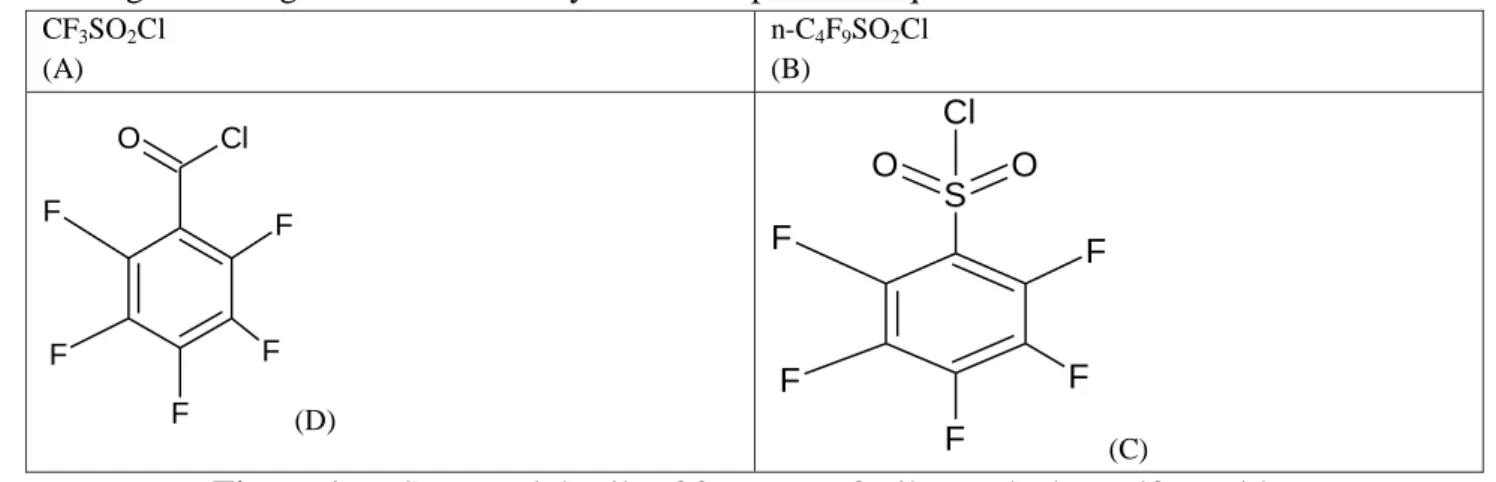
followed by an intermolecular proton transfer from His64 to bulk solvent (B) of the system. This second step regenerates the zincbound hydroxyl group, allowing for another round of catalysis to proceed (Equation (b)). In present investigation, quantum chemical descriptors: Mulliken charge on sulfonamide carbon, Nitrogen, Oxygen and Hydrogen,HOMO energy (ÎHOMO in eV) and LUMO energy (ÎLUMO in eV), have been used for QSAR study of ninety five derivatives of sulfonamide (Figure 1 a, b) . Because of the huge and well-defined physical information encoded in many theoretical descriptors , their use in the QSAR study presents two main advantages: (a) The compounds and their various fragments and substituents can be directly characterized on the basis of their molecular structure only and (b) The proposed mechanism of action can be directly accounted for the chemical reactivity of the compounds under study. Consequently, the derived QSAR models will include information regarding the nature of the intermolecular forces involved in determining the biological or other activity of the compounds in question.
CF3SO2Cl (A)
n-C4F9SO2Cl (B)
O Cl
F
F
F F
F
(D)
F
F
F
F F S
O O
Cl
(C)
Figure 1.a : Structural details of four type of tails attached to sulfonamides
METHODOLOGY :
Dr. Sarla Biloniyaet al IJSRE Volume 05 Issue 04 April 2017 Page 6315 Biological Activity:
Activity analyzed in the present study is the logKi (logarithmic value of Inhibitory Concentration). The Carbonic Anhydrase Inhibition activity is usually expressed in terms of logarithmic concentration. In present study, this biological activity logKi is adopted from the literature.
The topological parameters will be used in the investigations are :
Wiener Index (W):
Wiener index is defined as the sum of the chemical bonds existing between all pairs of carbon atoms in the molecule under consideration. The index was later shown by Hosoyo to be equivalent to one half the sum of the entries in the distance matrix of the graph of the molecule. In symbol, the Wiener index can thus be defined as follow ?
W(G) = 1/2 dij
i j
Where dij represents the ijth entry in the distance matrix of the graph G.
Randic Connectivity Index ()
The next major topological index was that of Randi'c. This index, which is now-a-days widely referred as
the molecular connectivity index. The index has the symbol and is widely known in the biological sciences
and in the physical sciences because of its widespread applications. In its original form index was defined in the following way:
(G) = (Pi Pj)-1/2
edges
where Pi and Pj represents the degree of the adjacent pair of the vertices i and j in G
for graph(G).
Balaban Branching Index (J): ?
The topological index of Balaban is based on the distance matrix of the graph G and is known as the average distance sum connectivity index. For tree graph The index may be written as :
J(G) = ne x (Si Sj)-1/2
where ne is the number of edges in the tree and Si and Sj represents, the sums of the ith and jth row
respectively of the distance matrix of the tree.
Segzed Index (Sz):
Another molecular-graph-distance-based topological index namely Szeged index has been used in the
present investigation. This index was conceived in Szeged Hungary by Gutman et al.
The Szeged index, Sz = Sz(G) of G is defined as
Sz = Sz(G) = nunv u,v
where summation goes over all edges (u,v) in a cyclic graph G,
Where, nu and nv are the number of vertices on either side of the vertex under consideration.
Molecular Topological Index (MTI):
Molecular topological index was developed by Harry. P.Schultz? by the use of the Adjacency, degree and
distance matrices that describe the structure of compounds.The MTI of graph(G) can be calculated as : MTI(G) = v(D + A)
where,
Dr. Sarla Biloniyaet al IJSRE Volume 05 Issue 04 April 2017 Page 6316 Molar refractivity (MR):
Molar refractivity is a measure of the volume occupied by an atom or group and is dependent on the temperature, the index of refraction and the pressure.
One form of the Lorentz-Lorenz formula (also known as the Clausius-Mossotti equation) gives the molar refractivity of a dilute gas as :
where R is the universal gas constant, T is the temperature, n is the index of refraction and p is the pressure.
In SI units, R has units of J mol-1 K-1, T has units K, n has no units and p has units of Pa, so the units of A are
m3 mol-1. Therefore, the molar refractivity is the volume of the substance (in cubic meters) taken up by each
mole of that substance.
Molar Volume (MV):
The molar volume, symbo is the volume occupied by one mole of a substance (chemical element or
chemical compound) at a given temperature and pressure. It is equal to the molar mass (M) divided by the
mass density (ρ). It has the SI unit cubic metres per mole (m3/mol),[1] although it is more practical to use the
units cubic decimetres per mole (dm3/mol) for gases and cubic centimetres per mole (cm3/mol) for liquids
and solids.
The molar volume of a substance can be found by measuring its mass density then applying the relation :
.
Parachor (Pc):
Parachor is a scientific quantity defined according to the formula: Pc = γ1/4
* M / d
where γ1/4 is the fourth root of surface tension, M is the molar mass and d is the density.
"Parachor "has been used in solving various structural problems.
Index of Refraction (IR):
The refractive index (or index of refraction) is a measure of how much the speed of light (or other waves such as sound waves) is reduced inside the medium. For example, typical soda-lime glass has a refractive index of 1.5 which means that in glass, light travels at 1 / 1.5 = 0.67 times than the speed of light in a vacuum. Two common properties of glass and other transparent materials are directly related to their refractive index. First, light rays change direction when they cross the interface from air to the material, an effect that is used in lenses. Second, light reflects partially from surfaces that have a refractive index different from that of their surroundings.
Surface Tension (ST):
Surface tension (ST) or Inter facial tension is the cumulative effect of the different intra and intermolecular forces of two different surfaces. This physico-chemical parameter is directly related to parachor (Pc) which in turn is related to molar volume (MV). Thus, we can treat ST, as a steric parameter.
The relationship between MV, Pc and ST could only be expressed through the expression for parameter. These three forms are expressed by the following equations:
Molar Volume = MV = MW/d
Pc = (MW/d) ST1/4
Surface Tension = ST = (Pc/MV)4
Since ST is inversely proportional to MV, therefore, this is an inverse steric effect.
Density (D):
Dr. Sarla Biloniyaet al IJSRE Volume 05 Issue 04 April 2017 Page 6317
constant volume. In order to determine the density of an object, it is necessary to know: the mass, the volume of the substance and the definition of density.
Density = mass (g) volume (mL)
Polarizability (Pol):
Polarizability is the relative tendency of a charge distribution like the electron cloud of an atom or molecule, to be distorted from its normal shape by an external electric field, which may be caused by the presence of a nearby ion or dipole.
The electronic polarizability(α) is defined as the ratio of the induced dipole moment of an atom to the
electric field that produces this dipole moment.
α = P / E
Indicator Parameters :
Indicator parameters are considered as dummy parameter which represents the nature or position or type of substitution or any specific feature in the molecule. In present study, indicator parameters are used to specify the type and position of substitution on the parent moiety. They are used in the unit numbers as 0 or 1 for representation of presence or absence of any specific feature.
In present study indicator parameters tested are as below :
I1 = Presence of tail A by 1 otherwise 0.
I2 = Presence of tail B by 1 otherwise 0.
I3 = Presence of tail C by 1 otherwise 0.
I4 = Presence of tail D by 1 otherwise 0.
The Quantum molecular properties describes various 3D structural/functional features of the compounds viz., Mulliken charge on C, N, O and H atom of sulfonamide tail, HOMO LUMO etc. These quantum properties may help to characterize membrane transportation, inter and intra molecular forces in Drug receptor complex, Energy of ligand receptor complex, metabolic function and route of drug transformations, etc. These features plays the dominating role in deciding the biological activity or function of any molecule or chemical systems.
3D properties are proposed to study in the present work are as follows
Mulliken Charge :
Mulliken charges arise from the Mulliken population analysis and provide a means of estimating partial atomic charges from calculations carried out by the methods of computational chemistry, particularly those based on the linear combination of atomic orbitals, molecular orbital method and are routinely used as variables in linear regression (QSAR) procedures. If the coefficients of the basis functions in the molecular
orbital are Cμi for the μ'th basis function in the i'th molecular orbital, the density matrix terms are:
for a closed shell system where each molecular orbital is doubly occupied. The population matrix then
has terms
is the overlap matrix of the Basis functions. The sum of all terms of summed over is the gross
orbital product for orbital - . The sum of the gross orbital products is N - the total number of
electrons. The Mulliken population assigns an electronic charge to a given atom A, known as the gross atom
Dr. Sarla Biloniyaet al IJSRE Volume 05 Issue 04 April 2017 Page 6318
then defined as the difference between the number of electrons on the isolated free atom, which is the atomic
number , and the gross atom population:
The problem with this approach is the equal division of the off-diagonal terms between the two Basis functions. This leads to charge separations in molecules that are exaggerated. In a modified Mulliken
population analysis,[5] this problem can be reduced by dividing the overlap populations between the
corresponding orbital populations and in the ratio between the latter. This choice, although still
arbitrary, relates the partitioning in some way to the electronegativity difference between the corresponding atoms.
HOMO and LUMO
HOMO and LUMO are acronyms for highest occupied molecular orbital and lowest unoccupied molecular orbital, respectively. The difference of the energies of the HOMO and LUMO, termed the band gap, can sometimes serve as a measure of the excitability of the molecule: the smaller the energy, the more easily it will be excited.
The HOMO level is to organic semiconductors and quantum dots what the valence band is to inorganic semiconductors. The same analogy exists between the LUMO level and the conduction band. The energy difference between the HOMO and LUMO level is regarded as band gap energy.
When the molecule forms a dimer or an aggregate, the proximity of the orbitals of the different molecules induces a splitting of the HOMO and LUMO energy levels. This splitting produces vibrational sub levels which each have their own energy, slightly different from one another. There are as many vibrational sub levels as there are molecules that interact together. When there are enough molecules influencing each other (e.g. in an aggregate), the number of sublevels are large enough to be perceived as a continuum rather than discrete levels.
These electronic parameters are calculated using computer software MMDPro
CALCULATION OF TOPOLOGICAL DESCRIPTORS
In order to deduce the correlation of observed activity, in terms of logKi of reported compounds with different structural parameters, systematic QSAR investigations have been carried out using the QSAR model proposed.
First, the chemical structures were designed using chem.sketch and were 3D optimized saved as .mol
files.112The DRAGON program was used to calculate the values of topological descriptors shown in Table
2. Topological indices are 2D descriptors which take into account the internal atomic arrangement of
compounds and encode in numerical form information about molecular size, shape, branching, presence of heteroatoms and multiple bonds. Topological indices are a very useful tool for QSAR taking into account
their simplicity and rapidity of computation This is particularly valuable now as one can analyze structures
used for QSAR studies prior to any high throughput synthesis and testing. Calculation of Quantum Chemical Descriptors
A huge source of molecular descriptors can be found directly through quantum chemical calculations. Recent advances in hardware and the development of e_cient algorithms have assisted the routine development of molecular quantum chemical descriptors. Quantum chemical calculations, in principle, can express all of the electronic and geometric properties of a molecule as the electronic structure is fundamental to other molecular observables. The quantum chemical descriptors used throughout this work will be presented in Table 3.
Dr. Sarla Biloniyaet al IJSRE Volume 05 Issue 04 April 2017 Page 6319
Schrodinger equation are approximate due to mathematical and computational complexities and the CPU time is exponential to a high power of the number of electrons, thereby limiting ab initio calculations to short series of relatively small molecules. Depending on the size of the system, either semi-empirical or ab initio theory is applicable. Intermediate between ab initio and semi-empirical methods in terms of computational resources are the algorithms based on density functional theory.
Indicator Parameters
Indicator variables are not QSAR parameters but are used to indicate the significance of any particular group or species at a particular substitution site in a given series of drugs.
They possess only two values 1 or 0 (zero), 1 represent presence of particular group or atom and zero represents absence of particular group or an atom.
The values assigned to different indicator parameters are as follows :
I1 = 1 if tail A is attached to substituted aromatic sulphonamides, otherwise zero.
I2 = 1 if tail B is attached to substituted aromatic sulphonamides, otherwise zero.
I3 = 1 if tail C is attached to substituted aromatic sulphonamides, otherwise zero.
I4 = 1 if tail D is attached to substituted aromatic sulphonamides, otherwise zero.
CONCLUSION:
On the basis of calculation conclusion can be drawn that, The statistical analyses based on Mulliken Charge on C, Vanderwaal volume, connectivity in the molecule, size of the molecule and Mass whetted connectivity parameters led us to propose the explanation of the structure-activity relationships which covers a wide range of substituent’s with different nature and molecular effects as well as a variety of physico-chemical interaction involved in the enzyme – inhibitors complex.
Acknowledgement
I thankfull to my research guide Dr. R.G. Verma and also thankfull to my senior Dr. Aruna Solanki
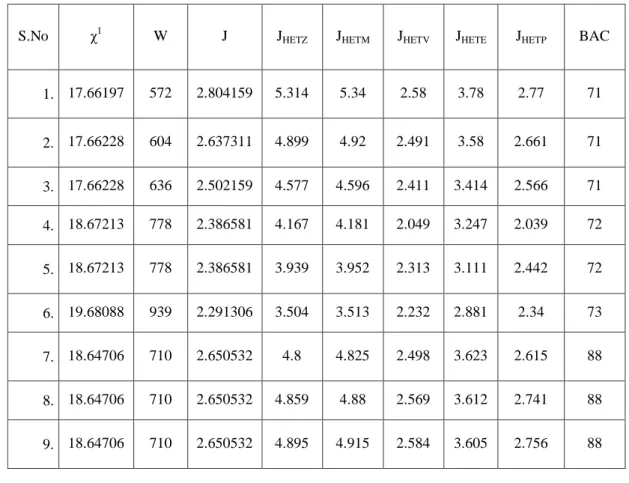
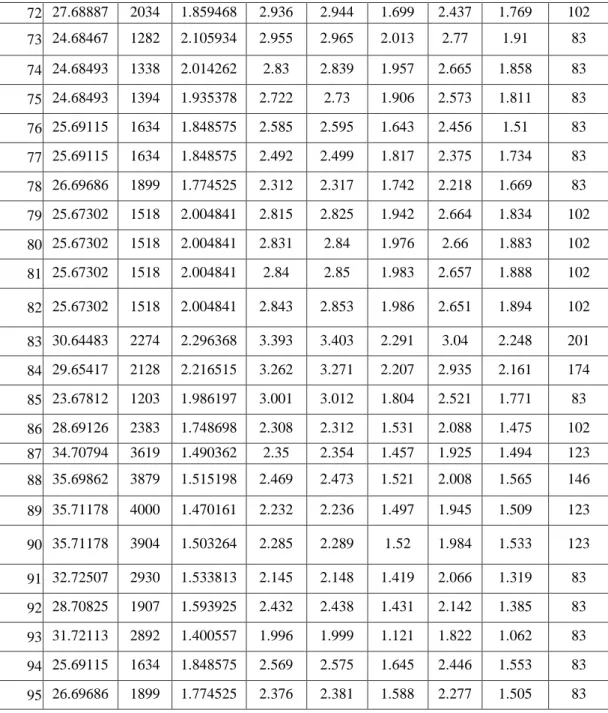
Table 1 : Topological Descriptors calculated for substituted aromatic Sulphonamides used in present investigation.
S.No χ1 W J JHETZ JHETM JHETV JHETE JHETP BAC
1. 17.66197 572 2.804159 5.314 5.34 2.58 3.78 2.77 71
2. 17.66228 604 2.637311 4.899 4.92 2.491 3.58 2.661 71
3. 17.66228 636 2.502159 4.577 4.596 2.411 3.414 2.566 71
4. 18.67213 778 2.386581 4.167 4.181 2.049 3.247 2.039 72
5. 18.67213 778 2.386581 3.939 3.952 2.313 3.111 2.442 72
6. 19.68088 939 2.291306 3.504 3.513 2.232 2.881 2.34 73
7. 18.64706 710 2.650532 4.8 4.825 2.498 3.623 2.615 88
8. 18.64706 710 2.650532 4.859 4.88 2.569 3.612 2.741 88
Dr. Sarla Biloniyaet al IJSRE Volume 05 Issue 04 April 2017 Page 6320 10. 18.64706 710 2.650532 4.907 4.93 2.593 3.592 2.772 88
11. 23.61557 1192 3.22238 6.137 6.161 3.229 4.387 3.548 181
12. 22.62657 1096 3.074247 5.855 5.877 3.064 4.186 3.364 156
13. 16.6511 525 2.569265 5.678 5.711 2.166 3.275 2.428 71
14. 17.6355 595 2.705213 6.408 6.446 2.396 3.672 3.678 88
15. 21.67497 1245 2.2928 3.528 3.536 1.915 2.718 1.979 92
16. 27.699 2069 1.841759 3.527 3.534 1.769 2.395 1.976 107
17. 28.68766 2243 1.891761 3.785 3.793 1.881 2.55 2.109 128
18. 28.70413 2334 1.814664 3.217 3.223 1.846 2.44 2.004 107
19. 28.70413 2262 1.870175 3.337 3.343 1.885 2.507 2.052 107
20. 25.72022 1618 1.869181 3.02 3.025 1.707 2.575 1.677 71
21. 21.69683 945 1.947815 3.821 3.834 1.731 2.677 1.878 71
22. 24.71494 1564 1.712223 2.841 2.846 1.354 2.258 1.372 74
23. 18.67213 778 2.386581 4.058 4.071 2.08 2.215 2.187 72
24. 19.68088 939 2.291306 3.591 3.6 2.03 2.963 2.122 73
25. 26.6283 1670 3.233248 5.008 3.039 2.258 3.942 2.809 206
26. 26.62846 1738 3.102796 4.788 4.817 2.693 3.812 2.74 206
27. 26.62846 1806 2.989344 4.4 4.627 2.634 3.696 2.677 206
28. 27.63667 2092 2.858076 4.352 4.374 2.328 3.559 2.27 207
29. 27.63667 2092 2.858076 4.19 4.21 2.542 3.453 2.582 207
30. 28.64423 2406 2.74446 3.866 3.883 2.461 3.253 2.498 208
31. 27.61911 1952 3.083709 4.752 4.781 2.694 3.823 2.723 235
32. 27.61911 1952 3.083709 4.778 4.806 2.731 3.818 2.786 235
33. 27.61911 1952 3.083709 4.794 4.823 2.739 3.815 2.793 235
34. 27.61911 1952 3.083709 4.8 4.828 2.743 3.807 2.8 235
Dr. Sarla Biloniyaet al IJSRE Volume 05 Issue 04 April 2017 Page 6321 36. 31.60753 2662 3.371816 5.449 5.477 3.065 4.214 3.199 339
37. 25.61952 1578 3.065298 5.079 5.114 2.501 3.619 2.611 206
38. 26.61008 1720 3.147923 5.517 5.555 2.684 3.888 2.814 235
39. 30.64236 2973 2.694989 3.82 3.834 2.214 3.087 2.239 239
40. 36.66542 4400 2.008973 3.387 3.398 1.855 2.5 1.986 266
41. 37.65754 4700 2.036619 3.54 3.552 1.929 2.598 2.074 299 42. 37.6704 4836 1.981271 3.212 3.221 1.901 2.525 2.004 266 43. 37.6704 4728 2.022231 3.286 3.296 1.927 2.57 2.033 266
44. 34.67975 3598 2.07594 3.137 3.148 1.801 2.668 1.764 206 45. 30.65693 2412 2.159897 3.57 3.587 1.792 2.73 1.867 206 46. 33.67449 3571 1.896203 2.872 2.881 1.442 2.361 1.441 209 47. 27.63667 2092 2.858076 4.282 4.303 2.336 3.543 2.373 207 48. 28.64423 2406 2.74446 3.943 3.96 2.271 3.331 2.306 208
49. 25.67634 1382 2.212618 3.962 3.98 2.17 2.996 2.294 102
50. 25.67658 1442 2.117229 3.751 3.767 2.109 2.88 2.223 102 51. 25.67658 1502 2.035005 3.575 3.589 2.053 2.779 2.16 102 52. 26.68298 1755 1.940481 3.317 3.328 1.759 2.643 1.752 102 53. 26.68298 1755 1.940481 3.173 3.184 1.949 2.554 2.041 102
54. 27.68887 2034 1.859468 2.872 2.88 1.862 2.374 1.942 102
55. 26.66529 1631 2.103266 3.68 3.696 2.082 2.87 2.176 123
56. 26.66529 1631 2.103266 3.705 3.72 2.122 2.865 2.239 123
57. 26.66529 1631 2.103266 3.72 3.736 2.129 2.862 2.245 123 58. 26.66529 1631 2.103266 3.725 3.741 2.133 2.856 2.253 123 59. 31.63891 2416 2.386561 4.328 4.344 2.428 3.233 2.62 230 60. 30.64783 2265 2.307683 4.18 4.194 2.345 3.129 2.527 201 61. 24.66959 1301 2.091261 4.085 4.105 1.95 2.731 2.125 102 62. 25.65805 1426 2.150865 4.463 4.485 2.096 2.946 2.296 123
63. 29.68395 2541 1.825213 2.804 2.811 1.626 2.221 1.678 123 64. 35.70136 3829 1.538604 2.814 2.821 1.528 2.02 1.677 146 65. 36.69239 4100 1.561347 2.947 2.954 1.591 2.103 1.752 171 66. 36.70532 4226 1.516035 2.638 2.644 1.565 2.037 1.685 146 67. 36.70532 4126 1.54944 2.707 2.713 1.589 2.077 1.714 146
68. 33.71779 3107 1.589775 2.596 2.602 1.493 2.183 1.483 102
69. 29.70027 2039 1.660985 3.093 3.103 1.524 2.284 1.635 102
Dr. Sarla Biloniyaet al IJSRE Volume 05 Issue 04 April 2017 Page 6322 72. 27.68887 2034 1.859468 2.936 2.944 1.699 2.437 1.769 102
73. 24.68467 1282 2.105934 2.955 2.965 2.013 2.77 1.91 83 74. 24.68493 1338 2.014262 2.83 2.839 1.957 2.665 1.858 83 75. 24.68493 1394 1.935378 2.722 2.73 1.906 2.573 1.811 83 76. 25.69115 1634 1.848575 2.585 2.595 1.643 2.456 1.51 83 77. 25.69115 1634 1.848575 2.492 2.499 1.817 2.375 1.734 83 78. 26.69686 1899 1.774525 2.312 2.317 1.742 2.218 1.669 83 79. 25.67302 1518 2.004841 2.815 2.825 1.942 2.664 1.834 102 80. 25.67302 1518 2.004841 2.831 2.84 1.976 2.66 1.883 102 81. 25.67302 1518 2.004841 2.84 2.85 1.983 2.657 1.888 102
82. 25.67302 1518 2.004841 2.843 2.853 1.986 2.651 1.894 102
83. 30.64483 2274 2.296368 3.393 3.403 2.291 3.04 2.248 201 84. 29.65417 2128 2.216515 3.262 3.271 2.207 2.935 2.161 174 85. 23.67812 1203 1.986197 3.001 3.012 1.804 2.521 1.771 83 86. 28.69126 2383 1.748698 2.308 2.312 1.531 2.088 1.475 102 87. 34.70794 3619 1.490362 2.35 2.354 1.457 1.925 1.494 123 88. 35.69862 3879 1.515198 2.469 2.473 1.521 2.008 1.565 146 89. 35.71178 4000 1.470161 2.232 2.236 1.497 1.945 1.509 123
90. 35.71178 3904 1.503264 2.285 2.289 1.52 1.984 1.533 123
91. 32.72507 2930 1.533813 2.145 2.148 1.419 2.066 1.319 83 92. 28.70825 1907 1.593925 2.432 2.438 1.431 2.142 1.385 83 93. 31.72113 2892 1.400557 1.996 1.999 1.121 1.822 1.062 83 94. 25.69115 1634 1.848575 2.569 2.575 1.645 2.446 1.553 83 95. 26.69686 1899 1.774525 2.376 2.381 1.588 2.277 1.505 83
Where,
χ1 = Randic connectivity Index, W = Wiener Index, J = Balaban Branching Index, JHETZ = Balaban type
index for Z weighted distance matrix, JHETM = Balaban type index for mass weighted distance matrix, JHETV
= Balaban type index for van der waal weighted matrix, JHETE = Balaban type index for electronegativity
weighted distance matrix, JHETP = Balaban type index for polarizability weighted distance matrix.
Table 2 : Quantum chemical descriptors of substituted aromatic sulphonamides used in present study.
S.No QC QN QO QH HOMO LUMO
1. -0.074 0.0089 -0.023 0.42 -0.089 -0.08
2. -0.086 0.0077 -0.023 0.42 -0.148 -0.094
3. -0.088 0.0074 -0.023 0.42 -0.151 -0.0943
4. -0.088 0.0154 -0.022 0.42 -0.092 -0.074
5. -0.088 -186 -0.023 0.41 -0.094 -0.079
6. -0.058 -0.054 -0.024 0.4 -0.079 -0.078
7. -0.088 0.0082 -0.023 0.42 -0.117 -0.084
8. -0.087 0.0096 -0.023 0.42 -0.117 -0.101
Dr. Sarla Biloniyaet al IJSRE Volume 05 Issue 04 April 2017 Page 6323
10. -0.087 0.009 -0.023 0.42 -0.346 -0.356
11. 0.103 0.01 -0.023 0.42 -0.175 -0.145
12. -0.073 0.0092 -0.023 0.42 -0.158 -0.142
13. 0.184 0.017 -0.023 0.43 -0.155 -0.112
14. 0.178 0.083 -0.008 0 -0.167 -0.111
15. 0.161 -0.39 -0.039 0.37 -0.169 -0.149
16. 0.057 0.0073 -0.23 0.42 -0.177 -0.177
17. 0.057 0.0073 -0.23 0.42 -0.183 -0.175
18. 0.056 0.0073 -0.23 0.42 -0.185 -0.174
19. 0.056 0.0073 -0.23 0.42 -0.18 -0.162
20. 0.3 0.026 -0.22 0.43 -0.151 -0.141
21. 0.2 0 -0.012 0 -0.192 -0.175
22. 0.086 0 -0.58 0 -0.213 -0.184
23. -0.014 0 -0.013 0 -0.186 -0.161
24. -0.056 0 -0.013 0 -0.163 -0.155
25. -0.088 -0.025 -0.031 0.42 -0.045 -0.035
26. 0.057 -0.045 -0.031 0.42 -0.054 -0.037
27. 0.056 -0.038 -0.031 0.42 -0.056 -0.035
28. 0.035 -0.36 -0.031 0.42 -0.041 -0.029
29. -0.024 -0.03 -0.032 0.41 -0.044 -0.032
30. -0.058 -0.065 -0.032 0.4 -0.038 -0.01
31. 0.063 -0.032 -0.031 0.42 -0.053 -0.032
32. -0.099 -0.019 -0.031 0.42 -0.075 -0.067 33. -0.099 -0.024 -0.031 0.42 -0.045 -0.037
34. -0.1 -0.025 -0.032 0.42 -0.041 -0.029
35. 0.103 -0.72 -0.032 0.42 -0.088 -0.084
36. 0.058 -0.023 -0.031 0.42 -0.084 -0.075
37. 0.183 -0.16 -0.031 0.42 -0.067 -0.029
38. 0.18 0.017 -0.62 0 -0.067 -0.02
39. 0.16 -0.39 -0.032 0.37 -0.067 -0.049
40. 0.056 -0.042 -0.031 0.42 -0.106 -0.082
41. 0.056 -0.016 -0.031 0.42 -0.104 -0.082
42. 0.056 -0.051 -0.031 0.42 -0.081 -0.077
43. 0.056 -0.042 -0.031 0.42 -0.083 -0.067
44. 0.3 -0.29 -0.031 0.43 -0.067 -0.043
45. 0.2 0 -0.021 0 -0.052 -0.047
46. 0.029 0 -0.017 0 -0.086 -0.067
47. 0.035 0 -0.097 0 -0.044 -0.031
48. -0.056 0 -0.021 0 -0.053 -0.049
49. -0.088 -0.092 -0.097 0.41 -0.101 -0.091
50. -0.088 -0.093 -0.01 0.41 -0.092 -0.063
51. 0.053 -0.093 -0.097 0.41 -0.095 -0.076
52. 0.034 -0.084 -0.097 0.41 -0.031 0.046
53. -0.025 -0.12 -0.097 0.39 -0.042 0.062
54. -0.058 -0.15 -0.097 0.38 -0.042 0.062
55. 0.057 -0.093 -0.097 0.41 -0.033 -0.029
56. 0.044 -0.091 -0.097 0.41 -0.074 -0.071
57. -0.099 -0.092 -0.097 0.41 -0.052 0.072
58. 0.085 -0.092 -0.097 0.41 -0.042 6.179
59. 0.084 -0.09 -0.097 0.41 -0.114 -0.105
Dr. Sarla Biloniyaet al IJSRE Volume 05 Issue 04 April 2017 Page 6324
61. 0.178 -0.084 -0.096 0.41 -0.126 -0.112
62. 0.172 -0.036 -0.083 0 -0.107 -0.076
63. 0.16 -0.15 -0.097 0.39 -0.119 -0.107
64. 0.053 -0.093 -0.096 0.41 -0.148 -0.146
65. 0.053 -0.093 -0.096 0.41 -0.141 -0.131
66. 0.053 -0.093 -0.096 0.41 -0.147 -0.127
67. 0.053 -0.093 -0.097 0.41 -0.142 -0.136
68. 0.294 -0.075 -0.096 0.41 -0.134 -0.113
69. 0.181 0 -0.088 0 -0.133 -0.117
70. 0.029 0 -0.085 0 -0.145 -0.138
71. -0.016 0 -0.081 0 -0.125 -0.117
72. -0.057 0 -0.089 0 -0.105 -0.093
73. -0.01 -0.34 -0.37 0.36 -0.079 -0.054
74. 0.033 -0.39 -0.37 0.36 -0.165 -0.147
75. 0.032 -0.39 -0.37 0.36 -0.165 -0.151
76. 0.032 -0.38 -0.37 0.36 -0.139 -0.095
77. -0.026 -0.43 -0.37 0.36 -0.114 -0.082
78. -0.058 -0.46 -0.37 0.34 -0.147 -0.077
79. 0.039 -0.39 -0.37 0.36 -0.165 -0.154
80. 0.058 -0.39 -0.37 0.36 -0.108 -0.093
81. 0.054 -0.39 -0.37 0.36 -0.165 -0.154
82. 0.05 -0.39 -0.37 0.36 -0.165 -0.154
83. 0.048 -0.39 -0.37 0.36 -0.175 -0.165
84. 0.05 -0.39 -0.37 0.36 -0.159 -0.144
85. 0.161 -0.38 -0.37 0.36 -0.136 -0.111
86. 0.16 -0.46 -0.34 0.36 -0.165 -0.163
87. 0.032 -0.39 -0.37 0.36 -0.176 -0.165
88. 0.032 -0.39 -0.37 0.36 -0.175 -0.165
89. 0.05 -0.4 -0.37 0.36 -0.185 -0.173
90. 0.052 -0.39 -0.37 0.36 -0.165 -0.161
91. 0.276 -0.37 -0.37 0.37 -0.155 -0.151
92. -0.096 0 -0.36 0 -0.146 -0.14
93. -0.096 0 -0.36 0 -0.168 -0.165
94. -0.023 0 -0.36 0 -0.165 -0.153
95. -0.057 0 -0.37 0 -0.155 -0.115
Where,
QC = Mulliken charge on Carbon atom of sulphonamide group, QN = Mulliken charge on Nitrogen atom of
sulphonamide group, QO = Mulliken charge on the Oxygen atom of the sulphonamide group, QH = Mulliken
charge on the Hydrogen atom of sulphonamide group, HOMO = Energy of highest occupied molecular orbital, LUMO = Energy of lowest unoccupied molecular orbital.
REFERENCES :
1. Rouvray, D. H. New Scientist 1993a, May 29, 35-38.
2. Hansch, C., Fujita, T. J. Am. Chem. Soc. 1964. 86, 1616.
3. Khadikar, P. V.; Clare, B. W.; Balaban, A. T.; Supuran, C. T.; Agrawal, V. K.; Singh, J.; Joshi, A.K.;
Lakhwani, M. Romania Rev 2005.
4. Singh, J.; Lakhwani, M.; Khadikar, P. V.; Agrawal, V. K.; Balaban, A. T.; Clare, B.W.;
Dr. Sarla Biloniyaet al IJSRE Volume 05 Issue 04 April 2017 Page 6325
6. S. Parkkila in W. R. Chegwidden, N. D. Carter, Edwards, Y.H. (eds.), Carbonic Anhydrase New
Horizons: An Overview of the Distribution and Function of Carbonic Anhydrase in Mammals, Birkhauser Verlag Basel, Switzerland, 2000, pp 80-93.
7. B. Ulmasov, A. Waheed, G. N. Shah, J. H. Grubb, W. S. Sly, C. K. Tu, D. N. Silverman, Proc. Natl.
Acad. Sci.USA, 2000, 97, 14212.
8. Supuran, C. T.; Scozzafava, A.; Casini, A. Med. Res. Rev. 2003, 23, 146.
9. Casini, A.; Scozzafava, A.; Mincione, F.; Menabuoni, L.; Supuran, C. T. J. Enz. Inh. Med. Chem.
2002, 17, 333.
10.Casini, A.; Mincione, F.; Vullo, D.; Menabuoni, L.; Scozzafava, A.; Supuran, C. T. J. Enz. Inh. Med.
Chem. 2002, 17, 9.
11.Kim, C.-Y.; Whittington, D. A.; Chang, J. S.; Liao, J.; May, J. A.; Christianson, D. W. J. Med.
Chem. 2002, 45, 888.
12.Winum, J.-Y.; Scozzafava, A.; Montero, J.-L. ;.; Supuran, C. T. Med. Res. Rev. 2005, 25, 186.
13.Cecchi, A.; Winum, J.-Y.; Innocenti, A.; Vullo, D.; Montero, J.-L.; Scozzafava, A.; Supuran, C. T.
Bioorg. Med. Chem. Lett. 2004, 14, 5775.
14.Franchi, M.; Vullo, D.; Gallori, E.; Pastorek, J.; Russo, A.; Scozzafava, A.; Pastorekova, S.;
Supuran, C. T. J. Enz. Inh. Med. Chem. 2003, 18, 333.
15.Mnicione, F., Menabuoni L, Supuran CT, Convey, J. Eds. CRC Press, Boca Raton (FL) , 2004, pp.
243-254.
16.Clare BW, Supuran CT Convey, J. Eds. CRC Press, Boca Raton (FL) , 2004 pp 260-271.
17.S. Lindskog, Pharmacol. Ther., 1997, 74, 1.
18.D. W. Christianson, C. A. Fierke, Acc. Chem. Res., 1996, 29, 331.
19.S. Lindskog, D. N. Silverman, in W. R. Chegwidden, N. D. Carter, Y. H. Edwards (eds.), Carbonic
Anhydrase New Horizons: An Overview of the Distribution and Function of Carbonic Anhydrase in Mammals, Birkhauser Verlag Basel, Switzerland, 2000, pp 175-95.