IC, 2017 – 13(1): 4-24 – Online ISSN: 1697-9818 – Print ISSN: 2014-3214 http://dx.doi.org/10.3926/ic.916
Productivity and value added distribution in
family-owned businesses
Jose Luis Gallizo Larraz , Jordi Moreno Gené , Laura Sanchez Pulido University of Lleida (Spain)
[email protected], [email protected], [email protected]
Received October, 2016 Accepted December, 2016
Abstract
Purpose: Identify similarities and/or differences in the distribution of Value Added characterizing family businesses as opposed to non-family held firms, and analyse productivity by linking the distribution of the wealth generated by the company to a variety of related agents or stakeholders(employees, providers of loan capital, and shareholders).
Design/methodology: A data series consisting of VA distribution in a sample of 8,609 Spanish companies, of which 5,109 are family firms and another 3,500 companies which are not, for the period comprising 2008 to 2013 was employed for this study. The data from the financial statements pertaining to these companies was taken from the SABI system (a privately-funded database analysing the financials of Spanish and Portuguese firms, operated by INFORMA, SA), selecting only those companies that employ standardized financial reporting practices.
the other hand, the lower labour productivity of family businesses is apparent, a result that can be explained both by the lower staff monetary remuneration, as well as the use of production technologies that are also less capital-intensive.
Research limitations/implications: The study included only medium and large companies. These are companies that report financial statements offering more disaggregated data (through use of the standard forms).This owes to the legal requirement of these companies to file a cash flow statement, a necessary source for deriving information on dividends paid by the company.
Originality/value: This is the first study in which the workings of added value are used to analyse the presence of measurable management differences in a large sample of companies using family ownership as the main criteria for differentiation.
Keywords: Family Business, Value Added, Stakeholders, Productivity
Jel Codes: G30, G32, G35
1. Introduction
Since the advent of The Corporate Report (ASSC, 1975), the financial literature has paid attention to some of the advantages of having information on the distribution of value added (VA) in the firm. Analysing VA serves to draw attention to the effort made by a company to create wealth and generate national income, but it is also interesting to analyse how that value is distributed among the economic agents that contributed to its creation.
From the statement on VA distribution, it is possible to verify if a given firm can meet its obligations in terms of salary, tax, interest and dividend payments from the wealth created, or whether the levels of these payments may be increased by creating additional wealth above what the company plans to achieve.
long term (Agrawal & Nagarajan, 1990) and short term (McConaughy, Matthews & Fialko, 2001) is observed. In the same vein, some studies have found that family businesses prefer to be financed by funds from the family itself (Hamilton & Fox, 1998; Romano, Tanewski & Smyrnios, 2000) or by retained earnings (Hamilton & Fox, 1998; Barton & Matthews, 1989), while bank debt or an entry of new shareholders are last among FB preferences.
This choice among funding sources was shown in previous work, such as Gugler and Yurtoglu (2003), Hu, Wang and Zhang (2008), and Gallizo, Moreno and Sánchez (2014), where the tendency towards favouring restrictive dividend policy and retention of profits in favour of greater financial autonomy is confirmed.
This self-financing policy followed by FBs has to do, as noted in Romano et al. (2000), with the interest in maintaining control of the company in the event of being unable to meet debt obligations. This preference for control limits the possibilities of growth for family businesses. Numerous studies regarding the influence of size in company management (Reynolds, 1995; Cromie, Stephenson & Montieth, 1995; Westhead & Cowling, 1998; Duréndez & Garcia, 2005; Galve & Salas, 2011), indicate that it is for this reason that family enterprises tend to be smaller as compared to similar NFBs.
There are other differences between FBs and NFBs that may have an impact on balance sheet structures and results, including qualitative and quantitative factors. Among the more qualitative factors, a lower level of management training in family businesses, a result that could be explained by the observable preference to see family members assume leadership positions, regardless of possessing or not the skill set to do so, which a priori could act to impair firm efficiency (Cromie, Dunn, Sproull & Chalmers, 2001).
Considering the above, we hypothesize that these and other traits of the FB determine Value Added (VA) allocations, as reflected in their value-added statements (VAS), and which materially differ from those reported among NFBs.
The work presented is exploratory, and involves obtaining VA distribution data sets for a sample of family and non-family businesses, then extracting the behavioural differences, as well as an analysis of firm productivity based on these data.
economic agents is assumed to pertain. According to this theory, a relationship of agency arises in private companies in which shareholders delegate responsibility to a third party in order to undertake management functions on behalf of ownership (Jensen & Meckling, 1976). This agency relationship is different in the FB, where family members exert the leadership of the company and have their own interests. If a firm's directors are the family owners, their actions tend to be oriented toward preserving wealth and control of the family firm, whereas if the directors are outside CEOs, they especially tend to set profitability as the main goal.
The paper is organized as follows. The following section discusses some of the characteristics of FBs that influence the distribution of VA. In the third section the relation between Value Added and Labour Productivity is defined. In the fourth section, the sample used is discussed, and the fifth section presents and analyses the results obtained. Finally, section 6 presents a summary of the main conclusions reached.
2. VA distribution and family business
Value Added refers to the increase in the wealth generated and derived from the productive use of company resources prior to its distribution among stakeholders, including; personnel, financial institutions, government, owners and the company itself (Bao & Bao, 1998). Value added can be calculated by adding personnel costs and financial expenses to income before taxes, or by deducting outside acquisitions from net turnover, in which we include all expenses incurred in the purchase of goods and services from other companies (Belkaoui, 1988).
Value added is a measurable outcome which the company must annually decide to distribute. To perform an analysis of income distribution, the Value-Added Statement is the best form to put into a single document and in the same perspective the interests of the various players involved in the activity of the company (Gallizo, Gargallo & Salvador, 2002).
2.1. Receipt by workers/employees
The ratio of compensation to workers and employees is given by the following ratio:
Ratio of VA distributed t o labour=Salary Expense Value−Added
This ratio expresses the amount the company has allocated in the form of Salaries, Wages and Benefits in order to obtain one unit of VA. An improvement in the ratio represents an increase in labour productivity. From the point of view of workers, the ratio shows their share of VA distribution in relation to other beneficiaries, it being possible to frame as a claim by labour, or as an incentive to increase work productivity, there existing a certain parallelism between real growth rates in the revenues generated per unit of wages, and the amount of staff costs in real terms.
The literature shows that the human resource practices employed in family businesses generally take different approaches, as a function of the complexity of the relationships between family and non-family members and with the company (Astrachan & Kolenko, 1994; Reid & Adams, 2001). According to Schulze et al. (2001), this is because the ownership / management / family / company relationships act to create a specific and unique scenario, in which relations are commonly created and mutual expectations grounded on psychological factors other than contractual, based on emotions, feelings and values. This leads to the rewards received by workers often resulting from a greater emphasis on seniority as a criterion for promotion and for setting salary levels (Carrasco-Hernandez & Sanchez-Marin, 2007), and reward systems tend to give more weight to non-monetary factors (Cruz, Gómez-Mejia & Becerra, 2010). From which we may conclude that FBs offer their workers other, non-pecuniary incentives such as trust, fairness, loyalty, or even greater job stability in times of crisis. It is therefore expected that FBs will devote lower VA amounts, as compared to NFBs, to pay their workers.
2.2. Receipt by providers of loan capital
In economic terms, remuneration to loan capital is understood as a factor of production, and as such it falls within income distribution analysis, with acceptance of the fluctuating nature of interest rates, depending on circumstances in financial markets.
Ratio of VA distributed t o outside capital=Interest Expense Value−Added
This ratio explains the debt interest that is required to obtain one unit of total VA. A low result of this ratio will indicate less dependence on banks. The calculation of this ratio can also be used by financial institutions in trend analysis, as an indicator for predicting the expected return on interest, and consequently calculate the risks associated with lending.
As discussed above, the higher risk aversion of FBs is conducive to their being less indebted than NFBs in terms of financial structure. FBs possess less long-term debt, and therefore carry a lower debt burden (McConaughy et al., 2001). Moreover, it is expected that FBs, owing to their smaller size and family involvement in management, will establish closer ties with financial institutions to reduce information asymmetries, and thus gain greater access to funding and better terms. In this regard, recent studies have noted the existence of a lower cost of debt among family businesses (Duréndez, Hernández, Madrid & Ramón, 2012; Gallizo et al., 2014). Therefore, the expectation is that FBs will devote lower proportions of VA to remunerate loan capital.
2.3. Receipt by government
The infrastructure provided by the Government allows for the productive activity of firms, so it is undeniable that government plays a role of great importance as an economic agent. Indeed, the Government provides support in the form of investment in infrastructure, and apart from providing other service infrastructures to create value, the Government, income and other tax administration, undertakes the required investments for the development of the socioeconomic system (McLeay, 1983).
The following ratio shows the portion of returns devoted to Government:
Ratio of VA distributed t o Government= Tax Expense Value−Added
the employer or relatives working in the company, may be some of the other incentives that most benefit family firms.
Studies such as Chen, Chen, Cheng and Shevlin (2010) show that family businesses are fiscally less bold than non-family businesses, mainly because they are more concerned about the impact that such a posture might have on small shareholders, as well as any possible sanctions that may arise and/or the impact on family reputation. However, other studies show that the family businesses perform better tax planning, showing that FBs are interested in pursuing policies that are incentivized fiscally, yet cannot constitute a problem in terms of corporate image (Morris, Willians, Allen & Avila, 1997).
From all this, it follows that family businesses can undertake better tax planning in order to reduce their tax burden; however, this effect could be seen as offset by the fact that, in turn, FBs can be observed to also be less aggressive in pursuing riskier forms of tax reduction. To that effect, Sánchez and Moreno (2014) showed no significant differences between the tax rates paid by FBs and NFBs, which leads us to believe that differences in the distribution of VA in this domain may be materially irrelevant.
2.4. Receipt by shareholders
The ratio of dividends paid out to share capital determines the amount of added value devoted shareholders.
Ratio of VA distributed t o Shareholders= Dividends Value−Added
2.5. To provide for maintenance and expansion of the company
This ratio tracks the internal generation of resources for maintenance and expansion of assets; both in terms of providing for depreciation of fixed assets, and for provisioning reserves to bolster firm equity.
Ratio of VA distributed t o Self−Financing=Depreciation Expense an d Self−Financing Value−Added
FBs exhibit a marked preference for the retention of profits, and for this reason have higher equity on the balance sheet than do NFBs (Anderson & Reeb, 2003). One of the salient characteristics of FBs is the preference for self-financing, as well as the willingness of shareholders to receive a lower return on capital, in exchange for avoiding excessive risk and ensuring the survival of the company for future generations.
Several authors argue that it is the FB preference for control that acts as the main constraint on their growth. This preference acts as a limitation of a financial nature, under the assumption that the company has sufficient resources to finance its growth, and without excessive exposure of personal wealth, a substantial part of which is invested in the firm (Galve & Salas, 2011). Therefore, FBs are expected to allocate a greater proportion of VA to self-financing than do NFBs.
3. Value added and labour productivity
3.1. Theoretical framework
Wage and labour productivity are important economic indicators, and the relationship between them has been analysed in numerous studies in applied economics. In many of these studies, there was an attempt to quantify standards of living by regions or economic sector. From these data, it is possible to identify such standards because the distribution of income between labour and capital depends on this relationship (Tamasauskiene & Stankaityte, 2013).
• Value-Added /Wages
• Value-Added /Number of employees
In both cases, higher ratio values indicate that the company is efficient in the use of labour, while declines in the ratio signal the firm should adopt measures to correct the imbalances observed.
Although the two ratios measure the same concept, there is some consensus around the greater suitability of the former(VA/Wages), as it eliminates the effect inflation can have on the outcome (both variables being in currency units), and because it avoids the problem that occupational seasonality may introduce in the second ratio (the number of workers in a company can vary substantially depending on the time of year and/or the economic sector).
In the literature, labour productivity has been traditionally associated with Wages, with some studies finding a positive relationship between the two variables, especially in the short term (Mankiw, 2011; Huizinga & Broer, 2004; Wakeford, 2004; Narayan & Smith, 2009). Previously, we observed that FBs provide less monetary compensation to their employees compared to NFBs, a factor that could affect their levels of productivity. To verify this idea, we present the data for labour productivity by type of business. Bear in mind that comparisons between companies through these productivity ratios can lead to misinterpretations when not taking into consideration that some industries are more capital-intensive than others, which could lead to assigning greater productivity to workers when, in reality, the higher measure owes to higher capital investments (Morley, 1978). Therefore, to compare the productivity of FBs and NFBs, we will estimate labour productivity by grouping the companies by industry or economic sector (primary, secondary and tertiary).
3.2. Formulating a Hypothesis regarding labour productivity
Finding a linear relationship between labour productivity and wages is a classic problem. There are economists who say that relationship holds whenever a firm is managing its resources with a view toward profit maximization (Mankiw, 2011). In our case, we will verify the existence of such a relationship by distinguishing between family and non-family businesses. The reason is that the various management styles employed in each type of business can lead to differences in productivity.
H1: There is a linear relationship between labour productivity and Wages, in both FBs and NFBs.
Some authors claim that human resource management in FBs responds to the need to preserve socio-emotional wealth (SEW), and that this aspect has a positive impact on organizational performance (Cruz, Firfiray & Gómez-Mejía, 2011), i.e., workers identify with the objectives of the company and become more productive. But it has also been shown otherwise, concluding that FB personnel policies have been guided by the need for creating jobs for relatives, making firm efficiency a secondary criterion (Jorissen, Laveren, Martens & Reheul, 2005). This leads us to formulate the following hypothesis:
H2: FBs are able to leverage their ties with employees, longevity in the workforce and other advantages from workforce stability in order to produce positive differences in productivity compared to NFBs.
Solving this problem is important for shareholders and prospective investors trying to assess the return on investment in a business environment in which the influence of a family in the business is a factor. Achieving higher labour productivity may be concomitant with better economic results, so a broader understanding of this issue would facilitate investor decision-making.
4. Sample Data
4.1. Selection Criteria
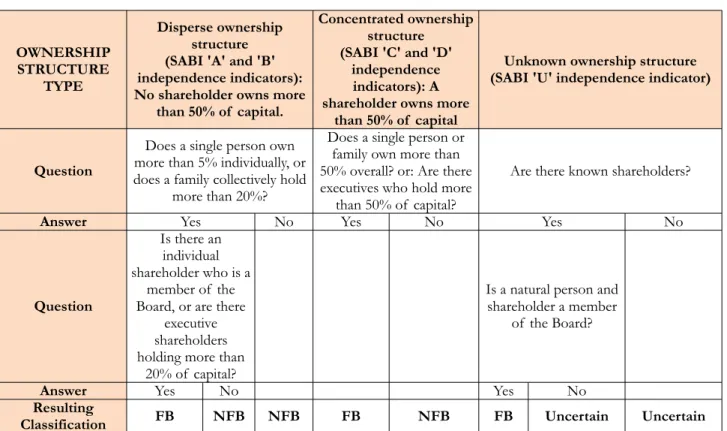
In an empirical study of this nature, in which business data is handled, the first task is to define the concept of "family business" that will be used to identify firms as being family-owned or not.
It is common to think of family businesses as those in which ownership and control are in the hands of a group of people who share family ties; however, it is not an easy task to empirically distinguish between family and non-family businesses.
OWNERSHIP STRUCTURE
TYPE
Disperse ownership structure (SABI 'A' and 'B' independence indicators): No shareholder owns more
than 50% of capital.
Concentrated ownership structure (SABI 'C' and 'D'
independence indicators): A shareholder owns more
than 50% of capital
Unknown ownership structure (SABI 'U' independence indicator)
Question
Does a single person own more than 5% individually, or does a family collectively hold
more than 20%?
Does a single person or family own more than 50% overall? or: Are there executives who hold more
than 50% of capital?
Are there known shareholders?
Answer Yes No Yes No Yes No
Question
Is there an individual shareholder who is a
member of the Board, or are there
executive shareholders holding more than
20% of capital?
Is a natural person and shareholder a member
of the Board?
Answer Yes No Yes No
Resulting
Classification FB NFB NFB FB NFB FB Uncertain Uncertain
Table 1. FB/NFB classification according to SABI-based criteria. Source: Instituto de la Empresa Familiar (2015)
4.2. Data
5. Results of the Analysis
5.1. Descriptive Analysis
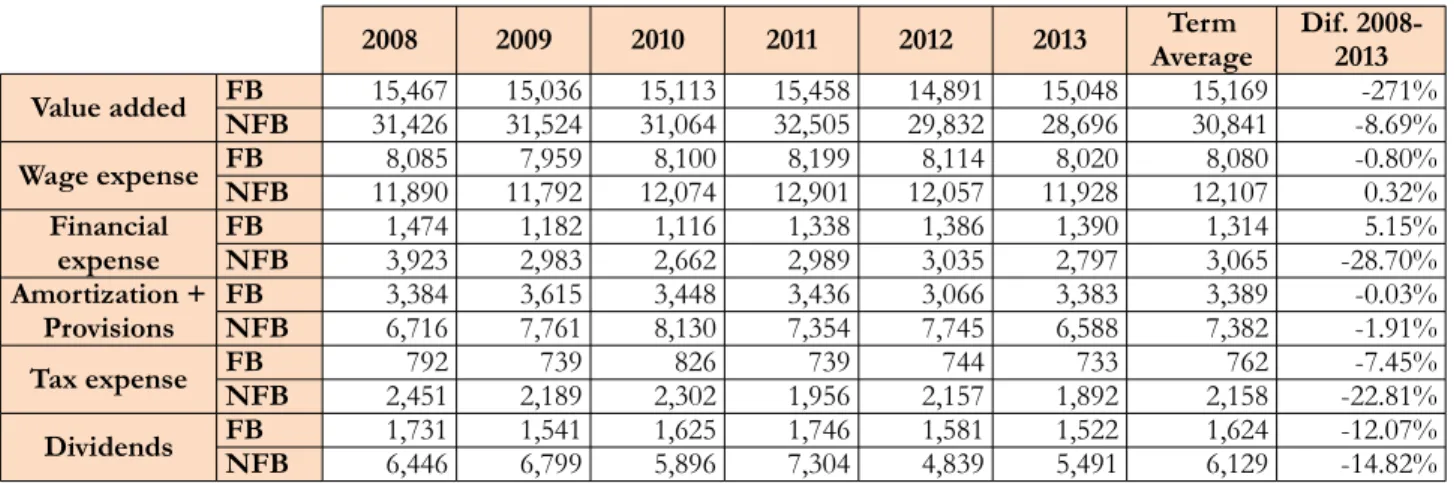
In Table 2, we can observe the evolution of average VA throughout the period with respect to the family/non-family nature of the company, as well as the evolution of each of its components.
2008 2009 2010 2011 2012 2013 AverageTerm Dif. 2008-2013
Value added FBNFB 15,46731,426 15,03631,524 31,06415,113 15,45832,505 14,89129,832 28,69615,048 30,84115,169 -8.69%-271%
Wage expense FBNFB 11,8908,085 11,7927,959 12,0748,100 12,9018,199 12,0578,114 11,9288,020 12,1078,080 -0.80%0.32% Financial
expense FBNFB 1,4743,923 1,1822,983 2,6621,116 1,3382,989 1,3863,035 2,7971,390 3,0651,314 -28.70%5.15%
Amortization +
Provisions FBNFB 3,3846,716 3,6157,761 8,1303,448 3,4367,354 3,0667,745 6,5883,383 7,3823,389 -0.03%-1.91%
Tax expense FBNFB 2,451792 2,189739 2,302826 1,956739 2,157744 1,892733 2,158762 -22.81%-7.45%
Dividends FBNFB 1,7316,446 1,5416,799 5,8961,625 1,7467,304 1,5814,839 5,4911,522 6,1291,624 -12.07%-14.82%
Table 2. Average VA levels and its components.2008-2013. (Thousands of euros)
It was observed that, on average, NFBs generate higher VA, obtaining levels double those of FBs. This result is explained by the financial constraints on the growth of FBs, resulting in smaller firm size, as well as in a lesser emphasis on firm profits in favour of other criteria, such as both management control and business continuity. Previous work also finds an inverse relationship between the existence of family controlling interest and value creation (Camisón, 2001).
On the other hand, the effects that the financial crisis has had on the VA are remarkable, showing a sharp decrease over the period in both FBs and NFBs. The worsening of net profits during the years covered by the sample reduced taxes paid by enterprises, as well as the dividends distributed among owners. At the same time, the difficulties in gaining access to credit and in efforts to reduce debt levels are also reflected in a reduction in financial expenses, especially among NFBs more propense to borrow, while FBs, with a greater preference for self-financing, started from lower levels of debt at the beginning of the period.
2014) has already observed that the nature of family businesses, such as less exposure to financial risk or more qualitative and greater customer loyalty factors, have allowed them to cope with the financial crisis with greater ease.
5.2. VA distribution for the family firms and non-family firms
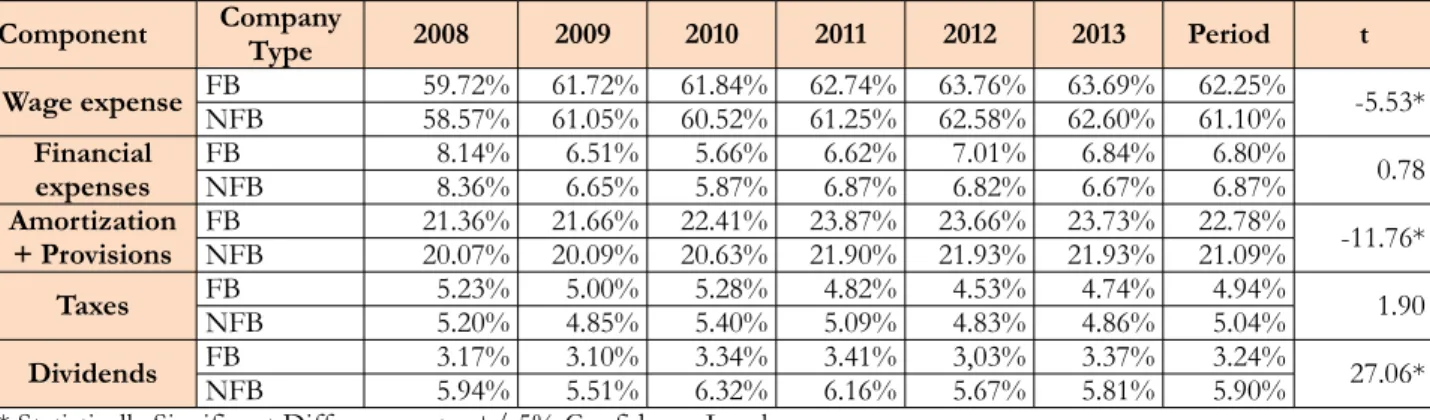
In Table 3, we can see how Value Added was allocated among its various components in both FB and NFB firms over the 2008-2013 period.
Component CompanyType 2008 2009 2010 2011 2012 2013 Period t
Wage expense FBNFB 59.72%58.57% 61.72%61.05% 61.84%60.52% 62.74%61.25% 62.58%63.76% 63.69%62.60% 61.10%62.25% -5.53*
Financial
expenses FBNFB 8.14%8.36% 6.51%6.65% 5.66%5.87% 6.62%6.87% 6.82%7.01% 6.84%6.67% 6.87%6.80% 0.78
Amortization
+ Provisions FBNFB 21.36%20.07% 21.66%20.09% 22.41%20.63% 23.87%21.90% 21.93%23.66% 23.73%21.93% 21.09%22.78% -11.76*
Taxes FBNFB 5.23%5.20% 5.00%4.85% 5.28%5.40% 4.82%5.09% 4.83%4.53% 4.74%4.86% 5.04%4.94% 1.90
Dividends FBNFB 3.17%5.94% 3.10%5.51% 3.34%6.32% 3.41%6.16% 5.67%3,03% 3.37%5.81% 5.90%3.24% 27.06* * Statistically Significant Differences at a +/-5% Confidence Level
Table 3. VA allocation by type of business
We can see that in both types of companies, most of the VA generated goes to personnel costs, between 59 and 64% of VA in FBs, and between 58 and 63% in NFBs. The second, next-greatest element in terms of percentage of VA received is self-financing, with the funds earmarked for reinvestment via depreciation and the provision of reserves measured to be about 23% of VA in FBs, and around 21% in NFBs. The other components receive a much lower proportion of VA (financial expenses between 6% and 8%, about 5% for taxes, and dividends above 3% in FBs, and about 6% in NFBs).
5.2.1. Labour remuneration
In Table 3, we see how FBs allocated a larger share of Value Added to employee compensation for each year of the sample, resulting in statistically significant differences with respect to NFBs. These results contrast with our initial hypothesis that FBs allocate lower relative VA amounts to pay their workers.
This result, however, would not conflict with the idea of lower overall pecuniary remuneration in FBs, offset by other rewards such as trust, loyalty or greater job stability. As proof of this, in Table 4 we can see how the average wages in FBs are lower than in NFBs, also with statistically significant differences.
2008 2009 2010 2011 2012 2013 t
NFB 45.83 46.39 47.47 47.15 48.74 47.81 12.23*
FB 40.73 40.66 43.00 41.70 40.97 41.55
Table 4. Staff costs per worker
In short, while FBs on average pay lower wages, they also are allocating a greater proportion of VA to labour remuneration, indicating that NFBs would be paying out greater relative amounts to other, non-labour stakeholders.
5.2.2. Return on equity: Dividends
5.2.3. Returns to the Company Itself: Self-Financing
The results of the study reinforce the initial impression that FBs allocate a greater proportion of VA to self-financing as compared to NFBs. This is due to risk aversion and the desire to maintain debt levels that do not endanger the continuity of the company for future generations. In this manner, as pointed out in Galve and Salas (2011), FBs are characterized, in general, by a financial constraint that affects their growth, provided the firm generates sufficient resources to finance that growth, while keeping risks under control without excessive exposure to risk of the family estate.
Therefore, the study confirms that FBs allocate a greater proportion of VA for reinvestment in the company as compared to NFBs.
5.3. Labour Productivity
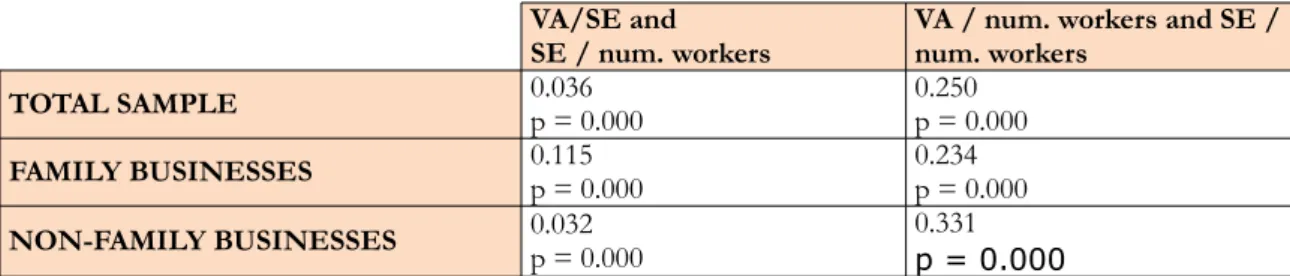
In order to analyse the relationship between labour productivity and wages paid to workers, we analysed the correlation between the two variables in both FBs and NFBs (Table 5).
VA/SE and
SE / num. workers VA / num. workers and SE /num. workers
TOTAL SAMPLE 0.036p = 0.000 0.250p = 0.000
FAMILY BUSINESSES 0.115p = 0.000 0.234p = 0.000
NON-FAMILY BUSINESSES 0.032p = 0.000 0.331p = 0.000
Table 5. Correlation between Labour Productivity and Average Salary Expense (SE)
A weak yet statistically significant relationship indicating that companies that pay higher compensation to their personnel gain greater labour productivity is observed among both FBs and NFBs. This leads us to accept Hypothesis 1, consisting in a posited positive relation between the two.
leverage their ties with employees, longevity in the workforce and other advantages from workforce stability in order to produce positive differences in productivity compared to NFBs."
Sector Company Type 2008 2009 2010 2011 2012 2013 Period
Primary FBNFB 16.782.55 12.702.72 64.222.45 93.352.32 2.658.73 6.442.52 33.702.53
Secondary FBNFB 2.226.03 2.132.80 2.072.70 2.092.76 2.102.80 2.812.12 2.123.32
Tertiary FBNFB 2.894.66 2.794.84 2.705.70 2.804.48 2.624.69 5.572.60 2.744.99
Table 6. Labour Productivity (VA/SE) by Type of Business
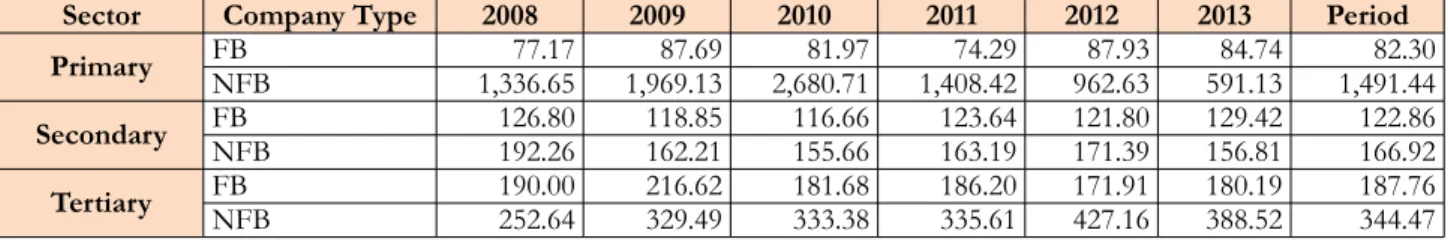
Sector Company Type 2008 2009 2010 2011 2012 2013 Period
Primary FBNFB 1,336.6577.17 1,969.1387.69 2,680.7181.97 1,408.4274.29 962.6387.93 591.1384.74 1,491.4482.30
Secondary FBNFB 126.80192.26 118.85162.21 116.66155.66 123.64163.19 121.80171.39 156.81129.42 122.86166.92
Tertiary FBNFB 190.00252.64 216.62329.49 181.68333.38 186.20335.61 171.91427.16 388.52180.19 187.76344.47
Table 7. Labour Productivity (VA/Num. Employees) by Type of Business
6. Conclusions
This paper presents a comparative analysis of the allocation of added value in FBs and FNBs, in an attempt to quantify if there are differences and/or similarities between the two on the basis of their being or not family businesses.
We have tested how Value Added ratios show the level of efficiency regarding a company’s use of productivity of labour, calculated by the ratio Value Added per number of employees and Value Added per Wages.
Analysing a sample of 8,609 companies, the study results confirm both the higher creation of VA by NFBs, motivated by their larger size and bottom line orientation, as well as the existence of significant differences between FBs and NFBs in the distribution of VA among the various stakeholders who contributed to its creation.
In both types of companies, most of the VA is dedicated to covering staff costs, followed by reinvestment in the company, with allocations to other factors being less. However, FBs do dedicate a greater proportion of VA to reinvestment as compared to NFBs, due to a preference for maintaining control of the company in family hands, limiting risk, and ensuring continuity for future generations. For their part, NFBs distribute a larger share in the form of dividends, due to increased pressure from shareholders for immediate compensation for the capital contributed. We have also observed that FBs assign a higher percentage of VA to the remuneration of their employees, although it is true that they pay on average lower wages in absolute terms when compared to NFBs.
The study has also shown evidence of a deterioration in business results over the period, as is clear from the significant drop in the wealth generated. This decline was particularly notable in the case of NFBs, in which taxes paid and dividends distributed were drastically reduced. Family-owned businesses also experienced this setback, although by virtue of their lower debt financing, they managed to soften the negative impact on profits.
We have worked with labor productivity, but in later work, it would be interesting to see if the investments of family businesses are less sensitive to economic crises than those of non-family firms. Additionally, it will be interesting to study the share of added value when introducing the influence of the CEO when he is not a member of the control family. This will be a line of future research.
References
Agrawal, A., & Nagarajan, N.J. (1990). Corporate capital structure, agency costs, and ownership control: The case of all-equity firms. The Journal of Finance, 4, 1325-1331.
https://doi.org/10.1111/j.1540-6261.1990.tb02441.x
Anderson, R., & Reeb, D.V. (2003). Founding family ownership and the agency cost of debt. Journal of Financial Economics, 68(2), 263-285. https://doi.org/10.1016/S0304-405X(03)00067-9
ASSC (1975). The Corporate Report. London. Accounting Standards Steering Committee.
Astrachan, J., & Kolenko, T. (1994). A neglected factor explaining family business success: Human resource practices. Family Business Review, 7, 251-262. https://doi.org/10.1111/j.1741-6248.1994.00251.x
Bao, B., & Bao, D.H. (1998). Usefulness of value added and abnormal economic earnings: An empirical examination. Journal of Business Finance & Accounting, 25(1), 251-264.
https://doi.org/10.1111/1468-5957.00186
Barton, S.L., & Matthews, C.H. (1989). Small firm financing: Implications from a strategic management perspective. Journal of Small Business Management, 27(1), 1-7.
Belkaoui, A. (1988). Value-Added Reporting. The New Environment in International Accounting. Issues and practices (Quorum), 1-13.
Camisón, C. (2001). Estructura de propiedad-control de la empresa familiar y desempeño organizativo: Un análisis dentro de la población de empresa industriales valencianas. I Congreso Nacional de Investigación sobre la Empresa Familiar. OPVI. Valencia.
Carrasco-Herández, A.J., & Sánchez-Marín, G. (2007). The determinants of employee compensations in family firms: empirical evidence. Family Business Review, 20, 215-228. https://doi.org/10.1111/j.1741-6248.2007.00096.x
Cromie, S., Dunn, B., Sproull, A., & Chalmers, D. (2001). Small firms with a family focus in the Scottish Highlands and Islands. The Irish Journal of Management, 22(2), 45-66.
Cromie, S., Stephenson, B., & Montieth, D. (1995). The management of family firms: An empirical investigation. International Small Business Journal, 13, 11-34. https://doi.org/10.1177/0266242695134001
Cruz, C., Firfiray, S., & Gómez-Mejía, L.R. (2011). Socioemotional wealth and human resource management (HRM) in family-controlled firms. In A. Joshi, H. Liao & J.J. Martocchio (Eds.), Research in Personnel and Human Resources Management (30, 159-217). Bingley: Emerald Group Publishing.
Cruz, C., Gómez-Mejia, L.R., & Becerra, M. (2010). Perceptions of benevolence and the design of agency contracts: CEO-TMT relationships in family firms. Academy of Management Journal, 53, 69-89.
https://doi.org/10.5465/AMJ.2010.48036975
Duréndez, G., & García, D. (2005). Diferències econòmico-financeres entre les empreses familiars i les no familiars. Revista de Comptabilitat i Direcció, 2, 243-267.
Duréndez, A., Hernández, G., Madrid, A., & Ramón, M.C. (2012). Relaciones bancarias y coste de la deuda en la pequeña y mediana empresa familiar. El Éxito de la empresa familiar. (Cap. 4, pp 121-150). Madrid: Civitas-Thomson Reuters.
Gallizo, J.L., Gargallo, P., & Salvador, M. (2002). Sharing Wealth: Evidence from Financial Ratios in Spain. Journal of International Financial Management and Accounting, 13(3), 214-234.
https://doi.org/10.1111/1467-646X.00085
Gallizo, J.L., Moreno, J., & Sánchez, L. (2014). Which companies have better weathered the crisis, family firms or non family firms?. Intangible Capital, 10(4), 766-797. https://doi.org/10.3926/ic.544
Galve, C., & Salas, V. (2011). Family ownership and firm performance: the net effect of productive efficiency and growth constraints. Innovar, 21(40), 155-170.
Gugler, K., & Yurtoglu, B.B. (2003). Corporate governance and dividend payout policy in Germany. European Economic Review, 47, 731-758. https://doi.org/10.1016/S0014-2921(02)00291-X
Hamilton, R.T., & Fox, M.A. (1998). The financing preferences of smalls firm owners. International Journal of the Economics of Business, 6(1), 41-55. https://doi.org/10.1108/13552559810235529
Huizinga, F., & Broer, P. (2004). Wage moderation and labour productivity. Netherlands Bureau for Economic Policy Analysis, series CPB Discussion Papers, 28, 28:34.
Instituto De La Empresa Familiar (2015). La Empresa Familiar en España. Ed. Instituto de la Empresa Familiar.
Jensen, M.C., & Meckling, W.H. (1976). Theory of the Firm: Managerial Behaviour, Agency Cost and Ownership Structure. Journal of Financial Economics, 3, 305-360.
https://doi.org/10.1016/0304-405X(76)90026-X
Jorissen, A., Laveren, E., Martens, R., & Reheul, A. (2005). Real versus simple-based differences in comparative family business research. Family Business Review, 18(3), 229-246.
https://doi.org/10.1111/j.1741-6248.2005.00044.x
Mankiw, N.G. (2011) Principles of Economics (5th Edition). Mason: South-Western Cengage Learning.
Mcconaughy, D.L., Matthews, C.H., & Fialko, A.S. (2001). Founding family controlled firms: Performance, risk, and value. Journal of Small Business Management, 39(1), 31-49.
https://doi.org/10.1111/0447-2778.00004
Mcleay, S. (1983) Value Added a comparative study. Accounting, Organizations and Society, 8(1), 31-56.
https://doi.org/10.1016/0361-3682(83)90013-2
Morley, F.M. (1978). The value added statement: A review of its use in corporate reports. The institute of Chartered Accountants of Scotland. London: Gee and Co.
Morris, M., Willians, R., Allen, J., & Avila, R. (1997). Correlates of success in family business transitions. Journal of Business Venturing, 12, 385-401. https://doi.org/10.1016/S0883-9026(97)00010-4
Narayan, P.K., & Smyth, R. (2009). The effect of inflation and real wages on productivity: New evidence from a panel of G7 countries. Applied Economics, 41, 1285-1291.
https://doi.org/10.1080/00036840701537810
Reid, R.S., & Adams, J.S. (2001). Human resource management – a survey of practices within family and non-family firms. Journal of European Industrial Training, 25(6), 310-320.
https://doi.org/10.1108/03090590110401782
Romano, C.A., Tanewski, G.A., & Smyrnios, K.X. (2000). Capital structure decision making: A model for family business. Journal of Business Venturing, 16, 285-310.
https://doi.org/10.1016/S0883-9026(99)00053-1
Sánchez, L., & Moreno, J. (2014). Quin impost de societats paguen les empreses familiars catalanes? Anàlisi del tipus impositiu meritat i del tipus impositiu efectiu. Intangible Capital, 12(1), 295-318.
Tamasauskiene, Z., & Stankaityte, A. (2013). Evaluating of the Relationship between Wages and Labour Productivity in Lithuania. Socialiniai tyrimai/Social Research, 1(30), 24-35.
Wakeford, J. (2004). The productivity-wages relationship in South Africa: An empirical investigation. Development South Africa, 21, 109-132. https://doi.org/10.1080/0376835042000181444
Westhead, P., & Cowling, M. (1998). Performance contrasts between family and non-family unquoted companies in the UK. International Journal of Entrepreneurial Behavior & Research, 3(1), 30-52.
https://doi.org/10.1108/13552559710170892
Intangible Capital, 2017 (www.intangiblecapital.org)
Article's contents are provided on an Attribution-Non Commercial 3.0 Creative commons license. Readers are allowed to copy, distribute and communicate article's contents, provided the author's and Intangible Capital's names are included. It must not be used for