Niraj Agarwal et al JMSCR Volume 06 Issue 09 September 2018 Page 654 Original Research Article
A Study for Evaluation of Serum Vitamin D Levels in Patients with type 2
Diabetes Mellitus with or without Complications
Authors
Niraj Agarwal
1,
Dhiraj Kapoor
2, Pankaj Kumar
3*, R.S. Yadav
4Guriqbal Singh
5, Abhimanyu Patial
6,
Bhagwan Dass
7, Sayan Malakar
81,5,6,7,8
PG student, Department of Medicine Dr. RPGMC Kangra
2
Professor and Head, Department of Medicine Dr. RPGMC Kangra
3
Associate Professor Department of Medicine and corresponding author SLBSGMC Mandi
4
Professor and Head, Department of Biochemistry, Dr. RPGMC Kangra
*
Corresponding Author
Dr Pankaj Kumar
Associate Professor, Department of Medicine, SLBSGMC Mandi H.P, India Email: pakugu2003@yahoo.co.in, Phone 919418472207
Abstract
Introduction: One of the important emerging nutritional risk factors recognized for the development of insulin resistance (IR) and T2DM is deficiency of vitamin D. There has been increasing evidence suggesting that vitamin D may play an important role in modifying risk of diabetes. Vitamin D replenishment improves glycaemia and insulin secretion in patients with type 2 Diabetes Mellitus with established hypovitaminosis D, thereby suggesting a role for vitamin D in pathogenesis of diabetes mellitus.
This study determines if there is any association between vit. D deficiency and T2DM
The scarcity of available data and the diversity of climate, culture and dietary habits prevalent in HP prompted us to undertake this study in a sub himalayan region.
Aim and Objective of the Study: To evaluate serum Vitamin D levels in patients with T2DM with or without complications.
Materials and Methods: It was a Cross Sectional study .Study was conducted at Dr. RPGMC Kangra and was conducted over a period of 1 years.
Results: Vitamin D level in patients without microvascular complications was 25.63±13.52 and in patients with microvascular complications the mean vitamin D level was 15.71±9.42. This difference was statistically significant (p≤0.05). Out of the 60 patients with microvascular complications, 40 patients (66.7%) were deficient in vit D, 15 patients (25%) were insufficient in vit D and only 5 patients (8.3%) had sufficient level of vit D. In patients without microvascular complications(total 40), 37.5% were deficient in vit D, 30% were insufficient in vit D and 32.5% had sufficient level of vitamin D
Summary and Conclusion: Patients with type 2 diabetes mellitus had mean vit D level of 19.68±12.20ng/ml which is in the deficient range. Mean vit D levels are significantly lower in patients with microvascular complications (15.71±9.42) than without complications (25.63±13.52).(p<0.05).The prevalence of vit D deficiency in patients with microvascular complications was more than in patients without microvascular complications(66.7% vs 37.5%).Vitamin D levels in patients with poorly controlled diabetes (18.23±12.34) were lower than patients with well controlled diabetes(23.07±11.35) but the difference was not significant. Vit D level decreased with increase in duration of diabetes Keywords:T2DM:Type 2 Diabetes Mellitus, DPN:Diabetic peripheral neuropathy, Vit D:Vitamin D, VDR: Vitamin D receptor, GFR: Glomerular Filtration Rate.
www.jmscr.igmpublication.org Impact Factor (SJIF): 6.379
Niraj Agarwal et al JMSCR Volume 06 Issue 09 September 2018 Page 655 Introduction
Type 2 Diabetes Mellitus (T2DM) is the most prevalent chronic metabolic disorder worldwide. India leads the world with largest number of diabetic subjects earning the dubious distinction of being as “Diabetic Capital of World”.
Vitamin D deficiency prevails in epidemic proportions all over the Indian subcontinent, with a prevalence of 70%–100% in the general population. Vitamin D deficiency is likely to play an important role in the very high prevalence of rickets, osteoporosis, cardiovascular diseases, diabetes, cancer and infections such as tuberculosis in India.
One of the important emerging nutritional risk factors recognized for the development of insulin resistance (IR) and T2DM is deficiency of vitamin D. There has been increasing evidence suggesting that vitamin D may play an important role in modifying risk of diabetes. In this regard, vitamin D has both direct and indirect effects, the latter via regulation of calcium effects on various mechanisms related to the pathophysiology of type 2 diabetes, including pancreatic beta cell dysfunction, impaired insulin action and systemic inflammation. Large epidemiological studies suggest a link between both the conditions. It has been proposed to be associated with worsening of glycemic control and progression of complications among T2DM individuals1
Type 2 diabetes mellitus has consistently been shown to be prevalent in individuals with vitamin D deficiency. Obesity is a well recognized feature of T2DM.It has been showed that Vitamin D is deposited in body fat stores after which it is no longer bioavailable. This may explain why a significant amount of obese individuals have vitamin D deficiency resulting in depletion of calcitriol and rise in PTH. This in turns increases intracellular calcium in adipocytes stimulating lipogenesis with subsequent weight gain and impaired glucose intolerance2 . In a study, body mass index was found to be a strong determinant for 25–hydroxyvitamin D3 concentration, with concentrations being suboptimal in most obese
participants. Obesity is the most important known determinant of type 2 diabetes and related disturbances in glucose metabolism3
Vitamin D replenishment improves glycaemia and insulin secretion in patients with type 2 Diabetes Mellitus with established hypovitaminosis D, thereby suggesting a role for vitamin D in pathogenesis of diabetes mellitus. The potential effect of vitamin D supplementation appears to be more prominent among persons who are at high risk for diabetes (e.g., pre-diabetes). In a post-hoc subgroup analysis conducted using data from a completed trial designed for fractures, combined vitamin D3 (700 IU/day) and calcium carbonate (500 mg/day) supplementation prevented the rise in insulin resistance and fasting plasma glucose in people with impaired fasting glucose, but not in individuals with normal fasting glucose at baseline, suggesting that vitamin D may benefit only individuals at high risk for diabetes.
This study focuses on determining if there is any association between vitamin D deficiency and type 2 diabetes mellitus.
Himachal Pradesh is situated in the northern part of India and is mainly a hilly state. Dr. Rajendra Prasad Government Medical College & Hospital in district Kangra is the only major referral hospital in this part of the state catering to approximately 60% of the population of the state mainly of rural background. Most of the available literature on diabetes and its association with vitamin D is from studies based on urban population and studies in developed countries. The scarcity of available data and the diversity of climate, culture and dietary habits prevalent in Himachal Pradesh prompted us to undertake this study in a sub himalayan region.
Aim and Objective of the Study
Niraj Agarwal et al JMSCR Volume 06 Issue 09 September 2018 Page 656 Materials and Methods
Study Design: It was a Cross Sectional study .Study was conducted at Dr. Rajendra Prasad Government Medical College & Hospital Kangra at Tanda.
The study was conducted over a period of 1 years from JUNE 2016 to MAY 2017.Patients of T2DM >18 years ,including freshly diagnosed patients of diabetes mellitus, who attended the diabetic OPD of the institution were enrolled for the study after taking their detailed history. Diabetic Peripheral Neuropathy was diagnosed based on Revised Neuropathy Disability Score. Patients with NDS Score of ≥ 6/10 were taken as neuropathy
Diabetic Retinopathy was diagnosed by an ophthalmologists and is characterized by microaneurysms, dot and blot haemorrhages and exudates. Diabetic Nephropathy was diagnosed by urine albumin to creatinine ratio in a spot urine sample. Values > 30ug/mg creatinine was taken as nephropathy. It was further divided into microalbuminuria (30-300ug/mg creatinine) and macroalbuminuria (>300ug/mg creatinine).
Patients attending diabetic OPD of DR.RPGMC TANDA who were either cases of T2DM already on treatment or new patients were included in study. Patients<18 years and with CKD stages 3-5 and patients on calcium and vitamin D supplements were excluded
Method
A detail history of the patients attending diabetic OPD were taken regarding their age, occupation, duration of diabetes, treatment history, comorbid condition and diabetes related complications. Patients were sent to ophthalmologists for fundus examination. After recording the weight, height and BMI, all enrolled patients were subjected to following laboratory investigations: CBC, LFT, RFT, BGF, electrolytes. Vitamin D levels, HbA1c Level, Lipid profile, Urine analysis including microalbuminuria and urine for ACR, ECG
Vitamin D was analysed using the ELISA technique based on the principal of competitive
binding. The sensitivity of the test kit was 0.67ng/ml.
250 consecutive patients were enrolled initially after the history and physical examination. RFT were done of all the patients and GFR was calculated. 150 patients were excluded because their GFR was less than 60. Finally only 100 patients were included in the study. The patients finally selected underwent the remaining investigations and were evaluated for their diabetes related microvascular and macrovascular complications.
Statistics
Data collected were tabulated and analyzed using standard statistical methods.
Observations and Results
Between june 2016 and may 2017, 100 patients with T2DM were included in the study. Out of the total 100 patients, 56 were female (56%) and 44(44%) were male. The mean age of the patients included in the study was 53.08±7.98 years. The mean age of the males were 52.09±8.65 years and the mean age of the females were 53.86±7.41 years. The mean BMI of the patients were 23.52±2.08 which falls in the overweight category. 8.37±1.71 was the mean HbA1c of the patients. 52% of the patients were hypertensive.30 patients were known diabetic for 5 or less years. 26 patients were diabetics for 5 to 10 years and only 2% patients had diabetes for more than 20 years. Maximum patients (45%) were in the normal range followed by overweight (32%) and obese (22%) and only 1% of the studied population was underweight according to Indian classification for BMI.
Niraj Agarwal et al JMSCR Volume 06 Issue 09 September 2018 Page 567 Table- 1: Vitamin D classification with prevalence
Vitamin D classification Number of patients Percentage
Deficient ≤ 20 ng/ml 55 55
Insufficient 20-30 ng/ml 27 27
Sufficient 30-100 ng/ml 18 18
Excess >100 ng/ml 0 0
Table – 2 Microvascular complications with vitamin D
Microvascular complications
Present (60 patients)
Absent (40 patients)
p value
Vit D mean level 15.71±9.42 25.63±13.52 <0.05
Vit D classification:
Deficient Insufficient Sufficient
no % No %
0.126 0.143 0.793 40
15 5
66.7% 25% 8.3%
15 12 13
37.5% 30% 32.5%
Microvascular complications were present in 60 patients (60%) and 40 patients (40%) did not have any microvascular complications. (Table 2)
Vitamin D level in patients without microvascular complications was 25.63±13.52 and in patients with microvascular complications the mean vitamin D level was 15.71±9.42. This difference was statistically significant (p≤0.05).
Out of the 60 patients with microvascular complications, 40 patients (66.7%) were deficient in vit D, 15 patients (25%) were insufficient in vit D and only 5 patients (8.3%) had sufficient level of vit D. In patients without microvascular complications (total 40), 37.5% were deficient in vit D, 30% were insufficient in vit D and 32.5% had sufficient level of vitamin D (Table 2).Though the difference in vit D level between the two group was significant but when when individual category of vit D classification (deficient/insufficient/sufficient), it did not differ significantly between the two groups.
The mean age of the patients in complication group was 56.32 ±7.43 years and without complications, the mean age was 48.23±6.17 years and this difference in age was significant (P=0.000)
BMI of the patients with microvascular complications was higher than the patients without microvascular complications (24.04 vs 22.76 respectively).41.7% of the patients (25 patients) with microvascular complications had
normal BMI, 30% (18 patients) were overweight and 28.3% (17 patients) were obese. Of the patients without microvascular complications 12.5% were obese, 50% had normal BMI and 35% were overweight.
It was also seen that 77.3% of the obese patients had microvascular complications, 56.3% of the overweight patients had microvascular complications and 55.6% patients with normal BMI had complications. The HbA1c level between the two groups (complication vs without complication) was 8.603 and 8.025 and this was not significant (p≥0.05).
Total of 52 patients were hypertensive. Out of the 60 patients with microvascular complications, 41 patients (68.3%) were hypertensive. Among the 52 patients with hypertension, 41 patients had microvascular complications. Vitamin D level in patients with associated hypertension was 17.81±12.82 and in patients without hypertension was 21.71±11.27.(p≥0.05).
Niraj Agarwal et al JMSCR Volume 06 Issue 09 September 2018 Page 658 Only 3.3% of the patients with microvascular
complications had diabetes for more than 20 years, and 23.3% patients with complications were diabetics for 15 to 20 years. In contrast, the patients without microvascular complications none of them had diabetes for more than 15 years. 11.7% of the patients with microvascular complications had diabetes for less than 5 years and 57.5% of the patients without microvascular complications were diabetic for less than 5 years and this difference was significant(p≤0.05).
Prevalence of microvascular complications with duration of diabetes for 15 to 20 years (23.3%)
was statistically significant (p≤0.05) as none of the patients without microvascular complications had diabetes for more than 15 years.
With increase in duration of diabetes the frequency of microvascular complications increased. 100 % of the patients with diabetes for more than 15 years had microvascular complications in one or the other form and only 23.3% of the patients with duration of diabetes for less than or equal to 5 years had microvascular complications and 76.7% did not have complications. This was significant (p≤0.(table 3)
Table –3: Vitamin D level
VITAMIN D LEVEL
No of patients Mean value(ng/ml) p value Sex: male
Female
44 56
22.88±13.12 17.16±10.90
0.019
Microvascular complication: Present
Absent
60 40
15.71±9.42 25.63±13.52
0.000
Diabetic peripheral neuropathy: Present
Absent
50 50
16.56±9.55
22.80±13.77 0.010
Diabetic retinopathy: Present
Absent
31 69
11.14±6.92 23.52±12.14
0.000
Mild NPDR Moderate NPDR Severe NPDR
15 15 1
11.50±7.09 10.86±7.21
9.89 Diabetic nephropathy:
Present Absent
36 64
13.64±8.75 23.08±12.60
0.000
Microalbuminuria Macroalbuminuria
26 10
15.05±9.54 9.98±4.95 Hypertension:
Present Absent
52 48
17.81±12.82 21.71±11.27
0.111
No of patients Mean value(ng/ml) BMI :
Normal Overweight Obese
45 32 22
22.34±13.83 20.12±11.59 13.57±6.92 Diabetes duration:
≤5 >5 - ≤10 >10 - ≤15 >1 5- ≤20 >20
30 26 28 14 2
Niraj Agarwal et al JMSCR Volume 06 Issue 09 September 2018 Page 659 In males the mean vitamin D level was
22.88±13.12ng/ml and in females the mean vitamin D level was 17.16ng/ml ±10.90. (Fig 16). The difference in the vit. D level between the two sexes was statistically significant (p≤0.05)
Vit D level in patients with microvascular complications was 15.71±9.42 whereas it was 25.63±13.52 in patients without complications and this difference was significant (p≤0.05)
DPN was present in 50 patients (50%).Vitamin D level in patients with diabetic peripheral neuropathy (DPN) with or without other complications was 16.56±9.55 and in patients without neuropathy it was 22.80±13.77.This difference was significant (p≤0.05).
Diabetic retinopathy was present in 31 patients (31%). 15 patients had mild NPDR, 15 patients had moderate NPDR and severe NPDR was present in only 1 patient. Vitamin D level in patients with diabetic retinopathy with or without other complications was 11.14 ± 6.92 and it was significantly lower than patients without retinopathy where it was 23.52±12.14 (p≤0.05). Vitamin D level in patients with mild NPDR was11.50±7.09, in moderate NPDR was 10.86 ±7.21 and in severe NPDR the mean vitamin D level was 9.89.
Diabetic nephropathy was present in 36(36%)% patients (Fig 22) Significant difference(P=0.000) was present in Vitamin D level in patients with diabetic nephropathy with or without other complications and in patients without nephropathy (13.64±8.75 vs 23.08±12.60 respectively). Vitamin D level in patients with microalbuminuria was 15.05±9.54 and in patients with macroalbuminuria the mean vitamin D level was 9.98±4.95ng/ml.
Vitamin D level decreased as the BMI increased. It was 22.34±13.83 in normal BMI, 20.12±11.59 in overweight and 13.57±6.92 in the obese category.
Vitamin D level decreased with duration of diabetes. It was 5.92±0.67 in patients with more than 20 years of diabetes. In patients with 16 to 20 years of diabetes vitamin D was 11.57±6.45
whereas in patients with 11 to 15 years of diabetes the mean vitamin D level was 14.69±9.45. In patients with diabetes for 5 to 10 years mean vitamin D level was 20.26 ±10.95 and in patients with less than 5 years of diabetes the vitamin D level was 28.54±12.35.The difference in vit D level between group less than 5 years and more than 5 years was significant (p≤0.05). It was not significant among group more than 5 years.
Among patients with microvascular complications 83.3% had DPN with or without complications, 51.7% had retinopathy with or without complications, and nephropathy was present in 60% with or without complications.
17% had isolated neuropathy, 2 % had isolated nephropathy and 3% had isolated had isolated had isolated retinopathy.10% had both neuropathy and nephropathy, 3% had both neuropathy and retinopathy and 5% had both nephropathy and retinopathy. Triopathy was present in 20% patients (table 4)
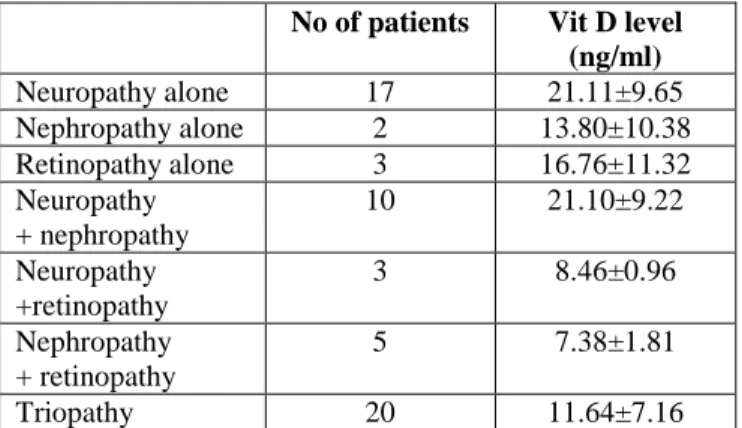
Table – 4: Vitamin D levels in microvascular complications
No of patients Vit D level (ng/ml)
Neuropathy alone 17 21.11±9.65
Nephropathy alone 2 13.80±10.38
Retinopathy alone 3 16.76±11.32
Neuropathy + nephropathy
10 21.10±9.22
Neuropathy +retinopathy
3 8.46±0.96
Nephropathy + retinopathy
5 7.38±1.81
Triopathy 20 11.64±7.16
VITAMIN D level in patients with triopathy was 11.64±7.16 and in patients with neuropathy and nephropathy combined was 21.10±9.22. in patients with neuropathy and retinopathy the mean vitamin D level was 8.46±0.96. in patients with nephropathy and retinopathy the mean vitamin D level was 7.38±1.81.vitamin D level in patients with isolated neuropathy was 21.11±9.65, in isolated nephropathy was 13.80±0.38 and in isolated retinopathy was 16.76±11.32
Niraj Agarwal et al JMSCR Volume 06 Issue 09 September 2018 Page 660 insufficient and sufficient level of vit D was
present in 10%(5 patients) (Table 5).
Among patients with nephropathy, vit D was deficient in 75% (27patients), insufficient in 19.4% (7patients) and sufficient in 5.6% (2 patients) (Table 5).
Among the patients who were having retinopathy, Vit D was deficient in 83.9% patients (26 in no), insufficient in 16.1% patients (5 in no) and none of the patients with retinopathy had sufficient levels of vit D (Table 5).
Table – 5: Prevalence of Vitamin D status with microvascular complications
43.2% of males (19) as compared to 64.3%o f females (36) were deficient in vit D, 31.8%0f males (14) and 23.2% of females (13) were insufficient in vit D and sufficient level of vit D was present in 25% males (11) and 12.5% of females (7)
Well controlled diabetes was present in 30 patients and 70 patients were poorly controlled. Vit D was lower in poorly controlled group (18.23±12.34) as compared to the well controlled group (23.07±11.35) but it was not significant (P=0.069) .
Vit D levels were found to be inversely associated with HbA1c levels in the diabetic patients (p = 0.020, r2 = 0.054, linear regression).
Discussion
The mean level of vitamin d in this study was 19.68ng/ml. This level was similar to the study conducted by Bayani et al where the mean concentration of vit D in diabetic patients was 18.7±10.2 ng/dl.4 In a study by Bajaj et al in India, the mean vitamin D level was 19.046 ± 6.614 ng/ml in diabetics which was almost similar to our study 5. Scragget al. and Suzukiet al. in their
observational study in type 2 diabetes mellitus (T2DM) subjects concluded that mean vitamin D level concentration in men were significantly higher than women.6,7 In our study the mean vit d level in males was 22.88 ng/ml and in females it was 17.16ng/ml and this difference in vit D level was statistically significant(p<0.05).
.Various studies have found an inverse relation between vitamin D levels and diabetes prevalence. Liu et al. reported that individuals in the highest tertile of vitamin D levels have a 40% lower incidence of T2DM. A meta-analysis with 3,612 diabetes cases (mean age 61.6 years) demonstrated an inverse association between circulating 25 (OH) D and incident type 2 diabetes8
In our study, it was found that individuals with T2DM with microvascular complications were having lower vitamin D than those without complications. The mean vitamin D was 15.71 ng/ml in diabetics with microvascular complications while it was 25.63 ng/ml in patients without microvascular complications. Difference in vit D level between the two groups was significant (p≤0.05). Overall prevalence of
Deficient ≤20 Insufficient 20-30 Sufficient >30
No % no % No %
Neuropathy: Present Absent
32 23
64 46
13 14
26 28
5 13
10 26 Nephropaty:
Present Absent
27 28
75 43.8
7 20
19.4 31.3
2 16
5.6 25 Retinopathy:
Present Absent
26 29
83.9 42
5 22
16.1 31.9
0 18
0 26.1 Sex:
Male Female
19 36
43.2 64.3
14 13
31.8 23.2
11 7
Niraj Agarwal et al JMSCR Volume 06 Issue 09 September 2018 Page 661 inadequacy of vitamin D (vitamin D deficiency
and insufficiency, or in other words levels <30 ng/ml) was significantly higher (91.70%) in complication than in non complications (67.50%). Hence, this suggests that hypovitaminosis D is more prevalent in diabetics with complications than without complications.
There was a significant difference in the vitamin D levels in patients with DPN with or without other microvascular complications than with patients without DPN (p<0.05). Chaychi et al. in his study found that patients with diabetic polyneuropathy had a lower mean serum vitamin D level9. Soderstorm et al. demonstrated vitamin D insufficiency is associated with the adjusted composite measure of neuropathy. The mean level of vit D in isolated neuropathy in his study was 22.2 ng/ml which is similar to our isolated neuropathy level (21.11ng/ml)10
A meta-analysis by G.-B. Qu et al. indicates that vitamin D deficiency is associated with the generation and development of DPN in Caucasian with T2DM, and in Asian, diabetic patients with vitamin D deficiency are 1.22 times to suffer from DPN compared with normal vitamin D level11. Vitamin D deficiency is common in diabetic patients, and low concentrations are associated with the presence and the severity of sensory neuropathy in diabetes. Some retrospective studies have indicated vitamin D deficiency is an independent risk factor for DPN12.
Low vitamin D status is characteristically associated with advanced diabetic nephropathy13. The potential mechanisms of renal protection by vitamin D3 include inhibition of RAAS and protection of the kidney from inflammation, fibrosis, and structural changes and therefore glomerulosclerosis. Vitamin D can ameliorate proteinuria and protect the kidney from injury in patients with diabetic nephropathy.
Vitamin D level in patients with mild NPDR was 11.50+7.09, in moderate NPDR it was 10.86+7.21 whereas in severe NPDR it was 9.89 and the prevalence of diabetic retinopathy was 31%.The evidence from a meta-analysis conducted by Luo
et al. indicates an association between vitamin D deficiency and an increased risk of diabetic retinopathy in type 2 diabetes patients. Aksoy et al. also showed that the mean vitamin D3 concentrations fell with increasing severity of diabetic retinopathy14 .25(OH)D level < 21 ng/mL was associated with increased risk of hypertension, diabetes, obesity and high triglyceride levels—all associated with increased
cardiovascular mortality15.
Our study showed that vit D level decreased with increase in duration of diabetes but the difference in the level was significant(p<0.05) only when it was compared in the group with duration of diabetes less than 5 years and more than 5 years. Vit D level in patients with duration of diabetes for more than 5 years did not vary significantly. Only two studies regarding association of vit D and duration of diabetes was found and they did not show any significant association between vit D and duration of diabetes. It was also seen that with increase in the duration of diabetes increased, prevalence of microvascular complications increased.
Our study showed a deficiency of vit D in diabetics which was correlating with duration of diabetes and other studies quoted. So it is prudent for the physician/internist to monitor vit D level more so in patients with long history of diabetes and patients having microvascular complications because they have got direct relation with vit D levels.
Summary and Conclusion
Niraj Agarwal et al JMSCR Volume 06 Issue 09 September 2018 Page 662 DPN (16.56±9.55 vs 22.80±13.77, p<0.05), with
and without DN (13.64±8.75 vs 23.08±12.60, p<0.05),and in patients with and without DR(11.14±6.92 vs 23.52±12.14,p< 0.05). Vitamin D levels in patients with poorly controlled diabetes (18.23±12.34) were lower than patients with well controlled diabetes (23.07±11.35) but the difference was not significant. Vit D level decreased with increase in duration of diabetes. It was 28.54±12.35 in patients with duration of diabetes for 5 years, 20.26±10.95 for 6 to 10 years, 11.57±6.45 for 16 to 20 years and 5.92±0.67ng/ml in patients with diabetes for more than 20 years.
Considering the high prevalence of vitamin D deficiency and the burden of the diabetes and its complications, screening type 2 diabetes patients who are at risk of vitamin D deficiency should be considered.
Financial Disclosure
No cost was charged from the patient or his/her attendants for any investigations done under this study.
Bibliography
1. Pittas AG, Dawson-Hughes B. Vitamin D and Diabetes. J Steroid Biochem Mol Biol 2010;121: 425-429.
2. Takiishi T, Gysemans C, Bouillon R, Mathieu C. Vitamin D anddiabetes. Endocrinol Metab Clin North Am 2010; 39: 419-446.
3. Hypponen E, Power C. Vitamin D status and glucose homeostasis in the 1958 British Birth cohort. Diabetes care 2006; 29:2244-2246.
4. Bayani MA, Banasaz B, Saeedi F. Status of Vitamin-D in diabetic patients and compared it with healthy individuals. Caspian J Intern Med 2014; 5(1): 40-42. 5. Bajaj S, Singh RP, Dwivedi NC, Singh K,
Gupta A, Mathur M. Vitamin D levels and microvascular complications in type 2
diabetes. Indian J Endocr Metab 2014;18:537-41
6. Scragg R, Sowers M, Bell C, Third National Health and Nutrition
Examination Survey. Serum
25‑hydroxyvitamin D, diabetes, and ethnicity in the Third National Health and Nutrition Examination Survey. Diabetes Care 2004;27:2813‑8.
7. Suzuki A, Kotake M, Ono Y, et al. Hypovitaminosis D in type 2 diabetes mellitus: Association with microvascular complications and type of treatment. Endocr J 2006;53:503‑10.
8. Forouhi NG, Ye Z, Rickard AP, et al. Circulating 25-hydroxyvitamin D concentration and the risk of type 2 diabetes: results from the European Prospective Investigation into Cancer (EPIC)-Norfolk cohort and updated meta-analysis of prospective studies. Diabetologia 2012;55:2173–82
9. Chaychi L, Mackenzie T, Bilotta D, Lynch M, Cohen J, Comi R. Association of serum vitamin D level with diabetic polyneuropathy.Med Practise Rev Feb 2011;2:11-5.
10.Soderstrom LH, Johnson SP, Diaz VA, Mainous AG 3rd. Association between vitamin D and diabetic neuropathy in a nationally representative sample: Results from 2001‑2004 NHANES. Diabet Med 2012;29:50‑5.
11.G.-B. Qu et al. Journal of Clinical & Translational Endocrinology 2017;9: 25– 31
12.Cui LJ, Chang XY, Zhu LY, Zhou T, Feng G, Sun K. Relationship between serum vitamin D diabetic peripheral neuropathy. China J Mod Med 2015;25(24):57–60 . 13.Sánchez-Hernández RM, García-Cantón
Niraj Agarwal et al JMSCR Volume 06 Issue 09 September 2018 Page 663 cross-sectional study in Gran Canaria,
Spain. Clin Nephrol 2015;83:218–24. 14.Aksoy H, Akçay F, Kurtul N, Baykal O,
Avci B. Serum 1,25 dihydroxy vitamin D (1,25(OH) 2D3), 25 hydroxy vitamin D (25(OH) D) and parathormone levels in diabetic retinopathy. Clin Biochem 2000;33:47‑51.