Complex Systems Informatics and Modeling Quarterly CSIMQ, Issue 6, March/April 2016, Pages 12-30
Published online by RTU Press, https://csimq-journals.rtu.lv http://dx.doi.org/10.7250/csimq.2016-6.02
ISSN: 2255-9922 online
A Consensus-based Approach for Team Allocations: the Case of
Logistics in Campania Region
Clara Bassano1, Maria Vincenza Ciasullo2,
Matteo Gaeta3 and Luigi Rarità4
1 Department of Managerial Studies and Quantitative Methods (DISAQ),
“Parthenope” University of Naples, Via Generale Parisi, 13 (Palazzo Pakanowski), 80132, Naples, Italy
2Dipartimento di Studi e Ricerche Aziendali – Management & Information Technology,
University of Salerno, Via Giovanni Paolo II, 132, 84084, Fisciano (SA), Italy,
3 Dipartimento di Ingegneria dell’Informazione, Ingegneria Elettrica e Matematica Applicata,
University of Salerno, Via Giovanni Paolo II, 132, 84084, Fisciano (SA), Italy,
4 CO.RI.SA, Consorzio RIcerca Sistemi ad Agenti,
University of Salerno, Via Giovanni Paolo II, 132, 84084, Fisciano (SA), Italy
clara.bassano@uniparthenope.it, {mciasullo, mgaeta}@unisa.it, lrarita@corisa.it/lrarita@unisa.it
Abstract. This work proposes a competence-based approach, enriched by consensus, for deciding on team compositions, in particular, time- and quality-dependent contexts, where teams have to perform some assigned activities. This problem is very relevant for the dynamics of logistic networks whose nodes are warehouses, distribution centers, and small family businesses that deal with work orders that have to be satisfied. The approach consists of models that focus on workers’ competences by using the Knowledge, Skills, and Attitudes model for workers’ knowledge representation, and competence models to describe the activities to be performed. Some consensus strategies among workers are then used to obtain the correct choice of teams to assign to the various work orders. According to the concept of value co-creation, this paper proposes an original and hybrid approach, based on competences and enriched by consensus, in order to obtain and select the most “suitable” teams for the activities to be performed. This approach is tested, carefully and in depth, on the real case of a small family business inside a sophisticated logistics area, consisting of a fleet of trucks that, by transporting goods from one point to another, underpins the logistics chain inside the Campania region (Italy). These areas of logistics consider small family businesses, which manage the maintenance and repair or trucks, as highly critical nodes of the system. We show that our approach produces results similar to the decisions made by the leader of such a small family business.
Keywords: Logistics, competence, consensus, experience.
1 Introduction and Motivations
13 In this context, the success of operations depends on a great number of factors. In particular, considering transportation times from one point to another, the need to ensure suitable conditions for transported goods (e.g., fresh food in a cold chain context) is based on the ability to reduce unexpected events, such as faults that can occur on trucks passing through the various points of the network. For long distances, large freight companies, with internal workshops, manage truck fleets that handle the distribution of goods among nodes of the logistic network, ensuring an efficient service. On the other hand, in specific geographical areas, such as the Campania Region and especially the so-called district “Agro Nocerino Sarnese” (ANS), the whole universe of small and medium retailers is mainly served by the so-called “Padroncini”, which are small freight companies often consisting of just one person. In particular, Padroncini represent the backbone of the whole area, ensuring distribution of products to small and medium municipalities. In the ANS, Padroncini use a great number of workshops/establishments which specialize in the repair, customization, and maintenance of trucks. These establishments offer maintenance and assistance to Padroncini, as they are often exposed to different faults, such as mechanical breakdowns that might have a negative impact on the transport and/or storage of products. The latter is much more critical because conditions that guarantee the products’ safety in distribution centres depend on the effective preservation which is ensured by the proper functioning of the trucks’ equipment that must be maintained in optimal condition.
Considering such phenomena, such as the transits of trucks in the logistic network, there are further nodes, consisting of sets of small family businesses (having in average of fifteen employees), whose main task is to repair the faults on trucks. Possible delays in faults repairing causes logistic inefficiencies in terms of products’ distribution and deterioration when they are offered to the final consumer. This creates negative impacts both on the economy of the ANS district and the whole Campania Region. Therefore, the nodes are highly critical because they have a direct influence on the logistic distribution. A possible improvement of the internal dynamics of the ANS district may depend on the management of activities in these logistic nodes [1]. In other words, it is necessary to focus on these nodes and their activities. This purpose structure is highly complex, because the decision processes within small businesses are very empirical, based on experience and traditions and taken by a leadership that, over the years, may be subject to changes [2]. The transition from one leadership to the next may cause negative trends, as decisions may not be structured and usually only part of the knowledge of the previous leadership is transferred to the next generation. This has a significant impact on either clients (in this case, Padroncini) or the company itself. Undoubtedly, such situations affect the logistic chain performances in a negative way.
In accordance with to the previous statements, the aim of this paper is to analyse a specific critical node, providing an appropriate solution for Padroncini’s needs and ensuring, therefore, a possible improvement of performances in the ANS logistic network. In particular, the object of the study is a workshop located inside the ANS district.
Following an idea already proposed in [3] for the improvement of logistics inside the Campania region, we propose a methodology to capture the leadership’s decisions in small family businesses. Such an approach foresees the fusion of models often used individually, which deal with workers’ competences; competences required for the development of the work orders’ activities and a consensus procedure among workers for each work order. Hence, it can be seen as a competence-based approach, enhanced by consensus. Unlike the methodology used in [3], in this case the aim is to reconstruct the various teams for work orders without the presence of the leadership being necessary; with consequent benefits in terms of authoritativeness of all the involved workers. Once the reconstructed teams of workers are obtained, they are compared with the leadership’s choices, in order to test the quality of the proposed approach.
14 typical features and empathy among workers match the leadership’s decisions. In this process, the crucial part is represented by the “consensus” itself; that is: a situation of acceptable decision harmony among all the workers involved in the final choice of a team to be assigned to a given work order. The scientific literature presents different mathematical models (see, for instance, [10], [11], [12], [13], [14], [15]) for consensus strategies. This paper focuses on a Fuzzy Consensus Model, which deals with fuzzy preference relations [16] and a moderator process that can be established if a consensus state occurs. If a consensus is not obtained among all workers, feedback mechanisms are established in order to achieve the convergence of the decision process. Such a decision is the best possible in the interest of all workers; presenting a sufficient agreement among them all. Notice that a possible correct decision ([17], [18], [19], [20]) implies positive feedback from the final customer. From a Service Science (SS) [21] perspective, we consider the case of a small family business as a service system ([22], [23], [24], [25], [26], [27], [28]) in which the advantage of a Fuzzy Consensus Model is as follows: services are chosen in order to gain an acceptable degree of consensus between all the possible participants of the system. This enable a high value co-creation [29], considering supply chains ([30], [31], [32], [33], [34], [35], [36], [37], [38], [39]) within the logistic context [40], [41].
Notice that this approach is totally different from the one proposed in [3], where experience was captured using a Pattern Mining algorithm, and, to be precise, an Apriori one ([42], [43], [44], [45]), in order to identify a typical group of workers proposed by the leadership. Other interesting applications are in [46] and [47], while we consider [48] for a survey.
The approach is tested on a real small family business inside the Campania region. The results for first choice work teams (the teams chosen by the leadership) and second choice teams (the alternative teams if first choices are not possible) are very positive.
The paper is organized as follows. Section 2 considers details of shared governance, consonance and resonance, useful for decisions dealing with teams’ reconstructions. Section 3 presents the theoretical background that describes the proposed problem within the SS context. In Section 4 a motivating scenario, that is a case study of a real critical node in the Campania region, is presented. Section 5 describes the overall approach for the reconstruction of workers’ teams, with emphasis on the competence model and the consensus for the final decisions. Section 6 contains the final research results. Conclusions ends the paper in Section 7.
2 Consensus and Value Co-creation through a Shared Service Governance
According to a Service Science perspective, the competitive advantage refers to the capability of co-creating shared value through relationships and interactions with the relevant entities populating the context. Generally speaking, we live in an evolving ecology of Entities-Interactions-Outcomes. From this perspective, we might interpret small family business as nodes of a supply chain, which is also defined as a logistic system: this is made coherent with a service system definition.
In literature, Lambert, Stock, and Ellram [41] define a supply chain as the alignment of firms that brings products or services to market. Note that these concepts of supply chain also include the final consumer. Another definition qualifies a supply chain as the network of organizations that are involved, through upstream and downstream linkages, in the different processes and activities that produce value in the form of products and services delivered to a final consumer [31].
15 In the age of service systems, by considering conceptualizations – both service system and supply chain – the viability of service systems depends on the capability of its government to
create and develop mechanisms of value co-creation and to guarantee systemic equi-finality, based on a continuous process of mediation of stakeholder expectations [27].
In particular, the viability depends, first and foremost, on the achievement of a shared governance which means a governance shared among all the components of a service system.
Consequently, we can assume that a shared governance depends on the ability to perceive the
context improving interactions with other service systems that achieve the required harmony among components in order to get consonance and resonance.
This implies a government capability (either for internal self-governance or external relationship governance), which creates value for the stakeholders or supra-systems. In fact, each service system has to attain consonance (a potential for value creation) and resonance (the realization of value creation) with its environment to be viable. In other words, the survival of a system depends on its decision-making and problem-solving process coherence (consonance and resonance) with the complexity and change in the environment. Defining context according to a service systems view; the context is the subjective representation of the reality created by the government.
The innovative concepts of consonance and resonance are fundamental to all service systems
analysis of problem situations and so we think they could fit very well within the Fuzzy Consensus Model in order to deal with Fuzzy Preference Relations, as we will show in the following sections.
In fact, consonance means the structural compatibility or adequacy between different entities,
while resonance is the outcome of the interaction between these consonant entities. According to
this perspective, the consonance measures the capability of the system to achieving mutual benefits (value co-creation) based on its structure (accessible resources) and the limits of sharing and coordinating information between different entities (viable systems). The resonance measures the results of interactions in context, producing and sharing value for and with stakeholders or supra-systems. If consonance (potential) increases with time, then so can resonance (performance).
Consequently and according to the main purpose of the paper, the reason why we propose these two innovative concepts of consonance and resonance is that they might help to decide the
better composition of the participants of the selected team of a certain logistic system in order to co-create the higher value process. In this way, the two concepts of value co-creation and equi-finality, which characterize service systems viability, imply networking cooperation and
collaboration such as in logistic networks that, as stated in previous section, have nodes of small family businesses.
Hence, in order to better manage logistic networks, we consider them as service systems referring to the framework Service Science, Management, Engineering, + Design Arts and Public Policy (SSME+DAPP, [26]) - in short Service Science (SS).
SS offers an innovative alternative to the efficiency oriented current practice – business development on a cost bearing basis – privileging instead, the capacity for defining growth and/or development through selecting resources wisely and evaluation of productivity processes and value co-creation. By this means, services will be chosen in order to have an acceptable consensus degree among all the possible participants of the system, co-creating a higher value within small family businesses interpreted as Service Systems.
Furthermore, the proposed framework acknowledges the value of human resources that guarantee competiveness and revitalize viable service systems even during recession.
16
3 Theoretical Background
The Service Science, Management, Engineering, + Design Arts and Public Policy (SSME+DAPP) framework begins with an analysis of the service systems in a real-world problem situation. In broad outline [21], the SSME+DAPP analysis approach is to:
Identify all the stakeholders service system entities in a network under study (a network analysis is always done in the context of the entire service system ecology);
Examine existing relationships, value co-creation mechanisms, and understand the problems and opportunities the stakeholders have identified;
Try to improve existing value co-creation mechanisms (this may involve freeing up resources from existing service system entities and redistributing them);
If problems and opportunities remain, create new service system entities to address them. It is important to remember that SS is built on top of the Service Dominant Logic (SDL), which provides a new way to look at the world in terms of entities (resource integrators) that normatively interact to co-create value [29].
SDL has ten foundational propositions and begins with the premise that service is the fundamental basis of all exchange.
Consequently, SS defines service as value co-creation phenomena that occur when service system entities interact according to value propositions that guide the application of competence for mutual benefit.
This view is perfectly consistent with the e3-value approach, provided by Gordijn and Akkermans [33], [34], which allows the representation and understanding of value flows between the several actors of an e-business model. The main elements are value-oriented and actor-oriented.
In particular, the central concept of Gordijn’s Business Model is value. He explains the creation and the addition of value in a network of multiple partners as a constellation as well as the exchange of value among the stakeholders.
He says that in an e-Business Model concerning business on the internet, a consortium of companies delivers a service to final consumers and it is essential that the participating companies have a common understanding of the offer they are supplying.
From this perspective, the business model is a mode of representation of the roles of the different actors, and of the way in which the value is exchanged and of flows that are involved between the parties.
In such logic and according to our framework, a shared governance for consonance and higher
value co-creation in human resources has to address the interpretation, mediation and synthesis of specific and partial expectations in order to guarantee efficiency, adequacy and equifinality.
In order to help develop that “needed empathy” among workers and match it with the leadership’s decisions, structural diversity has to be properly aligned: this is also so from a cybernetic perspective. Consequently, Ashby's requisite variety and the reducing of “subjective drifts” (subjective goals) tend to avoid the risk of undermining mutual satisfaction through “retrieving order from noise” [20]. Consequently, stakeholder decisions have to consider the mediation effect of other stakeholders’ views, in order to achieve mutually beneficial outcomes.
From an SS perspective, the researcher, looking at complex phenomena, must realize that he/she can never achieve complete and fully objective knowledge; rather it is only approximate [23], [24], [20].
17 provides means (“know how”) to those ends. Both types of knowledge are the fundamental capabilities (cognitive assets) required to attain and maintain viability [19].
Because service system entities change and learn, the resource allocation problem is the fundamental decision that must repeatedly be made in order to remain viable [25]. Dealing with new levels of complexity requires new types of decision making in which we cannot necessarily use fixed models or stochastic methods to find a solution, but we need to achieve a shared governance, based on a bottom-up logic characterized by common knowledge, trust and suitability to a particular problem’s complexity level.
Summing-up, we think that SS could be a methodological approach that could really help to develop that “needed empathy” among workers to be matched to the leadership decisions. Moreover, this methodological approach should be interpreted as a framework to advance the understanding of complex social systems such as logistic networks that: integrate disciplines, systems and cultures; improve multilevel and shared governance; move beyond dyads to nested, networked systems. Indeed, this implies a cultural shift in terms of staff recruitment that small family businesses must evaluate in terms of structural cost and from a systems perspective. Hence, the continuous search for compatibility and the synergic effects that each resource guarantees in value co-creation processes for the business, should be measured over time. Management also has to analyze the interdependency of skills necessary to ascertain “the extent” to which a resource participates in the value co-creation process of the service system as a whole. Concluding, SS aids in delineating the convergence in the decisional process, aligning consensus on the correct team to choose. As mentioned, this will require the evaluation of skills, which implies calculating the value a resource brings.
4 Motivating Scenario: a Real Critical Node for Logistics in Campania Region
In what follows, we consider the analysis of a real critical node of the logistic network inside the Campania region. The activities of such an enterprise are managed by a family and deal with single work orders that are satisfied according to clients’ exigencies.
In particular, the leadership considers each work order and, according to the type of client and priority status, assignes a work team, which consists of a subset of workers who are the most suitable either for their skills/abilities or for the characteristics of the work orders and priorities of the Padroncini.
The enterprise has different classes of workers, who are listed as follows and whose names are not reported for privacy. There are four coach builders (C1, C2, C3 and C4), four varnishers (V1, V2, V3 and V4), four welders (W1, W2, W3 and W4), two electricians (E1 and E2), three mechanics (M1, M2 and M3) and two upholsterers (U1 and U2).
The leadership assigned a work team to each of the various work orders, as follows: (1) Engine restoration. (2) Mobile case restoration. (3) Refrigerator restoration. (4) Cargo bed modifications. (5) Truck preparation. (6) Pitch stretching. (7) Case painting. (8) Cabin painting. (9) Leaf spring replacement. (10) Cabin replacement. (11) Truck recovery. (12) Truck restoration. (13) Tractor transformation rebuilding. (14) Soft top construction. (15) Cistern Tank painting. (16) BRT case restoration.
The work orders listed above represent an exhaustive set of all possible requests that the enterprise receive from clients, i.e. Padroncini, each year. In particular, work order 16 indicates the client BRT: very famous in the Campania region for his transportation company.
As for the team assigned to the work orders, following the analysis of [3] and [1], we distinguish between of “first” and “second choice” teams. The former are the ones chosen when all workers are available. The latter are considered by the leadership when some of the most suitable workers for a given work order are already busy or not available.
18 Notice that the work teams of second choice are not always used by the leadership. Indeed, for some particular work orders (1, 9, 12, 14, 15 and 16, indicated in gray in Table 1), the enterprise prefers not to assign alternative teams because of the delicacy of the required actions. In these cases, the work teams are the first choices of the leadership.
Hence, if it is not possible to assign the team of “first choice”, the work order is queued and the corresponding operations are made at a later time. Moreover, queues of work orders might also occur if it is not possible to create “second choice” work teams.
In this last case, the work orders are completed with a priority, strictly dependent on the clients’ characteristics.
Table 1. Work orders and the work teams of first (F) and second (S) choice Work
orders
Work teams F
Work teams S
Work orders
Work teams F
Work teams S
1 C1, M3, V1 9 W4
2 V3, W2 V2, W1 10 C2, E1, M3, V2 C2, E1, M3, V3
3 V4 V2 11 C1, E2, M2, V1 C2, E2, M2, V1
4 V4, W4 V1, W4 12 E1, M1, V2, W1
5 V1, V2, W2, W3 V2, V3, W1, W3 13 C1, E2, U2, V1, V3
C2, E2, U2, V1, V2 6 E1, M1, V3, W2 E1, M1, V3, W3 14 E1, V4, W2, W3
7 V4, W4 V1, W4 15 C3, C4, V1, V3
8 C1, V1 C2, V1 16 V3, V4, W3, W4
In order to improve all operations inside the logistic network, a clear analysis of work orders and teams is necessary, with the aim of reproducing the possible choices of the leadership. This problem is very difficult, as it deals with the tradition and history of the enterprise. For this reason, various approaches, whose combination might imply a partial reproduction of the leadership’s choices, should be considered. Decomposing the original problem into possible factors that are suitable for finding a correct solution, it is possible to recognize that the choices’ characteristics obey the following criteria: competences of workers involved in work teams; leadership’s experience; focus on clients’ and work orders’ characteristics; empathy among workers; and their ability in the different activities of various work orders. Such last aspects are difficult to model in a proper way. In this case, unlike the approach proposed in [3], the leadership’s choices for team reconstructions are due to either competence models or a degree of concensus among workers involved in work orders. This last aspect is fundamental, as the teams’ formation is effected by the workers themselves and does not consider the leadership. Indeed, there are many models dealing with such problems, but these are often used individually. The real thrust of this work foresees the fusion of existing approaches with the aim of obtaining an acceptable reconstruction of teams resulting from a consensus among workers.
In detail, as for the competence representation, we consider Knowledge, Skills and Attitudes, see [8] for details. In particular, Knowledge is the set of support information for a given task; Skill is the capacity of developing the task; Attitude indicates a particular behavior in facing some situations. We indicate as KSA Model (see [5], [6], [7], [9]) the competence representation in terms of Knowledge (K), Skills (S) and Attitudes (A). Such a model is implemented via Lightweight Ontologies (written in SKOS and similar to taxonomies, see [4]), whose aim is to represent a particular domain in a hierarchical way. Finally, the KSA model foresees a score that indicates the competence level for each element of type K, S and A.
19 As for the consensus, fuzzy preference relations are used [16]. Precisely, subsets of workers, chosen through the KSA model, indicate suitable alternatives for the best team for a given work order.
The final decision, that reflects the exigencies of clients, the features of the work order under discussion and how workers interpret leadership’s decisions, is achieved by acceptable agreement by the whole business.
In what follows, first we describe some aspects of the chosen methods for competences and consensus; then, we analyse the approach for the reconstruction of teams for work orders.
5 Overall Approach
The whole approach foresees the fusion of models (often used individually) in order to capture suitable work teams of first and second choice.
Consider a Work Order WO, that requires p professional figures.
Definition (expert worker). A worker is said to be “expert” for the work order WO if he/she belongs to one of the p professional figures required for the WO.
For the work order WO, described through a KSA model for competences of workers and an ontology-based model for the required professional figures, the steps for the reconstruction of the team to be assigned are the following:
Competences of workers are represented using a KSA model.
Professional figures and competences required for the work order are represented.
Through the matching among workers’ competences and the required professional figures of the work order, get a set of r possible teams, , , …, , whose only and
are considered because of computational reasons.
Each one of the n workers of and proposes a possible team for WO. Hence, a set
of n teams, , , …., , is obtained.
It starts a decision process where the decision makers are all the possible expert workers of WO, and discuss the n teams , , …., .
Using the Fuzzy Consensus Model, get the team ∗ most “suitable” for the work order WO.
If possible, compare ∗ with the team that the leadership would have chosen for the work order WO.
For a better comprehension, consider, for instance, the work order 1. Following the previous steps, we see the reference team consists of C1, M3 and V3. A consensus procedure is necessary. Workers C1, M3 and V3 choose the teams that, according to their opinions, are the best ones for the work order 1. Hence, they give three possible alternatives, that we shortly indicate by , , and . The experts, who have to provide judgments on such alternatives, are all the available workers belonging to the categories “coach builder”, “mechanic” and “varnisher”, as work order 1 requires these three professional figures. As a consequence, the maximal number of expert workers is 11 (four coach builders, three mechanics, four varnishers).
The consensus approach foresees that all expert workers (decision makers) must provide an opinion for all alternatives. Such opinions are collected and processed in order to calculate a consensus measure that is compared with a threshold. If the consensus threshold is reached, then the work team, based on that final decision, is selected. If the consensus is not achieved, then some feedback is generated and sent to some decision makers. These decision makers, who received the feedback, are invited to modify their opinions according to those of their neighbors, who are decision makers with similar opinions.
20 Figure 1. BPMN diagram for the proposed approach
5.1 Competence Modeling
Although the approach described above is general, it is applied to the small family business analysed, for which KSA models for workers and work orders are constructed. First, a different KSA model is defined for each type of worker (coach builder, electrician, mechanic, upholsterer, varnisher and welder). Then, considering the characteristics of the various work orders, KSA models for work orders are obtained. Indeed, KSA models for workers and work orders have a precise difference: the former focus on all characteristics of workers while the latter consider what is useful for an assigned work order. For a better comprehension, consider Table 2, that contains the twenty one concepts (divided into Knowledge, Skills and Attitudes) of the KSA model for the worker “mechanic”.
Table 2. Complete KSA model for the worker “mechanic”
Knowledge Skills Attitudes
Mechanics Monitoring of mechanical devices and production machines
Fast interventions in cases of failures
Analysing causes of faults
Accuracy
Planning and performing replacements of mechanical components
Identification of mechanical problems
Finding best solutions for causes of faults
Manual skills
Foreseeing preventive maintenances on mechanical components
Mounting/removing motors and mechanical parts
Using tools for machining
Flexibility and adaptability Applying procedures for setting
mechanical tools
Replacing, changing and/or recovering parts of a machine
Applying techniques of fault diagnosis to mechanical parts
Analytical thinking
Applying diagnostic techniques for fault detection on mechanical components
Checking the recovering of faults and malfunctions
Applying rescue techniques for mechanical parts
21 Each mechanic is classified using a score that is obtained by summing the separate scores (from 6 to 10) associated with each concept. In Table 3 we have the total scores for the mechanics M1, M2 and M3: this shows that the best mechanic is M3, for who the highest score occurs.
Table 3. Total scores for the mechanics M1, M2 and M3
Mechanic Total score
M3 192
M1 189
M2 181
The situation is similar for the other professional figures, namely, coach builders, electricians, upholsterers, varnishers and welders.
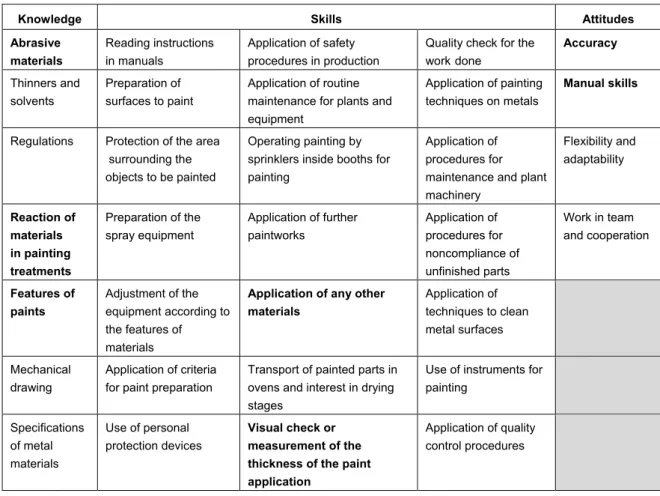
Notice that the KSA models for work orders are constructed using subsets of concepts of KSA models for workers. For instance, consider Table 4 that reports the thirty two concepts of the KSA model for the “varnisher” with the usual division into Knowledge, Skills and Attitudes. In particular, the eight bold concepts allow the constructing of the KSA model for work order 3 that requires a unique varnisher.
Table 4. Complete KSA model for the worker “varnisher”
Knowledge Skills Attitudes
Abrasive materials
Reading instructions in manuals
Application of safety procedures in production
Quality check for the work done
Accuracy
Thinners and solvents
Preparation of surfaces to paint
Application of routine maintenance for plants and equipment
Application of painting techniques on metals
Manual skills
Regulations Protection of the area surrounding the objects to be painted
Operating painting by sprinklers inside booths for painting
Application of procedures for maintenance and plant machinery Flexibility and adaptability Reaction of materials in painting treatments
Preparation of the spray equipment
Application of further paintworks
Application of procedures for noncompliance of unfinished parts
Work in team and cooperation
Features of paints
Adjustment of the equipment according to the features of materials
Application of any other materials
Application of techniques to clean metal surfaces
Mechanical drawing
Application of criteria for paint preparation
Transport of painted parts in ovens and interest in drying stages
Use of instruments for painting
Specifications of metal materials
Use of personal protection devices
Visual check or measurement of the thickness of the paint application
Application of quality control procedures
22 Notice that the concepts for each KSA model (either for workers or for work orders) correspond to different skos:ConceptScheme and skos:Concept, as shown in Figure 2, that
represents an extract of the KSA Model for Welders (abbreviates as KMW).
Figure 2. A portion of KMW
From Figure 2, we understand that the category Knowledge has the subcategories “Mechanics” and “Electrotechnics”; “Mechanics” consists of “Mechanical drawing”, “Metallurgy” and “Resistance of materials”. Skills has the subcategories “Treatment of materials”, “Use of devices” and “Consultation of normas”. Finally, Attitude has “Rigour in safety regulation”, “Manual skills” and “Accuracy”.
The ellipses indicate the subsets of welder qualities useful to construct a Work Order KSA model (shortly indicated by WOKMW), and precisely the work order 9. Notice that, using the only KMW, the welder to be chosen is W2 (the best worker for the work order), while WOKMW proposes W4. This last choice is coherent with that of the leadership (see Table 1), as it indicates the best worker for the assigned work order.
5.2 Consensus Model Fostering Collaborative Team Allocations
Consider the context in which a work team has to be assigned to a work order. In most real cases, there is not a total or partial correspondence to the choices indicated by the competence models. This is a clear consequence of the leadership’s decisions, which are affected by great experience in their clients’ characteristics and their workers.
With the aim of creating teams for work orders without the leadership’s contribution, we proceed as follows. Consider a generic work order for which a team has to be decided.
From competence models, a set of r possible teams, , , …, , is obtained. The
23 The proposed methodology foresees that the expert workers give all the possible shades of judgment for the possible teams associated with a work order. For instance, consider a discussion about a certain work order for which the possible teams are , , and . In this case, a generic worker, who is involved in the decision process, has to express an opinion on how much , , and are appropriate for the work order and has not to indicate only the most suitable team, a phenomenon that usually happens. For example, if the expert worker gives his/her opinions in a numerical way, in the range 0,1 , possible scores for , , and could be the following, respectively: 0.01, 0.9, 0.05 and 0.04. In this case, as has the highest value, it follows that the expert worker’s evaluation indicates that the team to choose is but, at the same time, it is known how much, as for the expert’s opinion, teams , and could be idoneous. The possibility of defining all the different degrees of the judgement allows a more direct exchange of ideas among all the expert workers, some of whom could probably have a higher influence in the final decision, with consequent advantages in finding agreements, i.e. consensus levels, which can satisfy the exigencies of the whole community.
Interesting consensus scenarios have been analysed using mathematical approaches, see [12] and [15], where the expert workers have different backgrounds and attitudes, as well as various levels of knowledge. In our case, we assume that:
For each expert worker ∈ , 1, … , , we have an importance, defined as a fuzzy subset with a membership function : → 0,1 , that indicates the importance degree of the opinion of .
Expert workers give their preferences using fuzzy preference relations in matricial form, see [16] and [14] for details.
Consider now a consensus reaching problem for a work order, i.e. an iterative process where the expert workers can modify their opininion according to a moderator, whose activities obey a feedback mechanism, shown in [10].
After that expert workers have given their preferences on the possible teams for the work order under discussion, the level of agreement is computed. Consensus degrees, useful to estimate the consensus level, are obtained as follows:
Fix two different expert workers, ∈ and ∈ with 1, … , 1, 1, … , , and compute the Similarity Matrix (SM), , where 1
.
Define a Consensus Matrix (CM), , with , 1, … , 1,
1, … , , where ∙ is a generic aggregation operator.
Using CM, find the following consensus degrees: consensus degree on pairs of
alternatives, ; consensus degree on alternatives: ∑ , ;
consensus degree on the relation: ∑ .
Compare with a fixed minimum required consensus level, ∈ 0,1 , for the problem under discussion. If , the consensus model finishes and a selection process (see [16]) is considered to obtain the solution. Otherwise, the feedback mechanism is activated and a new consensus iteration occurs.
The feedback mechanism, useful for guiding eventual changes of expert workers’ decisions, is based on the assumption that expert workers of lower importance have to be addressed more than others. The following steps define the degree of agreement between each expert worker and the group:
Compute a collective fuzzy preference matrix, , where ≔∑∑ .
24 ; similarity measure on alternatives: ∑ , ; similarity measure
on the relation: ∑ .
Such measures are used by the feedback mechanism to generate advices for the expert workers via two different phases, i.e. search for preferences and generation of advice.
Consider the search for preferences. The set of expert workers is decomposed as ∪
∪ , where , and are, respectively, the subsets of low-importance, medium-importance and high-importance expert workers. In particular, considering two threshold values, and , for an expert worker , 1, … , , we have that: ∈ ,
1, … , , if ; ∈ , 1, … , , if ; ∈ , 1, … , ,
if . As for the identification of Low/Medium/High-Importance Expert Workers’ Controversial Preferences, the sets of preferences to modify, , and for expert workers ∈ , ∈ and ∈ , respectively, are not described in detail here, but details are in [13] and [14].
For the generation of advice, for each preference value considered controversial, the model shows it is necessary to increase (resp. decrease) the current assessment if (resp. if ). A last remark is needed: the suggested changes are only recommendations to indicate the expert workers a possible solution to narrow their positions in the choice of the most suitable team.
An example of the possible application of the consensus within the scenario we are considering, is described as follows. Assume that we have to construct a team for the work order 4, that foresees a varnisher and a welder. From KSA models, it follows that the best team consists of V3 and W2, hence they decide two possible alternatives: V3 decides that the best team is the couple (V4, W2); W2 chooses the couple (V4, W4). The expert workers, who have to decide between such two alternatives, are all the varnishers and all the welders. Considering that W1 and W3 are not available, we have six possible expert workers: V1, V2, V3, V4, W2 and W4.
The set of expert workers is indicated by , , , , , 6 . For the evaluation criteria, we have the set of alternatives , 2 , with the following meaning: (team consisting of V4 and W2); (team consisting of V4 and W4). Following soft logic, all workers provide their opinions indicating a possible evaluation for each alternative. This guarantees a rich negotiation among all, with obvious advantage for the agreement of the whole. In what follows, we consider a situation in which all workers have the same importance, i. e. homogeneous expert workers with equal importance degrees (0.25). Assume a consensus level 0.9 and consider Table 5, where the expert workers provide some preference relations, giving a value 0,1 for each possible alternative.
Table 5. Preferences of the six expert workers
0.1 0.3 0.2 0.1 0.3 0.2
0.9 0.7 0.8 0.9 0.7 0.8
25
0.5 0.1
0.9 0.5 , (1)
0.5 0.3
0.7 0.5 , (2)
0.5 0.2
0.8 0.5 . (3)
Hence, we compute the Similarity Matrices (SMs). Some of them are:
1 0.8
0.8 1 , 0.961 0.81 , (4)
1 1 1 1 ,
1 0.9
0.9 1 . (5)
From all possible SMs, we get the consensus matrix:
1 0.894
0.909 1 , (6)
from which we have 0.9014. Hence, the consensus degree of the relation is 0.9014 . The consensus process ends and the selection process [13] indicates that the favourite choice is t2, namely, the team with V4 and W4.
Notice that, for this particular case, the feedback mechanism is not considered. Indeed, this usually occurs for cases in which many alternatives and expert workers are considered. Examples are in [13] and [16].
6 Results
This section presents the results obtained for the enterprise described in Section 1. In particular, the approaches, dealing, respectively, with the Apriori algorithm [3] and the consensus (see Section 5.2), are compared. Table 6 reports the comparison between the Leadership’s first choice Work Teams (LWT) for the various Work Orders (WOs) and the ones obtained using the Apriori algorithm and the consensus. The same happens in Table 7 for the second choice WOs, where gray lines indicate cases in which the leadership does not foresee second choices.
Notice that the reconstruction percentage is also indicated for each team in the various tables. Consider the results obtained using the fusion of KSA models and the Apriori algorithm. As for the first choices, the approach is able to capture a total correspondence for work orders 1, 2, 3, 4, 6, 7, 8, 9 and 16, i.e. a 100% reconstruction occurs for 9/16 situations. As for second choices, considering that work orders 1, 9, 12, 14, 15 and 16 do not have to be analyzed, we have a 100% correspondence in cases 2, 3, 4, 5, 6, 7, 8, 11 and 13.
Such results are summarized in Table 8 in terms of correspondence percentages. Notice that, using the fusion of the various approaches described in [3], we have:
For the first choice work teams, 13/16 work orders (about 80%) present a more than 50% correspondence with the leadership’s decisions.
26 Table 6. First choice teams and their reconstruction
WOs First choice LWT Reconstructed first choice teams using Apriori
Reconstructed first choice teams using
consensus
1 C1, M3, V1 C1, M3, V1 (100%) C1, M3, V1 (100%)
2 V3, W2 V3, W2 (100%) V3, W2 (100%)
3 V4 V4 (100%) V4 (100%)
4 V4, W4 V4, W4 (100%) V4, W4 (100%)
5 V1, V2, W2, W3 V1, V3, W2, W3 (75%) V3, V4, W2, W3 (50%)
6 E1, M1, V3, W2 E1, M1, V3, W2 (100%) E1, M1, V1, W1 (50%)
7 V4, W4 V4, W4 (100%) V4, W4 (100%)
8 C1, V1 C1, V1 (100%) C1, V1 (100%)
9 W4 W4 (100%) W4 (100%)
10 C2, E1, M3, V2 C1, E1, M3, V3 (50%) C1, E1, M3, V2 (75%)
11 C1, E2, M2, V1 C1, E2, M3, V1 (75%) C1, E1, M3, V1 (50%)
12 E1, M1, V2, W1 E1, M1, V3, W2 (50%) E1, M1, V2, W2 (75%)
13 C1, E2, U2, V1, V3 C1, E2, U1, V1, V3 (80%) C1, E2, U2, V2, V3 (80%)
14 E1, V4, W2, W3 E2, V3, W2, W3 (50%) E2, V4, W2, W3 (75%)
15 C3, C4, V1, V3 C1, C4, V1, V3 (75%) C1, C2, V1, V3 (50%)
16 V3, V4, W3, W4 V3, V4, W3, W4 (100%) V3, V4, W3, W4 (100%)
Table 7. Second choice teams and their reconstruction
WOs
Second choice LWT
Reconstructed second choice teams using
Apriori
Reconstructed second choice teams using
consensus
1
2 V2, W1 V2, W1 (100%) V2, W1 (100%)
3 V2 V2 (100%) V2 (100%)
4 V1, W4 V1, W4 (100%) V1, W4 (100%)
5 V2, V3, W1, W3 V2, V3, W1, W3 (100%) V2, V4, W1, W3 (75%)
6 E1, M1, V3, W3 E1, M1, V3, W3 (100%) E1, M1, V3, W3 (100%)
7 V1, W4 V1, W4 (100%) V1, W4 (100%)
8 C2, V1 C2, V1 (100%) C2, V1 (100%)
9
10 C2, E1, M1, V3 C1, E1, M1, V3 (50%) C1, E1, M1, V4 (50%)
11 C2, E2, M2, V1 C2, E2, M1, V1 (75%) C2, E2, M1, V3 (50%)
12
13 C2, E2, U2, V1, V2 C2, E2, U2, V1, V2 (100%) C2, E2, U2, V3, V4 (60%)
14
15
27 Table 8. Correspondence percentages for work teams using the Apriori algorithm
Case 100% More than 50% Less or equal than 50%
1st choice work teams 9/16 13/16 3/16
2nd choice work teams 8/10 9/10 1/10
Figure 3. Number of second choice work teams with more than 50% correspondence using the fusion of KSA models and the Apriori algorithm
This indicates that the approach, which foresees that the Apriori algoritm will capture the leadership’s experience, is quite useful for the reconstruction of the enterprise’s activity with a high degree of accuracy.
Focussing on the results obtained by the fusion of KSA models and the consensus. For the first choices, such an approach produces a total correspondence for work orders 1, 2, 3, 4, 7, 8, 9 and 16, that is to say in 8/16 situations there is a total reconstruction. As for second choices, remembering that work orders 1, 9, 12, 14, 15 and 16 foresee only teams of first choice, we get a 100% correspondence for work orders 2, 3, 4, 7 and 8. Table 9 summarizes the results in terms of correspondence percentages.
Table 9. Correspondence percentages for work teams using the consensus
Case 100% More than 50% Less or equal than 50%
1st choice work teams 8/16 12/16 4/16
2nd choice work teams 6/10 8/10 2/10
Finally, using the consensus, we get that:
For the first choice work teams, 12/16 work orders (75%) have a more than 50% correspondence with the leadership’s decisions.
For the second choice work teams, 8/10 work orders (80%) present a more than 50% correspondence with the leadership’s decisions, see Figure 4.
Notice that the consensus approach permits the obtaining of similar results to the ones achieved by the Apriori algorithm. Indeed, although the correspondence percentages are quite similar in both cases, the dynamics of workers’ association could be different. This is evident, for instance, in the cases of work orders 5, 6, 10, 11, 12, 13, 14 and 15.
0 1 2 3 4 5 6 7 8 9 10
100% More than 50 % Less or equal than
28 Figure 4. Number of second choice work teams with more than 50% correspondence using the fusion of
KSA models and consensus
7 Conclusions
In this paper, an analysis of logistics was considered in terms of work teams’ reconstruction for work orders inside a small family business.
The approach supports the theoretical framework of the proposed model. In fact, SS aids in delineating the convergence in the decision process, aligning consensus on the correct work team to choose. Active participation in problem solving decisions tends to heighten the commitment, involvement and the motivation of workers. In line with the direction of these results, it is possible to develop value co-creation processes based on a shared governance that synergistically joins empathy among workers with leadership decisions.
Considering a real case of a small family business inside the ANS district (Italy, Campania region) and using a competence-based approach, enhanced by consensus, it was possible to reproduce the dynamics of leadership’s choices with a 75% and 80% degree of accuracy, respectively, for first and second choice work teams.
The results obtained are quite similar to those that foresee that an Apriori algorithm will capture the leadership’s experience. The real fundamental difference between the approach proposed here and the one described in [3] is the following: in this context, expert workers are involved in decision processes, with consequent advantages in terms of positive impacts on the workers’ motivations and bypassing problems that could occur in cases of an absent/unavailable leadership.
References
[1] M. Gaeta, M. Perano, P. Piciocchi and L. Rarità, “Construction of decision criteria for family – run business,” in Proc. itAIS 2014, pp. 1 – 12, 2014.
[2] K. Cabrera-Suárez, “Leadership transfer and the successor’s development in the family firm,” in The Leadership Quarterly, vol. 16, pp. 71–96, 2005. Available: http://dx.doi.org/10.1016/j.leaqua.2004.09.010 [3] C. Bassano, M. V. Ciasullo, G. D’Aniello, M. Gaeta and L. Rarità, “Improvements of Logistics in Region
Campania Using a Profiling/Competence-based Approach, Enriched with Experience,” in Joint Proceedings of the BIR 2015 Workshops and Doctoral Consortium, co-located with 14th International Conference on Perspectives in Business Informatics Research (BIR 2015), vol. 1420, pp. 74–85, 2015.
[4] D. Clark, “Bloom’s Taxonomy of Learning Domains”. [Online]. Available: http://www.nwlink.com/~donclark/hrd/bloom.html
[5] P. Del Nostro, F. Orciuoli, S. Paolozzi, P. Ritrovato and D. Toti, “A Semantic – Based Architecture for Managing Knowledge – Intensive Organizations: The ARISTOTELE Platform,” in Web Information Systems Engineering – WISE 2011 and 2012 Workshops, pp. 133–146, Springer, 2013.
0 1 2 3 4 5 6 7 8 9
100% More than 50 % Less or equal than
29 [6] A. Gaeta, M. Gaeta, P. Piciocchi, P. Ritrovato and A.Vollero, “Evaluation of the human resources relevance in organisations via knowledge technologies and semantic social network analysis,” in Internation Journal of Knowledge and Learning, vol. 9, no. 3, pp. 219–241, 2014. Available: http://dx.doi.org/10.1504/ijkl.2014.068918
[7] V. Loia, “Special issue on new trends for ontology – based knowledge discovery,” in International Journal of Intelligent Systems, vol. 25, no. 12, pp. 1141–1142, 2010. Available: http://dx.doi.org/10.1002/int.20446 [8] V. Loia, C. De Maio, G. Fenza, F. Orciuoli and S. Senatore, “An enhanced approach to improve enterprise
competency management,” in 2010 IEEE World Congress on Computational Intelligence, 2010. Available: http://dx.doi.org/10.1109/fuzzy.2010.5584261
[9] D. Sampson and D. Fytros, “Competence models in technology – enhanced competence based learning,” in Handbook on Information Technologies for Education and Training, H. H. Adelsberger, Kinshuk, J. M. Pawlowski, D. G. Sampson, Eds., International Handbooks on Information Systems, Springer Berlin Heidelberg, pp. 155–167, 2008. Available: http://dx.doi.org/10.1007/978-3-540-74155-8_9
[10]F. J. Cabrerizo, J. M. Moreno, I. J. Pèrez and E. Herrera-Viedma, “Analyzing consensus approaches in fuzzy group decision making: Advantages and drawbacks,” in Soft Computing, vol. 14, no. 5, pp. 451–463, 2010. Available: http://dx.doi.org/10.1007/s00500-009-0453-x
[11]F. Calza, M. Gaeta, V. Loia, F. Orciuoli, P. Piciocchi, L. Rarità, J. Spohrer and A. Tommasetti, “Fuzzy consensus model for governance in smart cities,” in Proc. the 6th International Conference on Applied Human Factors and Ergonomics (AHFE 2015) and the Affiliated Conferences, pp. 1325–1332, 2015. Available: http://dx.doi.org/10.1016/j.promfg.2015.07.715
[12]F. Chiclana, E. Herrera-Viedma, F. Herrera and S. Alonso, “Some induced ordered weighted averaging operators and their use for solving group decision-making problems based on fuzzy preference relations,” in European Journal of Operational Research, vol. 182, no. 1, pp. 383–399, 2007. Available: http://dx.doi.org/10.1016/j.ejor.2006.08.032
[13]G. D’Aniello, V. Loia and F. Orciuoli, “A multi-agent fuzzy consensus model in a Situation Awareness framework”, in Applied Soft Computing, vol. 30, pp. 430–440, 2015. Available: http://dx.doi.org/10.1016/j.asoc.2015.01.061
[14]I. J. Pèrez, F. J., Cabrerizo, S. Alonso and E. Herrera-Viedma, “A New Consensus Model for Group Decision Making Problems With Non-Homogeneous Experts,” in IEEE Transactions on Systems, Man, and Cybernetics Systems, vol. 44, no. 4, pp. 494–498, 2014. Available: http://dx.doi.org/10.1109/tsmc.2013.2259155
[15]R. R. Yager, “Weighted maximum entropy owa aggregation with applications to decision making under risk,” in IEEE Trans. Syst. Man, Cybern., A Syst. Humans, vol. 39, no. 3, pp. 555–564, 2009. Available: http://dx.doi.org/10.1109/tsmca.2009.2014535
[16]E. Herrera-Viedma, F. Chiclana, F. Herrera and S. Alonso, “Group decision-making model with incomplete fuzzy preference relations based on additive consistency,” in IEEE Trans. Syst. Man Cybern. Part B, Cybern, vol. 37, pp. 176–189, 2007. Available: http://dx.doi.org/10.1016/j.ins.2013.08.042
[17]W. R. Ashby, “An Introduction to Cybernetics,” Chapman & Hall, New York, 1956. Available: http://dx.doi.org/10.5962/bhl.title.5851
[18]E. A. Locke and D. M. Schweiger, “Participation in decision making: One more look,” in New directions in organizational behavior, B. M. Staw, Ed., vol. 1, pp. 265–339, Greenwich, GT: JAI Press, 1979
[19]P. Piciocchi and C. Bassano, “Governance and viability of franchising networks from a Viable Systems Approach (vSa),” in The 2009 Naples Forum on Service. Service Dominant Logic, Service Science and Network Theory, Gummesson, Mele, Polese, Eds., 2009.
[20]H. Von Foerster, “Observing Systems,” in Intersystems Publications, 2nd ed., 1981.
[21]J. Spohrer, J. L. Anderson, N. Pass and T. Ager, “Service Science and Service Dominant Logic,” in Otago Forum, vol. 2, pp. 4–18, 2008.
[22]H. Demirkan and J. Spohrer, “Understanding Service Systems & Innovations in Time-Space Complexity: The Abstract-Entity-Interaction-Outcome-Universals Theory”, Working Paper, 2014.
[23]G. M. Golinelli, “L’approccio sistemico al governo dell’impresa,” Cedam, Padova, 2000.
[24]G. M. Golinelli, “Viable Systems Approach (VSA). Governing Business Dynamic,” Cedam, Kluwer, 2010. [25]J. March, “Exploration and Exploitation in Organizational Learning,” in Organizations Science, February 1,
30 [26]J. Spohrer, P. P. Maglio, J. Bailey and D. Gruhl, “Steps Toward a Science of Service Systems,” in IEEE
Computer, vol. 40, no. 1, pp. 71–77, 2007. Available: http://dx.doi.org/10.1109/mc.2007.33
[27]J. Spohrer, P. Piciocchi and C. Bassano, “Three frameworks for service research: exploring multilevel governance in nested, networked systems,” Service Science, vol. 4, no. 2, pp. 147–160, 2012. Available: http://dx.doi.org/10.1287/serv.1120.0012
[28]J. Spohrer, S. L. Vargo, P. P. Maglio and N. Caswell, “The service system is the basic abstraction of service science,” in Proc. the 41st Hawaii International Conference on System Sciences, 2008. Available: http://dx.doi.org/10.1109/hicss.2008.451
[29]S. L. Vargo and R. F. Lusch, “Evolving to a New Dominant Logic for Marketing,” in Journal of Marketing, vol. 68, January 2004, pp. 1–17, 2004. Available: http://dx.doi.org/10.1509/jmkg.68.1.1.24036
[30]S. Barile, “Management sistemico vitale,” Giappichelli, Torino, 2009.
[31]M. L. Christopher, “Logistics and Supply Chain Management,” London, Pitman Publishing, 1992.
[32]M. C. Cooper, M. L. Douglas and J. D. Pagh, “Supply Chain Management: More Than a New Name for Logistics,” in The International Journal of Logistics Management, vol. 8, no. 1, pp. 1–14, 1997. Available: http://dx.doi.org/10.1108/09574099710805556
[33]J. Gordijn and H. Akkermans, “Designing and evaluating e-business models,” in IEEE Intelligent Systems, vol. 16, no. 4, pp. 11–17, 2001. Available: http://dx.doi.org/10.1109/5254.941353
[34]J. Gordijn, H. Akkermans and H. Van Vliet, “Value based requirements creation for electronic commerce applications,” in Proc. the 33rd Hawaii International Conference On System Sciences, 2000. Available: http://dx.doi.org/10.1109/hicss.2000.926846
[35]J. B. Houlihan, “International Supply Chains: A New Approach,” in Management Decision, vol. 26, no. 3, pp. 13–19, 1988. Available: http://dx.doi.org/10.1108/eb001493
[36]T. Jones and D. W. Riley, “Using Inventory for Competitive Advantage through Supply Chain Management,” in International Journal of Physical Distribution and Materials Management, vol. 15, no. 5, pp. 16–26, 1985. Available: http://dx.doi.org/10.1108/eb014615
[37]J. T. Mentzer, “Managing Channel Relations in the 21st Century,” in Journal of Business Logistics, vol. 14, no. 1, pp. 27–42, 1993.
[38]R. Monczka, R. Trent and R. Handfield, “Purchasing and Supply Chain Management,” Cincinnati, OH: South-Western College Publishing, Chapter 8, 1998.
[39]G. C. Stevens, “Integrating the Supply Chain,” in International Journal of Physical Distribution and Materials Management, vol. 8, no. 8, pp. 3–8, 1989. Available: http://dx.doi.org/10.1108/EUM0000000000329
[40]B. J. La Londe and J. M. Masters, “Emerging Logistics Strategies: Blueprints for the Next Century,” in International Journal of Physical Distribution and Logistics Management, vol. 24, no. 7, pp. 35–47, 1994. Available: http://dx.doi.org/10.1108/09600039410070975
[41]D. M. Lambert, J. R. Stock and L. M. Ellram, “Fundamental of Logistics,” Boston: McGraw Hill, 1998. [42]R. Agrawal and R. Srikant, “Fast Algorithms for Mining Association Rules,” in Proc the 20th VLDB
Conference, pp. 487 – 493, 1994.
[43]P. Ashtana, A. Singh and D. Singh, “A Survey on Association Rule Mining Using Apriori Based Algorithm and Hash Based Methods,” in International Journal of Advanced Research in Computer Science and Software Engineering, vol. 3, no. 7, pp. 599–603, 2013.
[44]S. Barile, M. Saviano and F. Polese, “Information asymmetry and co-creation in health care services,” in Australian Marketing Journal, vol 22, no. 3, pp. 205–217, 2014. Available: http://dx.doi.org/10.1016/j.ausmj.2014.08.008
[45]T. P. Hong, C. Y. Wang and C. W. Lin, “Providing timely updated sequential patterns in decision making,” in International Journal of Information Technology & Decision Making, vol. 9, no. 6, pp. 873–888, 2010. Available: http://dx.doi.org/10.1142/s0219622010004147
[46]T. Calders, N. Dexters, J. Gillis and B. Goethals, “Mining Frequent Itemsets in a Stream,” in Information Systems, vol. 39, pp. 233–255, 2014. Available: http://dx.doi.org/10.1016/j.is.2012.01.005
[47]G. Cormode and M. Hadjieleftheriou, “Methods for finding frequent items in data streams,” in The VLDB Journal, vol. 19, pp. 3–20, 2009. Available: http://dx.doi.org/10.1007/s00778-009-0172-z