THE EFFECTS OF EARLY RECRUITING ON NCAA DIVISION I VOLLEYBALL STUDENT-ATHLETE RETENTION
Robert C. Hunter Jr.
A thesis submitted to the faculty at the University of North Carolina at Chapel Hill in partial fulfillment of the requirements for the degree of Master of Arts in the Department of Exercise
and Sport Science (Sport Administration)
Chapel Hill 2015
Approved by: Barbara Osborne
ABSTRACT
Robert C. Hunter Jr.: The Effects Of Early Recruiting On NCAA Division I Volleyball Student-Athlete Retention
(Under the direction of Barbara Osborne)
ACKNOWLEDGEMENTS
TABLE OF CONTENTS
LIST OF FIGURES AND TABLES..………ix
LIST OF SYMBOLS AND ABBREVIATIONS………...x
CHAPTER 1: INTRODUCTION………1
Introduction………..1
Statement of the Problem……….5
Statement of Purpose...………5
Research Questions………..5
Definition of Terms………..…………5
Assumptions……….6
Limitations...………....7
Delimitions………...…7
Significance of the Study……….7
CHAPTER 2: LITERATURE REVIEW……….8
Introduction………..8
Theoretical Framework………8
Recruiting Regulations……….9
Division I Volleyball Recruiting Practices………10
Decision-Making Process for Entering College………16
Decision-Making Process for Transfers or Dropouts………17
Negatives of Early Recruiting………22
Research Between Early Recruiting and Transfers………...23
Conclusion……….24
CHAPTER 3: METHODOLOGY……….25
Introduction………25
Purpose………...25
Instrumentation………..25
Credibility, Validity, and Reliability……….26
Sample………26
Procedures & Data Collection………...26
Statistical Analytical Methodology………26
CHAPTER 4: Results………28
Introduction………28
Description of Population………..28
Research Question #1………31
Logistic Regression………32
Chi-Square Test of Independence………..35
CHAPTER 5: Discussion………40
Introduction………40
Implication of Early Recruiting and Student-Athlete Retention………40
LIST OF FIGURES
Graph 4.1: Count of Number of Months Committed Prior to Enrollment ...29
Table 4.1: Years Competed at Original School ...29
Graph 4.2: Transfer Status Boxplot ...30
Graph 4.3: Dropoff Status Boxplot ...31
Table 4.2: Omnibus Tests: Months Committed * Transfers ...32
Table 4.3: Variables in the Equation Months Committed * Transfer ...33
Table 4.4: Omnibus Tests: Months Committed * Dropoffs ...34
Table 4.5: Variables in the Equation Dropoff * Months Committed ...34
Table 4.6: Chi-square Tests for Transfer*Greater24 ...35
Table 4.7: Transfer *Greater24 Crosstabulation ...36
Table 4.8: Dropoff * Greater24 Crosstabulation ...37
Table 4.9: Chi-square Tests for Dropoff * Greater24 ...37
Table 4.10: Exhaust * Greater24 Crosstabulation ...38
Table 4.11: Chi-square Tests for Exhaust * Greater24 ...38
LIST OF ABBREVIATIONS AND SYMBOLS GPA Grade Point Average
NCAA National Collegiate Athletic Association NLI National Letter of Intent
PSA Prospective Student-Athlete RPI Ratings Point Index
SPSS Statistical Package for the Social Sciences
CHAPTER I INTRODUCTION
Introduction
Consistently, the most essential factor for the success of collegiate athletic programs is
identified as recruiting (Day, 2011; Howat, 1999; Kankey and Quarterman, 2007; Teeples,
2005). College coaches devote extensive amounts of time and sections of their budget to achieve
high-level recruiting success, often traveling around the country year-round to evaluate
prospects, build relationships with junior coaches, and gain commitments for upcoming classes.
NCAA institutions award more than $2.4 billion in scholarships to over 150,000 athletes each
year (NCAA 2013). In many sports, there is no significant downtime for coaches, because when
the season ends, coaches transition directly to recruiting, if they ever were able to downplay it at
all.
Institutions value successful athletics programs because of the revenue generation athletic
departments may potentially generate (Day, 2011; Howat, 1999; Kankey and Quarterman, 2007;
Teeples, 2005). There have been several studies that highlight the relationship between
successful, nationally prominent athletics programs and an increase in applications at universities
(Fulks 2005; Mathes and Gurney, 1985; Mixon, Trevino, and Minto, 2004; Toma and Cross,
1998). Therefore, there is immense pressure on coaches to recruit, develop, retain and graduate
For prospective student-athletes, there is a similar investment of time and money in the
recruiting process. Junior sports have seen an increase in year-round participation and
specialization thanks to the proliferation of club teams in many parts of the country.
In sports such as girl’s soccer, lacrosse, and volleyball, athletes begin the recruiting
process as early as seventh or eighth grade (Popper, 2014). According to a report provided for
the New York Times by the National Collegiate Scouting Association (N.C.S.A.), 36% of
women’s lacrosse and 24% of women’s soccer athletes commit to institutions before the official
recruiting process under NCAA guidelines even begins (Popper, 2014). Anson Dorrance, one of
the early innovators of recruiting and evaluating young athletes, is leading the recent charge of
coaches pushing back against the practice:
It’s killing all of us. If you can’t make a decision on one or two looks, they go to your
competitor, and they make an offer. You are under this huge pressure to make a
scholarship offer on their first visit. It’s killing the kids that go places and don’t play. It’s
killing the schools that have all the scholarships tied up in kids who can’t play at their
level. It’s just, well, it’s actually rather destructive (Popper, 2014).
Dorrance, who has won 22 national championships as the head women’s soccer coach at
the University of North Carolina, was observed and interviewed while attending a soccer
tournament in Florida in January, less than two months after his 2013 season ended. The event
brought together 158 teams and over 600 college coaches to evaluate prospective athletes as
young as eighth grade (Popper, 2014). Many of those 600 coaches, including Dorrance himself,
although many coaches are pushing back against the early recruiting practice, they are in fact
driving the trend themselves (Popper, 2014).
Although specific research into the ill effects of early recruiting is limited, those involved
in the process have voiced concerns over the practice and its effects on athletes. From the
perspective of a club director, the loss of an opportunity for an official visit to impact the
recruiting process is significant (Kern, 2005). According to NCAA regulations, a prospective
student-athlete may not have a visit paid for by an institution until their senior year of high
school (NCAA, 2014). An official visit helps “re-level the playing field” for athletes from all
socioeconomic backgrounds, whereby each athlete can visit a school no matter their financial
situation (Kern, 2005). Prospective student-athletes may visit before their senior year, but they
have to pay for the trip entirely on their own, which may disqualify many athletes based on
financial status.
Although vague, many coaches decry psychological and physical pressures placed on
student-athletes due to the early recruiting process. Young athletes are specializing earlier in
their sport, causing significant stress on their bodies and resulting in burnout later in their
careers. The pressure of high-level competition also mentally stresses athletes, and many parents
and coaches report breakdowns in their athletes because of the recruiting process (Popper, 2014).
On the other hand, the high-profile nature of a young recruit committing as an eighth or
ninth grader can provide benefits. For programs, it increases their notoriety and publicity in an
age where recruiting coverage is exploding (Teeples, 2005). For the athletes, the opportunity to
finish the recruiting process and enjoy their time in high school is an extreme positive. In
Popper’s 2014 New York Times article, committed ninth-grader Kyla McKeon says, “I just love
The risk of such an early commitment arises when a student-athlete’s progression or a
program’s vision no longer match two or three years later. As Dorrance notes, student-athletes
may still attend and sit the bench during their time at an institution (Popper, 2014). There is also
the possibility that their verbal commitment will not be honored. The verbal commitment is
non-binding until the prospective student-athlete signs a National Letter of Intent (NLI).
In NCAA Division I volleyball, there have been high-profile instances of this occurring.
Kelli Browning was informed of her verbal offer to Wisconsin being rescinded by email from
then-Head Coach Pete Waite. Waite removed the offer because “he didn't think I [Browning]
was making the progress necessary” (Stewart, 2010). Browning committed to the Badgers as a
sophomore in high school, then was forced to reopen her recruiting late in the process as a
senior.
Another option for student-athletes who are in a sub-optimal situation is to choose to
transfer. Division I women’s volleyball has seen a notable increase in transfers over the past four
years. In 2010, there were 94 student-athletes who chose to transfer; in 2013, there were 266
student-athletes who changed institutions, according to RichKern.com. Athletes choose to
transfer for a multitude of reasons, including playing time, social connections, academics, and
precollege factors (Cooper and Hawkins, 2014;Wawrzynski, 2003; Williams 2007). Many
coaches are making the connection between the increasing number of early-commitments among
athletes and the rising number of transfers. The question is if there is data to support this claim,
especially since coaches, administrators, and the NCAA do not seem to be making any changes
Statement of the Problem
There is an increasing trend of Division I volleyball prospective student-athletes
committing early, before the official beginning of the recruiting process. Simultaneously, there is
an increasing number of Division I volleyball student-athletes transferring. In 2010, there were
94 student-athletes who chose to transfer; in 2013, there were 266 student-athletes who changed
institutions (Kern, 2014). There is limited information on the connection between these two
trends in college volleyball, and whether early recruiting may be influencing the factors that
cause a student-athlete to leave their institution.
Statement of Purpose
The purpose of this study is to examine the effect of an early recruiting commitment on
NCAA Division I volleyball roster attrition.
Research Questions
1. Are NCAA Division I volleyball recruits who verbally commit to their institution more
than 24 months before the first day of their freshman year in college significantly more
likely to transfer or leave the team versus athletes who wait longer to make a
commitment decision?
2. If they are significantly more likely, what are some factors that could explain this
occurrence?
Definition of Terms
• National Collegiate Athletic Association (NCAA): A voluntary, non-profit organization, consisting of approximately 1,200 members, through which colleges and universities in
divisions (I, II, and III) which each have their own distinct rules and regulations, as put
forth in the annual NCAA Manuals.
• NCAA Division I: The highest level of intercollegiate athletics as categorized by the NCAA. In order to qualify for Division I classification, the athletic department must be in
compliance with NCAA regulations and sponsor no less than 16 varsity sports.
Membership requirements for Division I are outlined in article 3 of the NCAA Division I
Manual.
• Prospective Student-Athletes: A prospective student-athlete is a student who has started
classes for the ninth grade or a student who receives any financial assistance or other
benefits from an institution that the institution does not provide to prospective students
generally. Additional information about prospective student-athletes can be found in the
Bylaw 13 of the NCAA Division I 2015 Manual
• Recruiting: Recruiting is any attempt to solicit or encourage a prospective student-athlete
or their legal guardian by an institutional staff member with the purpose of attending their
institution and participating in intercollegiate athletics.
Operational Definitions
• Roster Attrition: When a student-athlete departs a team, either by transfer, dropout or
leaving the team, before their eligibility is completed.
• Verbal Commitment: A non-binding agreement to attend and compete in intercollegiate
athletics from a student-athlete to an institution.
• Dropoff: When an athlete leaves their athletic team but stays enrolled at the school.
Assumptions
commitments. It was assumed that all student-athletes went through the recruiting process as
regulated by the NCAA, and that all student-athletes had a choice of a number of schools. It was
assumed that student-athletes had the final say during the decision-making process when
choosing an institution.
Limitations
This study may not be reflective of all student-athletes. This study is intended to reflect
the population of Division I women’s volleyball athletes. This study may not be generalized to
other populations in other NCAA divisions or sports.
Delimitations
This study was delimited to one sport and one division in the NCAA. Therefore, it may
not be representative of all student-athletes. This study is also delimited to one time period, from
2005 to 2010, so it may not be representative of all student-athletes from other periods.
Significance of the Study
As early recruiting and transferring become more and more prominent features of
Division I volleyball, it is important to examine if either are there is a negative relationship
between the two in regards to the student athlete. An investigation of the relationship between
recruiting and transfers could illuminate any changes that could be explored ensure focus during
CHAPTER 2 LITERATURE REVIEW
Before proceeding with a discussion of the methodology used in this study, there is
necessary background information about recruiting from both a regulatory and practical
standpoint that must be detailed. Further, there is a significant amount of research about college
choice factors and the transfer and dropout decision process that informs this study. First,
however, the theoretical framework for this study will come from the Expectancy theory, as
outlined by Brian Redmond, and the theory of emerging adulthood, as outlined by Jeffrey J.
Arnett.
Theoretical Framework
Expectancy theory is a process theory whereby individuals will chose one behavioral
option over another because they believe it will lead to their desired outcome (Redmond, 2009).
The practical application is as a motivation tool, because it can help create programs in the
workplace to produce desired performances (Redmond, 2009). It is easy to see how expectancy
theory applies to recruiting, as most actions taken by coaches or athletes are done because they
desire an expected outcome. Athletes pour countless hours into training regimens because they
believe this behavior will result in a scholarship. Coaches recruit early because of their desire to
Jeffrey J. Arnett posits the theory of emerging adulthood in his article published in 2000.
Arnett discusses a view of development that segments the late teens and the early 20s to create a
specific developmental period that is designed to attain an educational foundation (2000).
Emerging adults act and think in a different way from younger adolescent teenagers and older,
more established adults, using this time as a period of identity exploration (Arnett, 2000). This
theory provides a developmental backdrop for the analysis of the difference in decision-making
and development between recruited sophomores and younger (adolescents) and juniors and
seniors in high school (emerging adults).
Recruiting Regulations
The recruiting process for NCAA Division I institutions is regulated by NCAA
legislation, which is outlined in the annual NCAA Division I Manual. Bylaw 13 encompasses all aspects of recruiting, with the basic principle that a violation of NCAA regulations during the
recruiting process can affect a student-athlete’s eligibility for intercollegiate athletics competition
(NCAA Division I Manual, 13.01.1, 2014). Therefore, the NCAA incentivizes institutions and
coaches to actively monitor and participate in the recruiting process under strict regulations.
According to Bylaw 13, an evaluation of a prospective student-athlete is any “off-campus
activity designed to assess the academic qualifications or athletics ability of a prospective
student-athlete” (NCAA Division I Manual, 13.02.7, 2014). Evaluations can be made with any
athlete, regardless of age or grade, as long as they occur without contact between the recruiting
staff member and coach. When contact occurs, either by phone or in-person, there are additional
restrictions on recruiting staff members.
Many of these restrictions are in place in order to concentrate recruiting upon the junior
by a prospective student-athlete and occur at a recruit’s expense are allowed at any time, but all
other forms of contact are limited by sport and the recruit’s status in high school.
Another aspect of the recruiting process is prospective student-athletes visits to campus.
During their senior year of high school, prospective student-athletes can take a formal, 48-hour
visit to a campus that is paid for by the host institution (NCAA Division I Manual, 13.6, 2014).
An athlete is limited to one official visit to any individual institution, and a total of five official
visits overall (NCAA Division I Manual, 13.6.2, 2014). Only men’s and women’s basketball
have rules that allow high school athletes to make official visits before their senior year.
While official visits are limited, prospective student-athletes may make an unofficial visit
to a campus any number of times, and before their senior year of high school (NCAA Division I
Manual, 13.7.1, 2014). Institutional personnel may not accompany the recruit off-campus and
may not pay for any expenses, except for three complimentary admissions to a sporting event
on-campus (NCAA Division I Manual, 13.7.2.1, 2014). An unofficial visit can include unlimited
interaction with the coaching staff on-campus, provided it is not a dead period according to
NCAA regulations (NCAA Division I Manual, 13.02.5.5, 2014).
Division I Volleyball Recruiting Practices
The recruiting path for volleyball recruits can differ on any number of factors, including
skill, background and goals, much as it can differ for any athlete seeking to play college sports.
This section explains NCAA contact rules for recruiting and also discusses Division I volleyball
recruiting through the lens of trends, which are helpfully outlined in several published works.
Reynaud and Sonnichsen are both former coaches who have published works outlining the
Sonnichsen (2011) provides the framework for recruiting and identifies many of the
specifics to Division I and the changes over time. His book, Inside College Volleyball, lays out the typical process through four years of high school for a recruit. During a prospective
student-athlete’s freshman year, many colleges will send introductory letters in order to get information
from the athlete to enter into a database. In return, high school freshmen can send any number of
letters or emails and place phone calls in order to publicize themselves (Sonnichsen, 2011). A
recruit can also visit institutions for unofficial visits to meet the coaching staff and see the
campus, as long as the visit is outside of the dead period (Sonnichsen, 2011).
For high school freshmen and sophomores, there is a trend of athletes providing a verbal
commitment to an institution before they are able to take an official visit during their senior year.
Prospective student-athletes are able to learn more about the recruiting process through the
Internet and contact coaches themselves through text, email and traditional mail (Sonnichsen
2011). High school athletes can then pay their way for an unofficial visit and make a verbal
commitment to a coaching staff before their junior year starts (Sonnichsen, 2011).
NCAA regulations allow more channels of communication between coaching staffs and
prospective student-athletes the closer the recruit gets toward high school graduation. Coaches
can respond to emails or place phone calls to recruits starting in the beginning of his or her junior
year (NCAA, 13.1.3, 2014). Official visits are possible for seniors, and prospective
student-athletes are able to visit up to five campuses at no cost to themselves. Research into the
recruitment process has indicated that Division I volleyball players value an early opportunity to
see campus and interact with a coaching staff on unofficial visits (Reynaud, 1998). Concurrently,
volleyball recruits also rank an official visit, especially being the last official visit they take, as
Division I volleyball rules specify several periods that affect a coaching staff’s ability to
recruit and contact athletes. From August 1 to December 7, Division I is in a contact period
except for a three-day period in November that is a dead period. A contact period is the time
when it is permissible for authorized recruiters to make in-person, off-campus recruiting contacts
and evaluations with athletes (NCAA, 13.02.5.1, 2014). The dead period is when staff may not
make on-campus or off-campus contact with prospective student-athletes, except by telephone or
written contact (NCAA Division I Manual, 13.02.5.5, 2014). From December 8 to December 16,
it is considered a quiet period during the NCAA Division I Tournament, whereby authorized
staff may make on-campus contact with student-athletes (NCAA Division I Manual, 13.02.5.4,
2014).
After the championship ends but before the junior volleyball club season begins, there is
another dead period. January 1 starts another extensive contact period during the junior club
season that is marked by several days of either quiet or dead periods in January, April and May
(NCAA Division I Women’s Volleyball and Women’s Sand Volleyball Recruiting Calendar,
2014). Quiet periods are opportunities for athletes to take unofficial visits to campuses and
interact with coaching staffs, and similarly to prepare for the contact period when coaches will be
evaluating them (Sonnichsen, 2011).
College Choice Factors for Prospective Students
There has been a significant amount of research into the factors that affect a student’s
choice of higher education, including the recruitment process for prospective student-athletes.
Day (2011) examined recruiting from a consumer-oriented approach, where colleges and
university athletic programs needed to understand recruits as potential customers. Day surveyed
important decision factors were when choosing an institution to attend (2011). The study found
that for the sample, the top factors were academic or geographic, such as the majors offered or
distance from home (Day, 2011). Day’s study is notable as it is one of the few studies whose
sample identified non-athletic factors as the most important in the choice process (2011). The
study included two Division I institutions and one Division III university, which may explain
some of the difference from other studies focused on student-athletes in Division I only.
Another study, focusing on a cross-institutional sample of student-athletes, was
performed by Doyle and Gaeth in 2013. The study sampled 605 student-athletes from all eight
NCAA geographic regions and asked them to pick different choice profiles, mimicking the
recruiting and decision process (Doyle & Gaeth, 2013). The study found that the amount of
scholarship offered was significantly more important than other variables in the process (Doyle
& Gaeth, 2013). Further, when the authors ran analysis of demographic data against choice
profiles, the amount of financial need proved to be a significant indicator of the respondents that
chose the institution based on scholarship offers (Doyle & Gaeth, 2013).
Many of these studies have attempted to segment the population examined in order to
more precisely target factors that affect that group. For example, in 1980, Foreman published his
study of male football and basketball athletes from Tennessee, Louisiana, Mississippi, Kentucky
and Missouri (1980). Foreman received over 490 responses to his survey to identify common
recruiting practices and which factors played an important role in the prospective
student-athlete’s decision (1980). The study, which used tabular frequencies and a chi-square analysis to
analyze the survey results, revealed several conclusions. First, the majority of student-athletes
received their initial recruiting contact from a coaching staff member in their last two years of
focused on the prestige of the school and had a scholarship offer included in the recruitment
(Foreman, 1980).
A 2001 study targeted Division I football players to identify the attributes that
differentiated the school the student-athlete chose to attend versus the schools they considered
attending (Klenosky, Templin & Troutman, 2001). The authors used a means-end investigation
with laddering interviews to sample 27 Division I football players (Klenosky, Templin &
Troutman, 2001). The coach/coaching staff was a significant link in several ladders and was a
significant variable for the student-athletes interviewed (Klenosky, Templin & Troutman, 2001).
The coaching staff was important for student-athletes feeling comfortable, developing their
skills, and because they determined playing time (Klenosky, Templin & Troutman, 2001).
Several studies have focused on recruiting to a single institution to help provide best
practices or identify factors most closely related to recruiting success at one school. DeWaele
focused on recruiting for the University of Nevada, Las Vegas (1996). She developed a survey
instrument in conjunction with the athletic department at UNLV that measured the following six
components: (a) relationship with coaching staff, (b) success of program, (c) personal
achievement, (d) academics, (e) teammates, and (f) UNLV/Las Vegas (DeWaele, 1996). The
45-item instrument comprised of six components was developed and piloted with a field-test of 290
student-athletes at UNLV (DeWaele, 1996). Primarily, two components (relationship with Coach
and family perceptions of UNLV/Las Vegas) comprising 15 variables explained 43.6% of the
variance, based on two rounds of Principle Component Analysis (DeWaele, 1996). However,
there were significant differences between sports, shown by an ANOVA analysis. Soccer
student-athletes had a significantly lower mean-score for the relationship with coach component,
components (DeWaele, 1996).
Howatt focused on student-athletes attending East Tennessee State University and the
factors that affected their choice to attend ETSU (1999). Howatt interviewed all 47 freshmen
athletes from 12 different sports entering ETSU for the 1997-1998 academic year (1999). An
inductive analysis of the qualitative interview data revealed that the coaching staff, facilities, and
academics were the top factors for student-athletes choosing ETSU in the recruiting process
(Howatt, 1999).
A 2002 study by Walker set out to identify factors that influence prospective
athletes to attend a medium-sized Southeastern Conference school. Walker surveyed 49
student-athletes across 13 sports and, like Howatt, used inductive analysis on his collected data (2002).
The questionnaire included three parts: a section on college choice factors; an open-ended
section on the specifics of a respondent’s recruitment process; and demographic data (Walker
2002). The study found that scholarships, academic programs, and the coaching staff were the
most important factors to student-athletes (Walker, 2002).
Teeples’ 2005 study sampled student-athletes at the University of Tennessee to ascertain
the college choice criteria that most influenced their decision to attend Tennessee. Teeples
sampled 408 student-athletes across 16 sports during team meetings in the spring of 2004 (2005).
The study concluded that many athletes chose UT because of the opportunity to win a
championship during their time in school (Teeples, 2005). However, the paper also concluded
that there was a significant difference between the overall clustering of factors between male and
female athletes (Teeples, 2005). Female athletes tended to value athletic factors and their
comfort with people involved in the program, such as coaches or other players. Male athletes
the school’s athletic tradition (Teeples, 2005).
Huffman (2011) targeted Division I Football Bowl Subdivision football athletes from a
southeastern university. Huffman used a modified version of the Student-Athlete College-Choice
Profile to identify the fit between an athlete and an institution (2011). The study concluded that
for the sample, athletically-related factors such as the opportunity to compete in a bowl game,
win a championship, or appear in the top 25 were most important (Huffman, 2011). Huffman
concluded that in his population, respondents were significantly more influenced by the
opportunity to prepare for the professional football labor market than the broader labor market
(Huffman, 2011).
Finally, former Florida State Head Coach Cecile Reynaud conducted a volleyball-specific
study focusing in on the factors influencing a volleyball student-athletes choice of institution
(1998). Reynaud captured a sample of 500 volleyball student-athletes from 64 universities based
on stratified random sampling from the complete list of NCAA RPI (1998). The survey
instrument was designed with 30 questions that included information on personal, athletic, and
academic factors that were answered with Likert Scale questions (Reynaud, 1998). The study
concluded that student-athletes were drawn to institutions in their home state and to coaching
staffs that invited student-athletes to early campus visits, were honest during the recruiting
process, and did not pressure the recruit during the process (Reynaud, 1998).
Decision-Making Process for Entering College
Similar to the research performed on college-choice factors for student-athletes and
students overall, there has also been analysis of the decision-making process for important life
decisions such as entering or exiting college. Often times, this research serves to integrate
development. Research often considers the college choice decision as the first important life
decision or life-framing decision (Arnett, 2000; Galotti & Kozberg, 1994; Galotti & Mark,
1994).
Galotti and Mark’s longitudinal study of high-school students making their secondary
education decision served to analyze the process students use and the criteria they consider in
their college-choice process (1994). The study sampled 322 high school students, 88 male and
234 female, from 19 high schools in Minnesota (Galotti & Mark, 1994). The students were
recruited through homeroom and paid for each session they attended, with a total of three
sessions spanning from April 1991 to April 1992. Galotti and Mark concluded that students
considered roughly the same number and type of criteria throughout the year, but that the
specific criteria changed during the one-year period (1994). Students often used parents, friends,
and guidance counselors as sources of information; however, over time, only the parent’s
opinion stayed consistently influential as a factor in the final decision (Galotti & Mark, 1994).
Galotti updated her research with a 2007 article that compared the results of five studies
of real-life decision-making. Two of the studies involved decisions about college: study No. 1,
covered in Galotti and Mark, and study No. 2, involving college freshman deciding on a major
(Galotti, 2007). Galotti’s studies focus on the decision-structuring phase of the process in each
case, the phase in which the individual considers options and decides the criteria upon which a
decision will be judged (Galotti, 2007). In analyzing and comparing the five studies, Galotti
concluded that people typically constrain the number of criteria to a manageable number (often
from 3 to 9 criteria) but weigh multiple options at the same time (Galotti, 2007).
Decision-Making Process for Transfers or Dropouts
important to discuss the NCAA regulations surrounding transfers. The NCAA restricts
student-athletes’ ability to transfer freely based on several fundamental principles, mainly under the
principle of Student-Athlete Well-Being (NCAA Division I Manual, 2.2, 2014). In the event that
a student-athlete choses to leave a university, that student-athlete must wait one year before
participating in athletics at the new institution (NCAA Division I Manual, 15.5.1, 2014).
However, the student-athlete may receive a waiver from their previous school in order to
participate at their new school without penalty (NCAA Division I Manual, 14.5 2013). If a
school provides a release, this allows an exception to the one-year in residence requirement for
the athlete (NCAA Division I Manual, 14.5, 2014). This exception requires the
student-athlete to have met NCAA requirements for transfer, such as being in good standing, and for the
student-athlete to be participating in a sport other than baseball, basketball, bowl-subdivision
football, and men’s ice hockey (NCAA Division I Manual, 14.5, 2014). This requirement is in
place regardless of whether or not the student-athlete had their scholarship terminated or reduced
by their prior school. Therefore, NCAA regulations may be an additional deterrent for
student-athletes who want to transfer and continue their athletic career at another institution.
Much as there has been research into the decision to enter a college, similar research has
occurred on the decision to depart higher education before degree completion. One of the earliest
reviews of institutional dropout was conducted by Spady in 1971. Spady examined dropouts
from the perspective of Durkheim’s Theory of Suicide, in which suicide is more likely with a
lack of integration into the life of society (1971). Spady applies Durkheim’s theory via a lack of
integration into the culture and society of the institution, where students are unable to accept
themselves into school (Spady, 1971). This lack of integration can come from various
(Spady, 1971). Institutional policies can also affect the lack of integration, such as grading
policies that affect a student’s GPA (Spady, 1971).
Bean published a 1980 article on the determinants of student attrition in higher education.
Bean distributed questionnaires to 1,171 university freshmen and then the data was analyzed
using multiple regression and path analysis (Bean, 1980). Bean found that there were different
determinants that were statistically significant for men and women (Bean, 1980). Determinants
for females tended to be focused around educational quality, developing a routine, and their own
commitment to an institution (Bean, 1980). Meanwhile, men tended to value communication and
their own satisfaction with the university and education than women (Bean, 1980). Overall, the
researcher found that the decision to leave for women was often more complicated and was more
significantly related than their male counterparts, including academic success, development, and
housing (Bean, 1980).
DesJardins, Ahlburg and McCall published a 1998 study that analyzed student departure
using event-history modeling. This form of modeling allowed the researchers to pinpoint exact
times at which students are most at risk of a stopout, the study’s term for pausing or leaving
college (DesJardins, Ahlburg & McCall, 1998). The model had time-varying regressors such as
GPA, student-athlete, loans, on-campus, and earnings (DesJardins, Ahlburg & McCall, 1998).
Students with higher GPAs are less likely to stopout during the observation period; athletes tend
have significantly lower probability of a stopout during their first two years (DesJardins, Ahlburg
& McCall, 1998). Further, students who earn money on campus are less likely to stopout over
their time in college (DesJardins, Ahlburg & McCall, 1998).
The academic fit of student-athletes and the ability to retain athletes has been researched
t-tests to examine the relationship between graduation rates and athletic success (2003). Rishe
found that the overall undergraduate population was not harmed, in regards to graduation rates,
with athletic success at their institution (Rishe, 2003). Further, the graduation rates for
student-athletes are not harmed by higher levels of athletic success and exposure (Rishe, 2003).
However, the analysis does discover a graduation gap between student-athletes and non-athletes
that is sensitive to athletic success, a trend found in all sports except men’s basketball (Rishe,
2003). Furthermore, there is disparity between genders that increases as athletic success
increases, in that women have higher graduation rates and increase their advantage as athletic
success goes up (Rishe, 2003).
Ferris, Finster and McDonald analyzed graduation rates and found several problems with
the comparison of graduation rates alone (2004). The authors note that there is a distinct diversity
among institutions and their missions, student bodies, and other factors that can affect a
graduation rate (Ferris, Finster & McDonald, 2004). Ultimately, the authors found that overall,
student-athletes are graduating at a similar rate to non-athletes in Division I (Ferris, Finster &
McDonald, 2004). Even more impactful, they find that student-athletes who may be a poorer
academic fit for highly selective institutions gain a graduation bump because those institutions
tend to post the highest graduation rate among student-athletes (Ferris, Finster & McDonald,
2004). Therefore, one conclusion is that athletes tend to transfer out of “brand name” or selective
universities less than other schools (Ferris, Finster & McDonald, 2004).
Rivera’s 2004 study of 330 Division I student-athletes intended to identify the key factors
for those student-athletes in their decision-making process to stay in school. The sample
encompassed athletes from 16 different sports and from one large west coast university who took
(Rivera, 2004). Student-athletes identified the quality of their academic and athletic experience
and support networks as the self-perceived most important factors for student-athletes (Rivera,
2004).
Crom, Warren, Clark, Marolla and Gerber published a 2009 study analyzing the effect of
scholarship support, gender, and sport-type on student-athlete retention at a single Division I
conference. The mid-major conference provided data on all student-athletes participating from
2001-2005, resulting in 12, 980 total observations that were analyzed using ANOVA and
regression (Crom et. al., 2009). The analysis concluded that scholarship support alone was not
significantly related to retention of student-athletes (Crom et. al., 2009). However, female
athletes and individual-sport participants were retained at a significantly higher rate than male
athletes and team-sport participants (Crom et. al., 2009). The researchers concluded that the
increased professional opportunity for male athletes over female athletes was one reason that
females were more likely to stay in school (Crom et. al., 2009).
Although not a study analyzing the decision to dropout or transfer, Pascarella, Maury,
Bohr and Terenzini analyzed cognitive outcomes and educational attainment of student-athletes
(1995). The study looked at freshmen from 23 institutions, 18 four-year and five two-year, based
on a selection from a database to represent a wide swath of secondary situations (Pascarella et.
al., 1995). In total, there were 2,416 freshmen respondents to the longitudinal survey (Pascarella
et. al., 1995). The researchers found that, although nonrevenue male athletes and male
non-athletes mirrored each other, men’s basketball and football non-athletes were severely cognitively
disadvantaged in reading comprehension and mathematics (Pascarella et. al., 1995). The same
was true for reading comprehension between all female athletes and female non-athletes
developing a culture surrounding athletics that values gains in these skills (Pascarella et. al.,
1995). As seen in previous research about the decision to leave institutions, the success in
academics can play an important role in students deciding to leave (Spady, 1971; Bean, 1980).
Negatives of Early Recruiting
Many opponents of early recruiting decry the practice based on personal experience with
recruited athletes. There are well-publicized situations where athletes committed before their
junior year and have had successful athletic and academic careers by many standards; at the
same time, the opposite is true. In Division I volleyball, the most obvious negative based on
NCAA regulations is the lack of an official visit, which levels the playing field for recruits who
may be economically disadvantaged and therefore cannot afford traveling on their own to
multiple schools (Kern, 2005).
There is also a belief that the decision-making abilities of a fourteen or fifteen year old
will be drastically different than a seventeen or eighteen year old. A published study by the ACT
organization analyzed the factors that impact career and educational success (2007). The study
notes that people take a linear path towards cognitive development and readiness, meaning that
in regards to many qualities (such as motivation, self-regulation and exploration), humans are
progressing steadily towards benchmarks in those qualities based on time, development and
experience (ACT, 2007). Those factors, such as motivation, also prove to be the greatest
indicators of success in education and the workplace (ACT, 2007).
Abbott and Collins published an article describing best practices for the identification and
development of talent (2004). The authors recommend a sampling stage for young athletes
before engaging in a specialization stage in order to maximize the opportunities for talent
criticism of early recruiting: it also forces early specialization.
Early specialization has recognized benefits and consequences. Wiersma outlines many
of the negative consequences of early specialization in his article published in 2002. Early
specialization in sport can lead to stunted motor skills due to a lack of diversification in activities
(Wiersma, 2000). Further, a single sport can inhibit social and cognitive development because
many parents and athletes use youth sports as an avenue for development (Wiersma, 2000).
Finally, early specialization can cause burnout in athletes, due to repetition from an early age that
may result in injury or overuse (Wiersma, 2000). Although early specialization may help young
athletes eventually reach a higher level of skill, early recruiting prioritizes those athletes that
specialize early at the risk of some of the negative consequences.
Yen recognizes this conundrum and juxtaposes it with the NCAA mission for
student-athlete well-being and education prioritized over athletics (2011). His article outlines the several
arguments against early recruiting, the first being that athletes that are sophomores and younger
will change mentally and physically (Yen, 2011). He also describes the practice of time-bound
scholarship offers, where an athlete feels they cannot take their time to make a decision because
an offer is only on the table for a certain amount of time (Yen, 2011). Ultimately, Yen concludes
that the best option is for the NCAA to permit and regulate many of the current practices.
Research Between Early Recruiting and Transfers
Rich Kern, the proprietor of RichKern.com, where the data set for this study is obtained,
published an original study looking at the relationship between transfers and early commitments
(2007). Kern used a regression analysis to analyze recruits for 2004 and 2005, which amounted
to 2,410 total student-athletes. Kern found that, although some later months showed higher rates
student-athletes that wait (Kern, 2007).
Kern then updated his study in 2011, using information on athletes from 2004-2009 for a
total of 7,106. He concluded that, yet again, the supposed link between early recruiting and
transfers was unsubstantiated at only 8.8% of athletes who committed between 29-48 months
before their enrollment date and then transferred, which is half of that of regular students who
enroll at a four-year institution (Kern, 2011).
Conclusion
The foundational background of this study is rooted in an exploration of the
decision-making process and adolescent development. Researchers have approached the college decision
from multiple angles, analyzing the decision-making process and investigating the important
criteria used in selecting institutions. A similar approach has been used for college students that
chose to transfer or dropout, as studies have attempted to answer both how and why students
make these decisions. Moving forward, this study targets Division I volleyball student-athletes
CHAPTER 3 METHODOLOGY
Coaches, athletes and support networks have decried the recent trends of early recruiting
but have been unable to prove any linkage between early recruiting and negative effects on
student-athletes upon enrollment. This study seeks to test whether early recruiting affects roster
attrition in Division I college volleyball by increasing the likelihood of transfers or dropouts.
Purpose
The purpose of this study is to examine the effect of early recruiting and commitments on
NCAA Division I volleyball roster attrition. This study will analyze the relationship between the
date of a recruit’s verbal commitment and whether or not that athlete remained at their original
school for the complete duration of their college eligibility.
Instrumentation
The data from this study was retrieved from an online database and recruiting registry
maintained at RichKern.com. RickKern.com is a nationally recognized voice in the volleyball
community, providing for a paid subscription access website that catalogs yearly rosters,
recruiting information, game scores and coaching information for all levels of college volleyball.
The website utilizes information submitted by university and athletic sports information
personnel and junior club directors. RichKern.com houses the Rick Kern Point Index (RKPI) and
Credibility, validity, and reliability. The data is considered credible, valid and reliable
based on national prominence and use by all levels of college volleyball and its collection
method (user submission). The data was not modified or changed in any way in order to
complete this study.
Sample
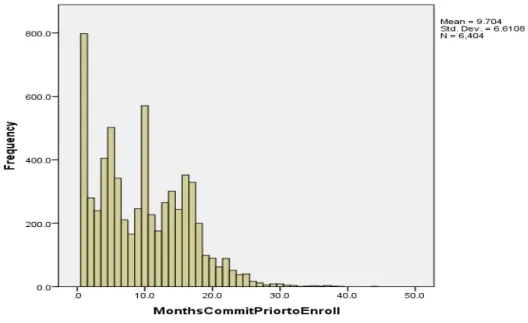
The population for this study was all NCAA Division I volleyball recruits who provided a
verbal commitment to an institution from 2005 to 2010 (N= 6,404). Based on the availability of all recruiting information for this time period, it is assumed that the sample is representative of
all Division I volleyball players from 2005-2010.
Procedures & Data Collection
The data will be retrieved from RichKern.com and sorted into an Excel document based
on the following headers: Player Name, School, Recruiting Class, Months Committed Prior to
Enrollment, Transfer (Y/N), Leave Team (Y/N).
Statistical Analytical Methodology
Once all of the data was collected into an Excel document, the data is transferred into
Statistical Package for Social Sciences (SPSS v.21) and two different statistical procedures will
be conducted. First, a basic regression analysis will be run using Months Committed Prior to
Enrollment as the independent variable, and Transfer or Leave Team (Y/N) as the dependent
variable. A regression analysis will test the relationship between the two variables and explore
the relationship. A regression test will test the statistical significance of changes in the dependent
variable based on changes in the independent variable.
A Chi-Square Test of Independence will also be run against the data to discover if the
Leave Team (Y/N) and Months Committed Prior to Enrollment (Less than 24, 24 or Greater).
The demarcation line of 24 months is chosen because 24 months prior to a student-athlete’s
enrollment would place the commitment before the NCAA regulated traditional recruitment
period. The Chi-Square test will assess whether frequencies observed are statistically significant
CHAPTER 4
RESULTS
This study was designed to test the popular narrative among coaches that early recruiting
is disrupting the retention of student-athletes at the university level. Coaches believe there is a
link between early commitments to an institution and the increasing rate of student-athlete
transfers. The objective of this study is to analyze the relationship between early commitments
and student-athletes that choose to transfer or leave the team before their eligibility has been
completed in Division I volleyball.
Description of Population
The population was drawn from the online recruiting and score website RichKern.com,
with information verified from school media guides. RichKern.com compiles roster, recruiting
and score information for college volleyball in the United States, through a mixture of user
submission and proprietor labor.
The selected population was all Division I volleyball recruits between 2005 and 2010 that
RichKern.com provided a commitment date. The final population number was 6,404
student-athletes who spanned across 327 different institutions. The minimum number of months a
student-athlete in the population committed to an institution was one, while the maximum
number was 44 months. The mean number of months a student-athlete committed before
Graph 4.1: Count of Number of Months Committed Prior to Enrollment
The student-athletes competed between zero and six years at their original institution, and
the mean number of years competed at their original institution was 2.99 years.
Table 4.1: Years Competed at Original School
Frequency Percent Valid Percent Cumulative %
Valid
0 244 3.8 3.8 3.8
1 1174 18.3 18.3 22.1
2 924 14.4 14.4 36.6
3 486 7.6 7.6 44.2
4 3221 50.3 50.3 94.5
5 352 5.5 5.5 100.0
6 3 .0 .0 100.0
Overall, 2,404 student-athletes left the team before completing their eligibility at their
original institution, while 489 student-athletes transferred from their original institution.
Therefore, 45% of student-athletes in the population did not exhaust their eligibility at their
original institution. Graph 4.2 and 4.3 visually represented the distribution of Transfers and
Dropoffs via box plots.
Graph 4.2: Transfer Status Boxplot
In Graph 4.2, the box plot shows the difference between the student-athletes that
transferred and the student-athletes that did not. The mean (black line in the center of the box) is
slightly higher in the group that transferred than those that did not; the maximum and upper
Graph 4.3: Dropoff Status Boxplot
Conversely, Graph 4.3 portrays the student-athletes that left the team before exhausting
their eligibility (as designated by 1). The mean, maximum and upper quartile for student-athletes
that left the team are all lower than those same descriptive statistics for the group that did not
leave the team. However, that category includes student-athletes that transferred and did not
leave the team, so that may influence the rise in those statistics.
Research Question #1
transfer or leave the team versus athletes who wait longer to make a commitment decision?
The study is designed to use two statistical methods to analyze research question #1; one,
a regression analysis, and the second, a Chi-Square test of independence. The regression analysis
will test whether a model where the number of months a student-athlete committed prior to their
enrollment can accurately predict whether or not a student-athlete will transfer or leave the team
(dropoff). The Chi-Square test will analyze a model where the null hypothesis is that the two
variables (months committed and transfer/dropoff) are independent of each other.
Logistic Regression
Since the Transfer and Dropoff variables are dichotomous categorical variables, a binary
logistic regression was the statistical method chosen to analyze the data. In the original data set,
the variables Transfer and Dropoff were coded Yes=0 and No=1. The logistic regression recoded
the values for an internal dichotomy of Yes=0 and No=1. Table 4.2 shows several of the
pertinent results of the regression analysis.
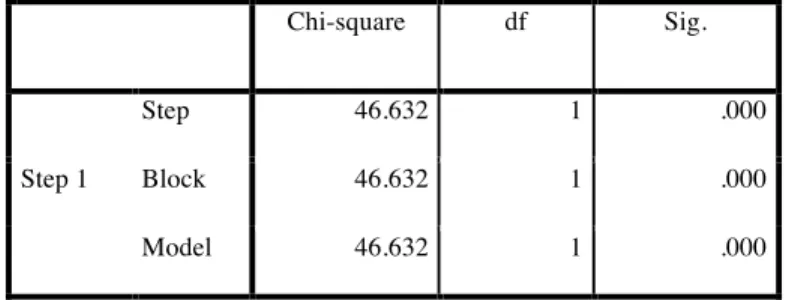
Table 4.2: Omnibus Tests of Model Coefficients: Months Committed x Transfers
Chi-square df Sig.
Step 1
Step 46.632 1 .000
Block 46.632 1 .000
Model 46.632 1 .000
Table 4.2 shows one set of output from the regression model with the months committed
output is that the variables of Months Committed and Transfers are independent, or that there is
no effect on the number of transfers by the number of months committed before enrollment.
Meanwhile, the Sig. column value is the probability of obtaining the previous chi-square statistic
if the null hypothesis, that there is no relationship, is true. In other words, this is the probability
of obtaining this chi-square statistic if there is in fact no effect of the independent variables,
taken together, on the dependent variable. In this case, the model is statistically significant
because the p-value .000, less than the alpha level, and thus the null hypothesis can be rejected.
Table 4.3: Variables in the Equation: Months Committed x Transfers
B S.E. Wald df Sig. Exp(B)
Step 1a
MonthsCommitPriortoEnroll -.048 .007 48.041 1 .000 .953
Constant 3.057 .093 1075.178 1 .000 21.263
In table 4.3, the Wald value is used to test the null hypothesis that the coefficient is 0.
Again, using an alpha level of α = .05, the Wald value is statistically significant and the null
hypothesis can be rejected. Tables 4.4 and 4.5 illustrate the same tests of the model using logistic
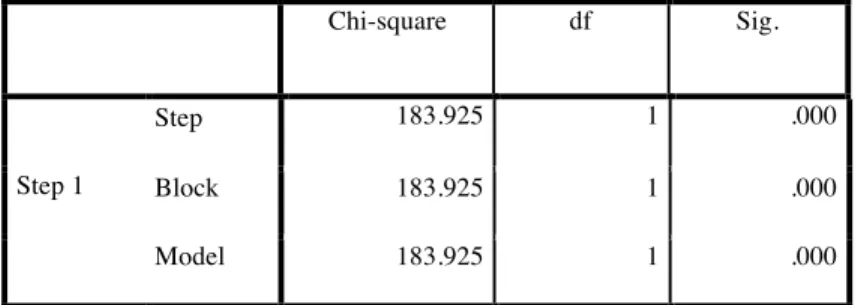
Table 4.4: Omnibus Tests of Model Coefficients: Months Committed x Dropoffs
Table 4.4 now shows one set of output from the regression model with the months
committed as the independent variable, and Dropoffs as the dependent variable. The null
hypothesis for this output is that Months Committed and Dropoffs are independent, or that there
is no effect on dropoffs by the number of months committed before enrollment. The Sig. column
value is .000, which when compared to an alpha level of α = .05 shows the model is statistically
significant because the p-value less than the alpha level, and thus the null hypothesis can be
rejected.
Table 4.5: Variables in the Equation Dropoff*MonthsCommitted
B S.E. Wald df Sig. Exp(B)
Step 1a MonthsCommitPriortoEnroll .055 .004 174.169 1 .000 1.056 Constant -.004 .046 .009 1 .924 .996
In table 4.5, the Wald value is 174.169 with a Sig. value of .000. The B value of .055
indicates that 5.5% of the variance between whether students dropoff or not is based on the
number of months a student-athlete commits prior to enrollment, which is while significant is
still a small number for an effective predictive model. Again, using an alpha level of α = .05, the Wald value is statistically significant and the null hypothesis can be rejected.
In the logistical regression analysis for the Months Committed variable and both Transfer
and Dropoff variables the Omnibus Tests of Model Coefficients provided a chi-square statistic
Chi-square df Sig.
Step 1
Step 183.925 1 .000
Block 183.925 1 .000
Committed as an independent predictor variable. However, for both the Transfer and Dropoff
variables, the logistic regression model was a poor fit based on variability and prediction
capabilities. The models covered only 5.5% of the variance, at best, which means that the
number of months a student-athlete is committed prior to enrollment only predicts a small
number of athletes that chose to transfer or dropoff of their initial team.
Chi-Square Test of Independence
The second statistical method used to analyze the data is a Chi-Square Test of
Independence. Much like the Chi-Square statistic inside the logistic regression, this method is
used to test the relationship between two categorical variables. Therefore, instead of using the
variable Months Committed Prior to Enrollment, it was transformed into a categorical variable
titled Greater24 that had two levels. If a recruit committed less than 24 months before she
enrolled at her institution, the case was a 0; if it was more than 24 months, it was labeled a 1.
This allowed for two categorical variables, each with two levels, to be tested using the selected
method.
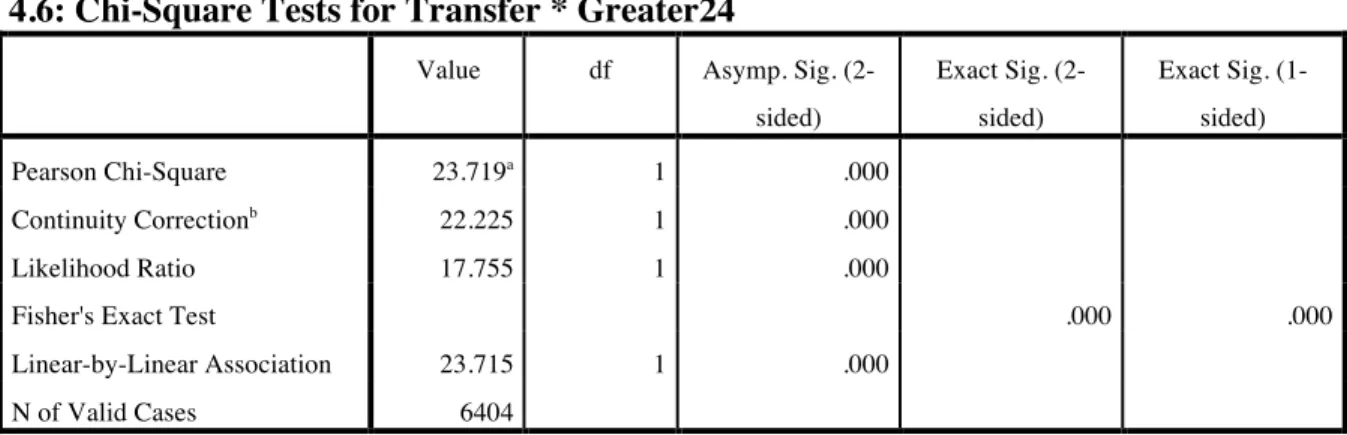
Table 4.7 shows the Chi-Square Test for the same two variables, while table 4.6 shows
the Crosstabulation table for Transfer*Greater24.
4.6: Chi-Square Tests for Transfer * Greater24
Value df Asymp. Sig.
(2-sided)
Exact Sig.
(2-sided)
Exact Sig.
(1-sided)
Pearson Chi-Square 23.719a 1 .000
Continuity Correctionb 22.225 1 .000
Likelihood Ratio 17.755 1 .000
Fisher's Exact Test .000 .000
Linear-by-Linear Association 23.715 1 .000
4.7: Transfer * Greater24 Crosstabulation
Greater24 Total
0 1
Transfer12 0
Count 5810 130 5940
% within Transfer12 97.8% 2.2% 100.0%
% within Greater24 93.0% 82.8% 92.8%
% of Total 90.7% 2.0% 92.8%
Adjusted Residual 4.9 -4.9
1
Count 437 27 464
% within Transfer12 94.2% 5.8% 100.0%
% within Greater24 7.0% 17.2% 7.2%
% of Total 6.8% 0.4% 7.2%
Adjusted Residual -4.9 4.9
Total
Count 6247 157 6404
% within Transfer12 97.5% 2.5% 100.0%
% within Greater24 100.0% 100.0% 100.0%
% of Total 97.5% 2.5% 100.0%
In Table 4.7, it is noticeable that 5.8% of student-athletes transferred who committed
more than 24 months before enrollment, as compared to the 2.2% who committed more than 24
months and did not transfer. Then, analyzing the Chi-Square Test, the Pearson Chi-Square value
is 23.72. The p-value is .000 for the given statistic, meaning that for an alpha level of α = .05, the
test rejects the null hypothesis that the two variables are independent.
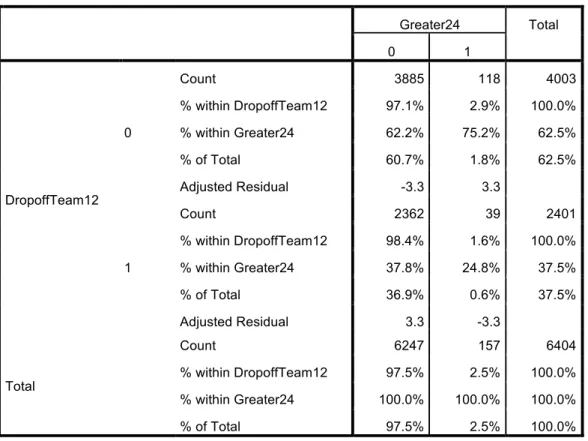
The same procedure is then applied to Dropoff * Greater24, with results in tables 4.8 and
Table 4.8: Dropoff * Greater24 Crosstabulation
Greater24 Total
0 1
DropoffTeam12 0
Count 3885 118 4003
% within DropoffTeam12 97.1% 2.9% 100.0%
% within Greater24 62.2% 75.2% 62.5%
% of Total 60.7% 1.8% 62.5%
Adjusted Residual -3.3 3.3
1
Count 2362 39 2401
% within DropoffTeam12 98.4% 1.6% 100.0%
% within Greater24 37.8% 24.8% 37.5%
% of Total 36.9% 0.6% 37.5%
Adjusted Residual 3.3 -3.3
Total
Count 6247 157 6404
% within DropoffTeam12 97.5% 2.5% 100.0%
% within Greater24 100.0% 100.0% 100.0%
% of Total 97.5% 2.5% 100.0%
4.9: Chi-Square Tests for Dropoff * Greater24
Value df Asymp. Sig.
(2-sided)
Exact Sig.
(2-sided)
Exact Sig.
(1-sided)
Pearson Chi-Square 10.992a 1 .001
Continuity Correctionb 10.446 1 .001
Likelihood Ratio 11.660 1 .001
Fisher's Exact Test .001 .000
Linear-by-Linear Association 10.990 1 .001
N of Valid Cases 6404
Analyzing the Chi-Square Test, the Pearson Chi-Square value is 10.992. The p-value is
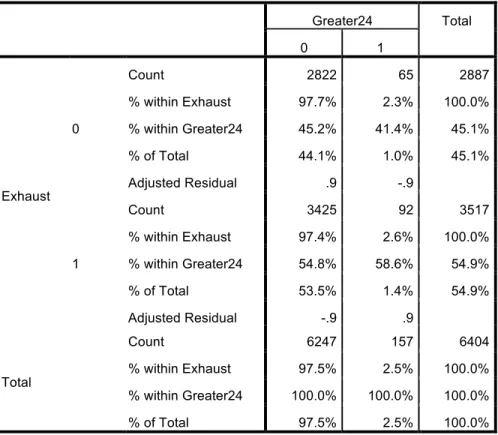
Finally, tables 4.10 and 4.11 give the same statistics for the variable Exhaust * Greater24.
The Exhaust variable is a compilation of student-athletes who transferred and student-athletes
who left their team before exhausting their eligibility, where if a student-athlete transferred or
left the team they are assigned a 0, and if they exhausted their eligibility they received a 1.
Table 4.10: Exhaust * Greater24 Crosstabulation
Greater24 Total
0 1
Exhaust 0
Count 2822 65 2887
% within Exhaust 97.7% 2.3% 100.0%
% within Greater24 45.2% 41.4% 45.1%
% of Total 44.1% 1.0% 45.1%
Adjusted Residual .9 -.9
1
Count 3425 92 3517
% within Exhaust 97.4% 2.6% 100.0%
% within Greater24 54.8% 58.6% 54.9%
% of Total 53.5% 1.4% 54.9%
Adjusted Residual -.9 .9
Total
Count 6247 157 6404
% within Exhaust 97.5% 2.5% 100.0%
% within Greater24 100.0% 100.0% 100.0%
% of Total 97.5% 2.5% 100.0%
Table 4.11: Chi-Square Tests for Exhaust * Greater24
Value df Asymp. Sig.
(2-sided)
Exact Sig.
(2-sided)
Exact Sig.
(1-sided)
Pearson Chi-Square .880a 1 .348
Continuity Correctionb .735 1 .391
Likelihood Ratio .885 1 .347
Fisher's Exact Test .372 .196
Linear-by-Linear Association .880 1 .348
In the data in table 4.10, 97.7% of cases of student-athletes that either transferred or left
the team also had committed to their institution less than 24 months before enrollment, which is
similar to the 97.4% who did not transfer or leave the team but did commit to their institution
less than 24 months before. The number for those that committed more than 24 months is also
extremely close: 2.3% to 2.6%.
As indicated by the close numbers in table 4.10, table 4.11 shows the Pearson Chi-Square
value of .880. The p-value is .348, so with an alpha level of α = .05, we cannot reject the null hypothesis.
The Chi-square Test of Independence, overall, provided similar conundrums to the
logistic regression analysis. Individually, the test for Transfers * Greater24 (table 4.6) and
Dropoffs * Greater24 (table 4.9) both produce a Pearson Chi-square statistic that is significant
and allows us to reject the null hypothesis: that the two tested variables are independent of each
other. However, a third test Exhaust * Greater24 provided a Pearson Chi-square statistic that was
not significant and did not allow us to reject the null hypothesis (table 4.11). Much like the
previous method, the final determination must be that the number of months a student-athlete
commits prior to enrollment has a weak effect on Transfers, Dropoffs and the combined group
CHAPTER 5
DISCUSSION
The NCAA is currently in a period where discussions of student-athlete welfare are at an
all-time high. Similarly, the demands on a coaching staff to lockdown blue-chip recruits in order
to achieve and sustain long-term success are continually rising. One method coaches have turned
to, with controversial results, is recruiting prospective student-athletes younger and younger.
Coaches have spoken out against this practice and linked the rising number of transfers and
dropoffs from their teams as evidence against early recruiting, but little tangible evidence exists
to validate that link. This study provides the first compilation of statistical evidence to help begin
to understand the relationship between early recruiting, transfers and dropoffs and how early
recruiting is impacting student-athletes during an important phase in their lives when they are
selecting and attending an institution.
Implication of Early Recruiting and Student-Athlete Retention
Coaches have pinpointed the practice of early recruiting as detrimental to a
student-athlete’s ability to select the right fit for their college athletics career (Popper, 2014; Richey,
2014) ). This should, in theory, bear out as a significant statistical relationshipbetween the
number of months a student-athlete commits prior to their enrollment with an institution, and
whether or not that student-athlete transfers or leaves the team before exhausting their eligibility.
Predicting Attrition Based on Early Commitments
The two statistical procedures provided interesting information to unpack in regards to
the predictive capabilities of analyzing early commitments. As a variable, the number of months
a student-athlete committed prior to enrollment has a significant relationship according to our
test procedures. However, the significance seems to be, especially in regards to early
commitments ability to round out an effective model that predicts whether or not a
student-athlete will dropoff or leave the team.
In the logistic regression analysis, the model using MonthsCommitted covers only 5.5%
of the variance, at best. The Chi-Square test shows that there is a relationship between the
Transfer and Dropoff variables and Greater24 individually, but that together the affect weakens.
This is further bolstered by the weak predictive element present from the regression analysis.
Therefore, the number of months a student-athlete commits prior to enrollment is a significant
variable, but has a weak impact and needs more factors in a better model.
This make sense given the number of influences students and student-athletes cited in
studies related to college choice decisions and dropout decisions. Day found that student-athletes
chose their institution based on academics and geography; Klenosky, Templin and Troutman
found that the coach and coaching staff were significant factors in a recruits decision (2011;
2001). In a volleyball specific study, Reynaud found that student-athletes were drawn to schools
in their home state and to coaches that acted a certain way in the recruiting process (1998). With
so many verified influential factors, it makes sense that each of these reasons could be an
influential variable.
Similarly, the decision to transfer or dropout has its own set of factors, such as