Pilot clinical study to assess caries
lesion activity using quantitative
light-induced fluorescence during
dehydration
Masatoshi Ando
Andrea G. Ferreira-Zandoná
George J. Eckert
Domenick T. Zero
George K. Stookey
Masatoshi Ando, Andrea G. Ferreira-Zandoná, George J. Eckert, Domenick T. Zero, George K. Stookey,
Pilot clinical study to assess caries lesion activity
using quantitative light-induced fluorescence
during dehydration
Masatoshi Ando,a,* Andrea G. Ferreira-Zandoná,bGeorge J. Eckert,cDomenick T. Zero,aand
George K. Stookeyd
aIndiana University School of Dentistry, Department of Cariology, Operative Dentistry and Dental Public Health, Indianapolis, Indiana,
United States
bUniversity of North Carolina at Chapel Hill, School of Dentistry Department of Operative Dentistry, Chapel Hill, North Carolina, United States cIndiana University School of Medicine, Department of Biostatistics, Indianapolis, Indiana, United States
dTherametric Technologies, Inc., Noblesville, Indiana, United States
Abstract. This study aimed to evaluate the ability of quantitative light-induced fluorescence (QLF) to assess caries lesion activity using visual examination (VE) as the gold standard. Twenty-four visible white spot lesions on buccal surfaces were examined from 23 children, ages 9 to 14 years. At baseline, the surface was hydrated with water, and thereafter, it was dehydrated with continuous compressed air during image acquisition. QLF images were acquired at 0 (baseline), 5, and 15 s. QLF variables [QLFV: fluorescence loss (ΔF), lesion
size (S), ΔQ: ΔF×S] was recorded. Changes-in-QLFV per second (ΔQLFV) were determined: ΔQLFV¼
ðQLFVN−QLFVBaselineÞ∕N, whereN indicates dehydration time. One experienced dentist conducted VE
inde-pendently using a dental unit’s light, compressed air, and explorer. QLFVandΔQLFVof the active group (n¼11)
were compared with those of the inactive group (n¼13) using two-samplet-tests. As the surface was dehy-drated, S andΔQ values of the active group increased, whereas QLFVof the inactive group showed only a small
change.ΔQLFVof the active group were larger than those of the inactive group; however, the difference did not
reach statistical significance (p >0.11). Within the limitations of this study, QLF data indicated increments for lesions designated as active and minimal change for lesions defined as inactive.©2017 Society of Photo-Optical Instrumentation Engineers (SPIE)[DOI:10.1117/1.JBO.22.3.035005]
Keywords: clinical study; caries lesion activity; diagnostics; fluorescence.
Paper 160859R received Dec. 15, 2016; accepted for publication Feb. 21, 2017; published online Mar. 10, 2017.
1
Introduction
Dental caries is a dynamic process during which demineraliza-tion and remineralizademineraliza-tion cycles take place continuously. When the demineralization process continues, it increases surface porosity and creates white spot lesions due to increasing refrac-tive index.1,2Leaving these lesions untreated can lead to cavi-tation. By detecting the early stage of dental caries, such as white spot lesions, it allows to arrest the demineralization proc-ess before surgical treatment is considered and even to gain net mineral. In order to achieve this, early detection and caries activ-ity assessment are critical. In addition to visual methods, several technology-based methods have been introduced.
Quantitative laser- and light-induced fluorescence (QLF) techniques are among the most widely studied methods for detection of early caries. They have been used widely in various in vitro, in situ, andin vivostudies.3–6A study showed both laser and light fluorescence to be useful in detecting and quantifying white spot lesions.4QLF has been used in a controlled clinical trial to show significant differences between fluoride dentifrice treatment regimens in as little as 3 months.6This suggests that the use of QLF in clinical trials may reduce the time necessary to evaluate new therapeutic agents, saving both time and expense. The main advantage of this technique is that it can be used to quantify changes in carious lesions over time.5
Near-infrared (NIR) imaging has been shown to detect and quantify dental caries.7,8Also, both thermal and NIR reflectance imaging have been found to be suitable for the detection of remi-neralization of simulated caries lesions.9 The use of optical coherence tomography (OCT) for caries detection and quantifi-cation has also shown promising results.10,11 Another study reported that polarization-sensitive OCT (PS-OCT) and dehy-dration rate measurements with NIR reflectance and thermal imaging methods were ideally suited for nondestructive, non-invasive, and quantitative measurement of lesion activity.12
Based on chemical analysis and histopathological observa-tions, the initial stage of caries development is characterized by the opening of the intercrystalline spaces without the destruc-tion of the surface and subsequent creadestruc-tion of microchannels.13– 15These microchannels are found to be about 0.5 to1.5μmin width in artificial lesions5and range from 0.2 to1.0μmin width in early natural enamel lesions.16When white spot lesions (the early stage of demineralized enamel) are hydrated/wet, micro-channels in lesions are filled with fluid/water. The presence or absence of water in microchannels affects the amount of light scatter and internal reflection. The difference between the refrac-tive indices of water (1.33) and enamel crystal (1.62) is minimal. Because this difference is small, when the surface is wet (hydrated), there is less scatter and the light path is longer than
when the surface is dry (dehydrated). Light absorption and fluo-rescence remitted per volume is much greater in the hydrated white spot lesions and fluorescence is stronger. This may be the reason white spot lesions may not be readily noticeable when the surface is wet (hydrated). However, when the lesions are dehydrated/dry, air fills the porous areas (intercrystalline spaces). Air has a lower refractive index (nearly 1.0). Differences between the refractive indices of intercrystalline space (air) and enamel crystal increase, hence the amount of light scattering increases. Light absorption and fluorescence remitted per vol-ume is much smaller in the dehydrated white spot lesions and fluorescence is weaker. This may be the reason the white spot lesions are more readily recognized when the surface is dry (dehydrated).
A caries lesion that is progressing (continuing to demineral-ize) is described as an active caries lesion. A lesion that has stopped further progression (stagnant/remineralized) is referred to as an inactive or arrested caries lesion.17There are several reports on the characteristics of caries lesion activity in the literature.18–20A high reliability for assessment of caries lesion activity was shown with criteria based on observations of sur-face appearance and texture.21,22For intact surfaces, active caries lesions were described as presenting a whitish/yellowish opaque enamel surface with a loss of luster and a rough texture when the tip of the probe is moved gently across the surface, whereas inactive caries lesions were described as presenting a shiny enamel surface and a hard and smooth texture.21By definition, active caries lesions must have microchannels (increased poros-ity) that allow biofilm-generated acids to penetrate into the lesion body for caries to progress. On the other hand, inactive lesions should have smaller and/or fewer microchannels, indi-cating the caries process has been reversed or arrested. When lesions are wet, microchannels in active white spot lesions are filled with water and the amount of water is larger than in inac-tive white spot lesions. Inacinac-tive white spot lesions have smaller microchannels relative to active lesions, therefore, they have less water/fluid. As the size and/or number of microchannels increases, the surface porosity increases, thus water/fluid inside the intercrystalline spaces evaporates faster. Therefore, the cen-tral hypothesis of this study was that the rate and amount of vaporization (evaporation) of fluid in the lesion body during dehydration as measured by QLF indicates caries lesion activity. The change-in-QLF variables per second (ΔQLFV) during dehy-dration would show relatively large values due to the presence of wider/longer microchannels and larger amounts of water in the lesion.
Ando et al.23demonstrated in extracted human teeth that dur-ing the first few seconds of dehydration by continuous com-pressed air, change-in-QLF variables per second (ΔQLFV) values for active lesions were larger than those of inactive lesions. This suggests thatΔQLFVduring the first few seconds of dehydration by continuous compressed air may be able to differentiate between active (demineralizing) and inactive (remineralized) caries lesions at the time of examination. To the authors’best knowledge, QLF during dehydration had not been tested clinically to assess caries lesion activity. Therefore, the objective of this clinical pilot study was to determine if changes-in-QLF variables during dehydration could be used to assess caries lesion activity of noncavitated caries lesions (white spot lesions) on the buccal surface in permanent teeth of children in vivo. Accomplishing the specific objective of this pilot clinical study would be of substantial significance
for dental public health. Particularly, this study would evaluate the use of the objective and quantitative QLF during dehydration technique for determination of caries lesion activity at the time of examination. Using an objective and quantitative method (QLF with dehydration) could potentially improve clinical deci-sion-making for more effective caries management.
2
Subjects and Methods
This study protocol was approved by the Indiana University Institutional Review Board (IRB #0105-10). The subject’s parents completed an informed consent medical/dental history and children signed an assent. Upon review and subsequent acceptance into the study, a visual examination (VE) was per-formed on all of the teeth in the mouth. Subjects who had at least one white spot lesion, no severe cavitated caries lesions, no moderate to severe periodontal diseases, and no orthodontic appliances were included. Twenty-three children, ages 9 to 14 years, presented 24 visible white spot lesions on the buccal surface of permanent teeth at the gingival margin for exami-nation. One experienced dentist, trained and calibrated in the International Caries Detection and Assessment System (ICDAS)24 and Nyvad’s criteria,21 independently conducted the VE to assess caries lesion activity using a dental unit’s light and compressed air, with an explorer used only to check surface structure. The examiner utilized the best knowledge from both criteria to assess caries lesion activity using reflection and tactile sensation. Active caries lesions were defined as pre-senting a whitish/yellowish opaque enamel surface with a loss of luster and a rough texture when the tip of the explorer was moved gently across the surface. Inactive caries lesions were defined as presenting a shiny enamel surface and a hard and smooth texture when the tip of the explorer was moved gently across the surface. In order to reduce/eliminate bias, a separate examiner performed an examination using QLF with the dehy-dration technique.
2.1 Quantitative Light-Induced Fluorescence
Examination
Three consecutive fluorescence images per surface were acquired at 0 (baseline), 5, and 15 s with the quantitative light-induced fluorescence system (QLFPatient 3.0.0.35, Inspektor Research Systems B.V., The Netherlands). These intervals between image acquisition were based on the previous in vitrostudy.23The state of hydration of the surfaces was stand-ardized by placing a wet cotton pellet, which was soaked in dis-tilled water, on the buccal surface for 60 s. The QLF camera handpiece was maintained in a position that provided the best illumination of the buccal surface. The subject bit and held a short piece of wooden tongue depressor and the QLF camera handpiece was placed against this to secure the position. During image acquisition while the examiner maintained the QLF camera position, the lesions were dehydrated with continu-ous compressed air by an assistant. After the image acquisition, QLF variables (QLFV) of fluorescence loss [ΔF(%)], lesion size
[S (mm2)], andΔQ:ΔF×S(%×mm2) were determined with proprietary QLF software (QLF 2.00 g, Inspektor Research Systems B.V., The Netherlands). The details of image analysis with QLF software were described previously.10Briefly, a lesion threshold <95%of reconstructed sound fluorescence radiance level was considered to be a caries lesion.
2.2 Data Analyses
Changes-in-QLF variables per second [ΔQLFVN:ΔFVN (%/s), ΔSVN (mm2∕s), ΔQVN (%×mm2∕s)] were determined using
the following equation: QLFVN−QLFVBaselineN , where N indicated dehydration/image acquisition time.
QLFVandΔQLFVvalues were divided into active and
inac-tive white spot lesion groups based on the VE. The averages and standard errors ofQLFVandΔQLFVvalues of each dehydration (image acquisition) time were calculated for the active and inac-tive groups. Comparisons between acinac-tive and inacinac-tive white spot lesions at each dehydration time were performed using 2-sample
t-tests, and comparisons of the measurements during dehydra-tion were made using repeated measures ANOVA. A 5% signifi-cance level was used for all tests. Statistical analyses were performed using SAS version 9.1 (SAS Institute Inc., Cary, North Carolina).
3
Results
Eleven out of 24 sites were designated as active status according to VE, and 13 sites were designated as inactive status. Figure1
shows examples of fluorescence images of both active and inac-tive groups at 0, 5, and 15 s of dehydration. Caries lesions appeared darker than sound area. As dehydration time increased, active caries lesion got darker. On the other hand, inactive caries lesion did not get darker. Figure2displays the average and stan-dard error of fluorescence loss. Although there were no sta-tistically significant differences between groups (0 s:p¼0.16, 5 s: p¼0.09, 15 s: p¼0.14) or among dehydration times (active: 0 s versus 5 s: p¼0.92, 0 s versus 15 s: p¼0.59, 5 s versus 15 s: p¼0.53; inactive: 0 s versus 5 s: p¼0.44,
0 s versus 15 s:p¼0.82, 5 s versus 15 s: p¼0.35), more loss of fluorescence was observed in the active lesions. How-ever, dehydration for either 5 or 15 s did not alter the amount of fluorescence loss for either type of lesion.
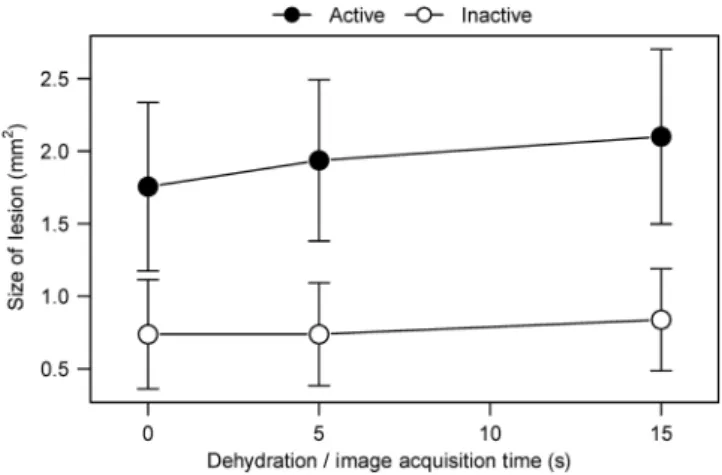
Figure3similarly presents the effect of dehydration on the size of the lesions as assessed by QLF. While again there were no statistically significant differences between groups (0 s:
p¼0.14, 5 s:p¼0.07, 15 s:p¼0.07) or among dehydration times (active: 0 s versus 5 s:p¼0.22, 0 s versus 15 s:p¼0.08, 5 s versus 15 s:p¼0.25; inactive: 0 s versus 5 s:p¼1.00, 0 s versus 15 s:p¼0.40, 5 s versus 15 s:p¼0.40), active lesions were observed to be larger in size (mm2). Dehydration did not have obvious influence on apparent lesion size for the inactive lesions, but an apparent increase in lesion size was observed for active lesions following dehydration.
Figure4 shows the impact of dehydration on the volume (ΔQ) of active and inactive lesions. There were no statistically significant differences between groups (0 s: p¼0.22, 5 s:
p¼0.11, 15 s:p¼0.12) or among dehydration times (active: 0 s versus 5 s:p¼0.41, 0 s versus 15 s:p¼0.11, 5 s versus 15 s:p¼0.22; inactive: 0 s versus 5 s:p¼0.57, 0 s versus 15 s:p¼1.00, 5 s versus 15 s:p¼0.56). Influenced by the results for lesion size, dehydration had little effect on the volume (ΔQ) of inactive lesions but was increased slightly in active Activity
status
Dehydration / image acquisition time (s)
0 (Baseline) 5 15
Active
Inactive
Fig. 1 Example of fluorescence images of both active and inactive groups at 0 (baseline), 5, and 15 s of dehydration.
Fig. 2 Average and standard error of fluorescence loss for active and inactive groups. There were no significant differences between groups or among dehydration times (p >0.05).
Fig. 3 Average and standard error of size of lesion for active and inac-tive groups. There were no significant differences between groups or among dehydration times (p >0.05).
lesions. This was in contrast to theQLFD of inactive lesions, which showed minimal change during dehydration.
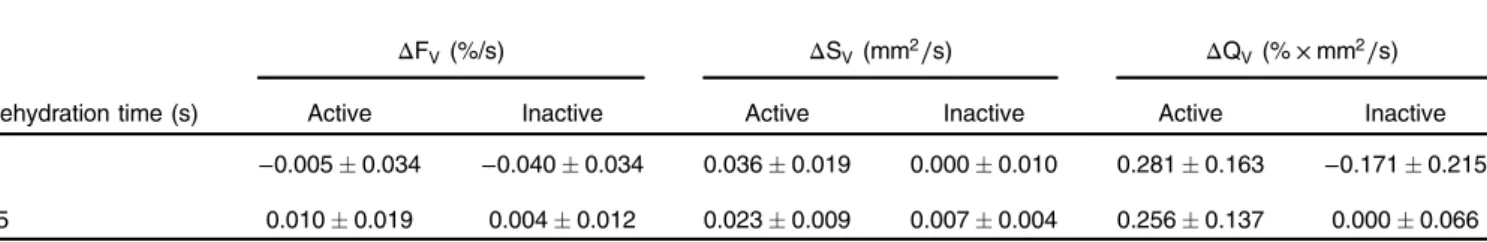
Table 1 presents the average and standard error of the changes-in-QLF variables per second (ΔQLFV) for the active and inactive groups. AlthoughΔQLFVvalues of active lesions were larger than those of inactive lesions, the differences between groups did not reach statistical significance (5 sΔFV:
p¼0.49, 5 sΔSV:p¼0.11, 5 sΔQV:p¼0.12, 15 sΔFV:
p¼0.78, 15 sΔSV:p¼0.11, 15 sΔQV:p¼0.12).
To explore how the measurements fared as a diagnostic test, a cut-off value for the change-in-ΔQ per second (ΔQV) was selected atΔQV¼1.2. With this cut-off, sensitivity was 100%, specificity was 62%, positive predictive value was 69%, and negative predictive value was 100%. Given the small sample size in this study, this may not be the optimal cut-off; however, it does show that the method has relevance as a possible method to identify activity.
4
Discussion
In the postfluoride era, progression of enamel caries is slower, and it takes longer before the stage of irreversible destruction of the tooth is reached (cavitation).25With new assessment meth-ods, such as QLF, caries detection is possible at an earlier stage than could be performed previously. This is very important for carrying out timely and appropriate preventive measures. How-ever, as caries is an arrestable and reversible process in its early stages, identification of only the severity of caries lesions, such as lesion size and depth, is insufficient. We know some of these lesions will be active and, therefore, in need of some form of intervention, while others may be a scar of past damage (inac-tive/arrested) and, therefore, will not require any intervention. In order to select an appropriate treatment modality and aid in the clinical decision-making process, caries diagnosis and assess-ment of caries lesion activity are of critical importance. Incorrect diagnosis can easily result in incorrect treatment deci-sions, particularly with respect to irreversible treatments (i.e., restorations).
The key feature that allows QLF imaging to differentiate between active and inactive lesions is based on their differences in the surface structure, specifically the porosity of the surface layer. As mentioned previously, active lesions may present a porous surface layer and inactive lesions may have a relatively nonporous surface layer. The porosity depends on the number and size of microchannels. A study using scanning electron microscopy indicated that microchannels developed at caries initiation and increased in size with continued demineraliza-tion.26As the size and/or number of microchannels increases, the surface porosity increases. On the other hand, inactive lesions should have fewer and narrower microchannels. This implies that the surface porosity decreases. For active caries lesions, based on our hypothesis, theQLFVandΔQLFVduring
dehydration would show relatively large values, due to the pres-ence of wider/longer microchannels, and larger amounts of water in the lesion. On the other hand, for inactive caries lesions, QLFVandΔQLFVwould show much lower values during
dehy-dration, due to the presence of smaller and fewer microchannels, and thus a negligible amount of water in the lesion.
In this pilot clinical study, although not reaching statistical significance, the results appear to support our hypothesis by indicating there was a trend forΔQof active lesions to increase as the surface was dehydrated, leading to higher change-in-ΔQ (ΔQV) for active lesions than for inactive lesions. A poststudy power analysis was performed to evaluate the role of the small sample size on the lack of statistical significance for this study. The observed differences inΔQVwere 0.45 and 0.25 at 5 and 15 s of dehydration, respectively. A study withn¼42per group would have 80% power at a 5% significance level to detect the ΔQV differences we observed. Therefore, this pilot clinical
study suggests that QLF imaging of caries lesions undergoing dehydration can be used to differentiate caries lesion activity. This is advantageous as it can be done at the time of examina-tion, and information can be obtained in a single appointment. However, further investigations are needed to determine the ΔQVthreshold to differentiate active and inactive caries lesions.
There were two other studies of fluorescence imaging with dehydration that may be relevant to this study. Al-Khateeb et al.27indicated that dehydration data could serve as a separate method for analyzing pore distribution properties in lesions to differentiate history of deremineralization or fluoride treatment. van der Veen et al.28demonstrated the potential to use fluores-cence imaging with dehydration to determine caries lesion activ-ity. For both studies, dehydration was done by allowing the specimens to dry at room temperature rather than using continu-ous compressed air. These studies may not be directly applicable to a clinical setting. Clinically another study has demonstrated that lesions which progress to cavitation (active) present faster changes inQLFVthan inactive lesions.5Another clinical study, using a different laser fluorescence device (LF: this consists of a 655-nm emitted diode laser) with occlusal caries, demonstrated that after air drying for 3 and 15 s, LF values of active caries, in which caries activity was determined by VE, presented higher than those of inactive caries.29
There were also studies regarding the dehydration effect using OCT. For one study, dehydration was induced by the spec-imens in air at room temperature for 30 min. The results showed that hydration state affects the reflectivity of demineralized porous enamel, and the effect can be potentially used for assess-ment of early enamel lesion using OCT.30For another study, dehydration was produced in a controlled environment for 30 s. The air pressure was set to 15 psi, and the computer-controlled air nozzle was positioned 2 cm away from the sample.31Although bovine dentin and extracted human root caries were used,
Table 1 Meansstandard error of the mean for change-in-QLF variables per second for active and inactive groups. The differences between groups were not statistically significant (p >0.05).
ΔFV(%/s) ΔSV(mm2∕s) ΔQV(%×mm2∕s)
Dehydration time (s) Active Inactive Active Inactive Active Inactive
5 −0.0050.034 −0.0400.034 0.0360.019 0.0000.010 0.2810.163 −0.1710.215
thermal imaging and PS-OCT may be ideally suited for the non-destructive root caries lesion activity during a clinical examina-tion. Therefore, these studies and this study suggested that the state of hydration in the lesion body can be used to quantify severity of dental caries and caries lesion activity.
For this proof-of-concept study, we intended to demonstrate that QLF data could indicate increments for lesions designated as active and minimal change for lesions defined as inactive. Hence, the design of this study was small sample size and cross sectional proof-of-concept pilot study. VE was employed as the gold standard. The examiner for VE in this study is trained and calibrated with ICDAS24 and Nyvad’s criteria21 and is expert in caries detection and diagnosis. Previous studies dem-onstrated that both criteria could predict lesion depth and assess caries lesion activity.21,22,24,32–34Although not reaching statisti-cal significance, this small, pilot clinistatisti-cal study provided prelimi-nary information to establish the use of the QLF method. Further clinical investigations to establish threshold or cut-off values to distinguish among the lesion stages and a larger sample size for clinical application will be necessary.
5
Conclusion
The results of this small, pilot clinical study suggest that QLF data, especiallyΔQ, indicated slight increments for lesions des-ignated as active and minute changes for lesions defined as inac-tive. Furthermore, change-in-ΔQ per second (ΔQV) of active lesions was greater than that of inactive lesions. Therefore, QLF during dehydration has the potential to assess caries lesion activity of noncavitated caries lesions (white spot lesions) on smooth surfacein vivoat the time of examination.
Disclosures
George K. Stookey is the owner of Therametric Technologies, Inc.; he has an interest in the use of fluorescence for early caries detection, but no financial interest in QLF. The other authors declare no conflict of interest.
Acknowledgments
This study was supported by the 21st Century Research and Technology Fund from the State of Indiana, USA. The funder had no role in study design, data collection and analysis, deci-sion to publish, or preparation of the paper.
References
1. Z. Meng et al.,“Measurement of the refractive index of human teeth by optical coherence tomography,”J. Biomed. Opt.14(3), 034010 (2009). 2. I. Hariri et al.,“Estimation of the enamel and dentin mineral content
from the refractive index,”Caries Res.47(1), 18–26 (2013). 3. S. Al-Khateeb et al.,“Laser fluorescence quantification of
reminerali-zation in situ of incipient enamel lesions: influence of fluoride supple-ments,”Caries Res.31(2), 132–140 (1997).
4. M. Ando et al.,“Comparative study to quantify demineralized enamel in deciduous and permanent teeth using laser- and light-induced fluores-cence techniques,”Caries Res.35(6), 464–470 (2001).
5. A. F. Zandoná et al.,“Longitudinal analyses of early lesions by fluo-rescence: an observational study,” J. Dent. Res. 92(S1), S84–S89 (2013).
6. M. Kambara et al.,“Results of clinical trial of fluoride dentifrices using QLF,”in Early Detection of Dental Caries III, G. K. Stookey, Ed., pp. 229–235, Indiana University School of Dentistry, Indianapolis, Indiana (2003).
7. C. Zakian, I. Pretty, and R. Ellwood,“Near-infrared hyperspectral im-aging of teeth for dental caries detection,” J. Biomed. Opt. 14(6), 064047 (2009).
8. S. Salsone et al.,“Histological validation of near-infrared reflectance multispectral imaging technique for caries detection and quantification,” J. Biomed. Opt.17(7), 076009 (2012).
9. R. C. Lee, C. L. Darling, and D. Fried,“Assessment of remineralization via measurement of dehydration rates with thermal and near-IR reflec-tance imaging,”J. Dent.43(8), 1032–1042 (2015).
10. T. Ueno et al.,“Optical analysis of enamel and dentin caries in relation to mineral density using swept-source optical coherence tomography,” J. Med. Imaging3(3), 035507 (2016).
11. A. M. Maja et al.,“Evaluation of dental enamel caries assessment using quantitative light induced fluorescence and optical coherence tomogra-phy,”J. Biophotonics9(6), 596–602 (2016).
12. R. C. Lee et al.,“Infrared methods for assessment of the activity of natu-ral enamel caries lesions,”IEEE J. Sel. Top. Quantum Electron.22(3), 6803609 (2016).
13. M. Goldberg et al.,“Microchannels in the surface zone of artificially produced caries-like enamel lesions,”J. Biol. Buccale9(3), 297–314 (1981).
14. J. D. B. Featherstone et al.,“Chemical and histological changes during development of artificial caries,”Caries Res.19(1), 1–10 (1985). 15. L. Holmen et al.,“A scanning electron microscopy study of surface
changes during development of artificial caries,” Caries Res. 19(1), 11–21 (1985).
16. R. M. Frank and A. Brendel,“Ultrastructure of the approximal dental plaque and the underlying normal and carious enamel,”Arch. Oral Biol. 11(9), 883–912 (1966).
17. O. Fejerskov, B. Nyvad, and E. A. M. Kidd,“Clinical and histological manifestations of dental caries,”inDental Caries The Disease and its Clinical Management, O. Fejerskov and E. A. M. Kidd, Eds., pp. 71–98, Blackwell, Munksgaard, Oxford (2003).
18. L. Holmen, A. Thylstrup, and J. Årtun,“Surface changes during the arrest of active enamel carious lesions in vivo: a scanning electron microscopy,”Acta Odontologica Scandinavica45(6), 383–390 (1984). 19. A. Thylstrup, C. Bruun, and L. Holman,“In vivo caries models: mech-anisms for caries initiation and arrestment,”Adv. Dent. Res.8(2), 144– 157 (1994).
20. B. ten Cate,“The role of saliva in mineral equilibria–caries, erosion and calculus formation,” inSaliva and Oral Health, 3rd ed., M. Edgar, C. Dawes, and D. O’Mullane, Eds., pp. 120–135, British Dental Association, London (2004).
21. B. Nyvad, V. Machiulskiene, and V. Baelum,“Reliability of a new caries diagnostic system differentiating between active and inactive caries lesions,”Caries Res.33(4), 252–260 (1999).
22. B. Nyvad, V. Machiulskiene, and V. Baelum,“Construct and predictive validity of clinical caries diagnostic criteria assessing lesion activity,” J. Dent. Res.82(2), 117–122 (2003).
23. M. Ando, G. K. Stookey, and D. T. Zero,“Ability of quantitative light-induced fluorescence (QLF) to assess the activity of white-spot lesions during dehydration,”Am. J. Dent.19(1), 15–18 (2006).
24. A. I. Ismail et al.,“Reliability of the international caries detection and assessment system (ICDAS): an integrated system for measuring dental caries,”Community Dent. Oral Epidemiol.35(3), 170–178 (2007). 25. E. Newbrun,“Preventing dental caries: current and prospective
strate-gies,”J. Am. Dent. Assoc.123(5), 68–73 (1992).
26. M. Ando et al.,“Characteristics of early stage of enamel demineraliza-tion in vitro,”inEarly Detection of Dental Caries III, G. K. Stookey, Eds., pp. 363–373, Indiana University School of Dentistry, Indianapolis, Indiana (2003).
27. S. Al-Khateeb et al.,“Light-induced fluorescence studies on dehydra-tion of incipient enamel lesions,”Caries Res.36(1), 25–30 (2002). 28. M. H. van der Veen, E. de Josselin de Jong, and S. Al-Khateeb,“Caries
activity detection by dehydration with quantitative light fluorescence,” inEarly Detection of Dental Caries II, G. K. Stookey, Ed., pp. 251–259, Indiana University School of Dentistry, Indianapolis, Indiana (1999). 29. M. Braga et al.,“New methodology to assess activity status of occlusal
caries in primary teeth using laser fluorescence device,”J. Biomed. Opt. 15(4), 047005 (2010).
30. A. Nazari et al.,“Effect of hydration on assessment of early enamel lesion using swept-source optical coherence tomography,”J. Biophotonics 6(2), 171–177 (2013).
32. L. Shoaib et al.,“Validity and reproducibility of ICDAS II in primary teeth,”Caries Res.43(6), 442–448 (2009).
33. M. C. Séllos and V. M. Soviero,“Reliability of the Nyvad criteria for caries assessment in primary teeth,”Eur. J. Oral Sci.119(3), 225–231 (2011).
34. R. S. Guedes et al.,“Validation of visual caries activity assessment: a 2-yr cohort study,”J. Dent. Res.93(7 Suppl.), 101S–107S (2014).
Masatoshi Ando is an associate professor in the Department of Cariology, Operative Dentistry, and Dental Public Health at Indiana University School of Dentistry. His main focus is to develop an objec-tive and quantitaobjec-tive means to measure caries lesion activity. He has extensive experience in the application of QLF and histological vali-dation of lesions, using such techniques as microfocus computed tomography, transverse microradiography, optical reflecmetry, optical surface profilometry, and confocal laser scanning microscopy.
Andrea G. Ferreira-Zandoná is an associate professor of the Department of Operative Dentistry, University of North Carolina at Chapel Hill, School of Dentistry.
George J. Eckertis a biostatistician supervisor of the Department of Biostatistics, Indiana University School of Medicine.
Domenick T. Zerois a professor of the Department of Cariology, Operative Dentistry, and Dental Public Health at Indiana University School of Dentistry.
George K. Stookey is a chief executive officer and president of Therametric Technologies, Inc., and a distinguished professor emeri-tus at Indiana University.