Resource
Comprehensive and Integrated Genomic
Characterization of Adult Soft Tissue Sarcomas
Graphical Abstract
Highlights
d
Multiplatform genetic analysis of 206 sarcomas of 6 types
shows their diversity
d
Sarcomas harbor many more copy-number alterations than
most other cancer types
d
Inferred immune microenvironment associates with
outcome in multiple sarcoma types
d
Computed histologic nuclear pleomorphism correlates with
aneuploidy estimates
Authors
The Cancer Genome Atlas Research
Network
Correspondence
[email protected]
(Elizabeth G. Demicco),
[email protected] (Li Ding),
[email protected] (Marc Ladanyi),
[email protected]
(Alexander
J.
Lazar),
[email protected] (Samuel Singer)
In Brief
Genetic analysis of soft tissue sarcomas
shows that they are characterized
predominantly by copy-number changes
and offers insights into the immune
microenviroment to inform clinical trials
of checkpoint inhibitors.
# CNVs
# Mutations
other cancers
Undifferentiated Pleomorphic Sarcoma
Myxofibrosarcoma Dedifferentiated Liposarcoma
Leiomyosarcoma
Molecular spectrum ↑17p11.2~p12
↑methylation ↑inflam. score↓methylation
MFS
MFS UPS
Methylation predicts survival UPS
Uterine LMS
poor prognosis
Soft tissue LMS
STLMS C1
poor prognosis
STLMS C2
good prognosis
hyper-methylated hypo-methylated
LMS DDLPS
Analysis on 7 platforms & integration of data Few mutations,
many CNVs Nuclear features predictgenomic states
Nuclear size variance
Aneuploidy
UPS MFS SS MPNST
206 sarcomas
The Cancer Genome Atlas Research Network, 2017, Cell171, 950–965
November 2, 2017ª2017 The Authors. Published by Elsevier Inc.
Resource
Comprehensive and Integrated Genomic
Characterization of Adult Soft Tissue Sarcomas
The Cancer Genome Atlas Research Network1,2,*
1Cancer Genome Atlas Program Office, National Cancer Institute at NIH, 31 Center Drive, Bldg. 31, Suite 3A20, Bethesda, MD 20892, USA 2Lead Contact (Alexander J. Lazar)
*Correspondence:[email protected](Elizabeth G. Demicco),[email protected](Li Ding),[email protected] (Marc Ladanyi),[email protected](Alexander J. Lazar),[email protected](Samuel Singer)
https://doi.org/10.1016/j.cell.2017.10.014
SUMMARY
Sarcomas are a broad family of mesenchymal
malig-nancies exhibiting remarkable histologic diversity.
We describe the multi-platform molecular landscape
of 206 adult soft tissue sarcomas representing 6
major types. Along with novel insights into the
biology of individual sarcoma types, we report
three overarching findings: (1) unlike most epithelial
malignancies, these sarcomas (excepting synovial
sarcoma) are characterized predominantly by
copy-number changes, with low mutational loads and
only a few genes (
TP53
,
ATRX
,
RB1
) highly
recur-rently mutated across sarcoma types; (2) within
sar-coma types, genomic and regulomic diversity of
driver pathways defines molecular subtypes
associ-ated with patient outcome; and (3) the immune
microenvironment, inferred from DNA methylation
and mRNA profiles, associates with outcome and
may inform clinical trials of immune checkpoint
inhibitors. Overall, this large-scale analysis reveals
previously
unappreciated
sarcoma-type-specific
changes in copy number, methylation, RNA, and
pro-tein, providing insights into refining sarcoma therapy
and relationships to other cancer types.
INTRODUCTION
Adult soft tissue sarcomas (henceforth referred to collectively as sarcomas) are diverse mesenchymal malignancies that account for1% of adult solid tumors. Many are highly aggressive, ac-counting for a disproportionate share of cancer mortality among young adults (ages 20–39, in SEER data,https://seer.cancer. gov). Sarcomas are typically classified according to the normal mesenchymal tissue they most resemble. They comprise more than 70 types that differ in pathologic and clinical features. Sar-comas fall into two broad genetic groups: those with simple kar-yotypes harboring specific genetic alterations (translocations, activating mutations) and those with complex karyotypes (Taylor et al., 2011a). For The Cancer Genome Atlas (TCGA) sarcoma analysis, we focused on 6 major adult soft tissue sarcomas, including 5 with complex karyotypes: (1) dedifferentiated liposar-coma (DDLPS), an undifferentiated sarliposar-coma usually arising in
as-sociation with well-differentiated liposarcoma and characterized by 12q1315 amplification; (2) Leiomyosarcoma (LMS), showing smooth muscle differentiation, arising in both gynecologic (ULMS) and soft tissue (STLMS) sites; (3) undifferentiated pleomorphic sarcoma (UPS), lacking any defined line of differen-tiation; (4) myxofibrosarcoma (MFS), showing fibroblastic differ-entiation with myxoid stroma; (5) malignant peripheral nerve sheath tumor (MPNST), which arises in peripheral nerves. The sixth type was a simple-karyotype sarcoma, synovial sarcoma (SS), defined by the translocation t(X;18)(p11;q11). We inte-grated genome-scale analyses of mRNA, microRNA (miRNA), protein, and alterations of DNA sequence, methylation, and copy number to understand the genomic diversity of oncogenic drivers, to refine clinical risk stratification, and to identify poten-tial therapeutic targets.
RESULTS AND DISCUSSION
Samples and Clinicopathologic Data
We studied 206 sarcomas with diagnoses confirmed by expert pathology review: 80 LMS (53 STLMS and 27 ULMS), 50 DDLPS, 44 UPS, 17 MFS, 10 SS, and 5 MPNST (Figures 1A andS1A). Clin-ical and pathologic data are summarized inFigure 1A andTable S1. The median age at diagnosis was 60 years (range 20–90). Sarcomas were mostly intermediate to high grade (93%) and 84% arose in deep soft tissue (or uterine and visceral sites).
Pan-sarcoma Molecular Analysis
Adult Soft Tissue Sarcomas Harbor Frequent Copy-Number Alterations
Mutational profiles and genomic alterations in the 6 sarcoma types are summarized inFigure 1A andTable S1. Unsupervised cluster analysis of somatic copy-number alterations (SCNAs) divided cases into 6 major clusters; C2 with relatively few unbal-anced segments, consisting mostly of DDLPS and SS; C3, con-sisting mostly of DDLPS with complex copy-number alterations; C4 and C5, dominated by LMS; and C1 and C6 consisting mostly of UPS and MFS (Figure S1B).
SCNAs frequently affected the MDM2-p53 and the p16-CDK4-RB1 pathways. MDM2amplification was present in all DDLPS by definition, and deep deletions (as defined in the
STAR Methods) of TP53 were found in 9% of LMS, 16% of UPS, and 12% of MFS. In the RB pathway, deep deletions of
RB1 were detected in 14% of LMS, 16% of UPS, and 24%
0 2 4 Mutations per Mb
non synonymous value off scale synonymous 0 50 100 Mutation signature *CpG->T *Cp(A/C/T)->T C->(G/A) A->G A->(T/C) Gender FNCLCC grade Genome Doublings Tumor Site Histology TP53
33.5 10.4 4.4 9.0
ATRX RB1 0 20 40 60 # mutations Mutations MDM2 12q15 FRS2 12q15 CDK4 12q14.1 HMGA2 12q14.3 MYOCD 17p11.2 CCNE1 19q12 UST 6q25.1 JUN 1p32.1 MAP3K5 6q23.3 VGLL3 3p12.1 DDIT3 12q13.3 TERT 5p15.2 YAP1 11q22.2 # SCNAs No Change Gain Amplification Copy Number Gains
RB1 13q14.2 TP53 17p13.1 PTEN 10q23.31 HDLBP 2q37.3 CDKN2A 9p21.3 CSMD1 8p23.2 NF1 17q11.2 ATRX Xq21.1
# SCNAs 100 50 0
No Change Deep Deletion Shallow Deletion Copy Number Losses
iCluster C1 C2 C3 C4 C5 >600 451-600 A FDR < 1e-22 < 1e-22 < 1e-22 150 0 50 extremity/trunk/chest wall/head&neck intra-abdominal/visceral/pelvic/ intra-thoracic F M 3 2 1
0 1 2 NA
No Mutation Synonymous In-frame Indel Other Non Syn
Missense Splice Site Frameshift Nonsense Myxofibrosarcoma
Undifferentiated Pleomorphic Sarcoma Malignant Peripheral Nerve Sheath Tumor Dedifferentiated Liposarcoma
Gynecologic Leiomyosarcoma Soft Tissue Leiomyosarcoma Synovial Sarcoma
Histology Mutation
unbalanced
segments ≤150 151-300
ACC BLCA BRCA CESC CHOL COAD DDLPS DLBC ESCA GBM HNSC KICH KIRC KIRP LAML LGG LIHC LUAD LUSC MFS MPNST OV PAAD PCPG PRAD READ SKCM SS STAD STLMS TGCT THCA THYM UCEC UCS ULMS UPS UVM 0 100 200 300 400
0 100 200 300 400
Median Number of Unbalanced Segments
Median Number of Nonsynonymous Somatic Mutations
High levels of CNAs, High levels of mutations
Low levels of CNAs,
Low levels of mutations High Low levels of mutationslevels of CNAs,
Low levels of CNAs,
High levels of mutations B
301-450
LMS, 20% of UPS, and 18% of MFS. RB pathway alterations in DDLPS includedCDK4amplification in 86% andCDKN2Adeep deletion in 2%. Overall, the complex karyotype sarcomas were characterized by frequent SCNAs compared to most other TCGA tumor types (Figures 1B,S1C, and S1D). DDLPS showed the highest frequency of SCNAs of any tumor type, due to its highly recurrent focal amplifications at 12q1315. In contrast, SS displayed very few SCNAs or mutations.
Analyses for fusion transcripts identified eitherSS18-SSX1or SS18-SSX2fusions in all SS cases. We also found recurrent fu-sions ofTRIOtoTERT(n = 3) or to other genes (n = 2) (Figure 1A), as recently reported (Delespaul et al., 2017). Cases with TRIO-TERTfusions had the highest TERT expression across all sar-comas (Figure S1E).
Adult Soft Tissue Sarcomas Have Low Somatic Mutation Burdens
The overall somatic mutation burden in these 206 sarcomas was low (average 1.06 per Mb;Figures 1A, 1B,S1D, andS2A). We applied MuSiC analysis (Dees et al., 2012) to whole-exome sequencing (WES) data to identify significantly mutated genes (SMGs), i.e., genes with a statistically higher-than-expected mu-tation prevalence across the entire cohort (false discovery rate [FDR] <0.05). This identified only 3 SMGs:TP53,ATRX, and RB1(Figure 1A).TP53 mutations were most prevalent in LMS (40 of 80).RB1mutations were seen in LMS, UPS, and MFS.
We surveyed known cancer genes for potential driver muta-tions and found that 138 sarcomas (67%) contained at least one variant in a gene known to be involved in cancer progres-sion, although few of these were in known cancer hotspots ( Fig-ure 2A). Potentially functional mutations included truncating mutations inNF1(n = 3),NF2(1), andPRKDC(4), a gene involved in telomere stabilization and critical for double-strand break repair (Figure 2B). AsATRX,TP53, andPRKDCmutations may disrupt telomere maintenance, we inferred telomere lengths from WES data using TelSeq (Ding et al., 2014). Outlier analysis identified telomere lengthening in 24 cases, mostly LMS and UPS/MFS (Table S2), with no association withTP53orPRKDC mutation. In UPS/MFS, long telomeres were associated with ATRX deletion or mutation (p = 0.013), as recently reported (Liau et al., 2015).
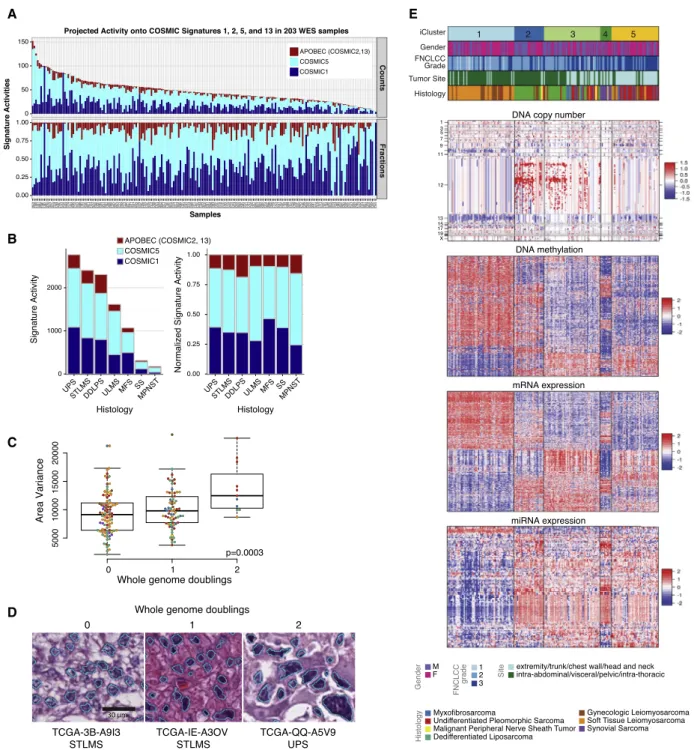
Assessment of mutational processes in samples with low mutation burden is a significant challenge. To alleviate this limi-tation, we used a two-step procedure. First we used de novo signature discovery in 205 WES and 37 whole-genome sequencing (WGS) samples to identify the mutational processes in the cohort (Figure S2B). This process identified predominant signatures similar to COSMIC 1, 3, 5, and 13 (http://cancer. sanger.ac.uk/cosmic/signatures), with the exception of the two tumors with the highest mutational burden, in which the
COSMIC6 mismatch repair signature predominated (Figure S2B), and that respectively showed frameshift mutation inMSH6and low MSH2 expression (Figure S2C). The second step used established COSMIC signature profiles 1, 3, 5, and 13 to quantify the mutational signatures in the WES data (Figure 3A). Of the mutations, 90% were attributable to COSMIC5 (53%) and COSMIC1 (37%). COSMIC2 and 13 (evidence of APOBEC mutagenesis) were modestly elevated in DDLPS and MPNST compared to other types (p < 106by Kruskal-Wallis;Figure 3B). COSMIC1 and COSMIC5 are clock-like mutational processes, occurring continuously over a patient’s lifetime (Alexandrov et al., 2015), and we found their contributions to the mutational profiles to be correlated with age at diagnosis in DDLPS (Pear-son correlation 0.38, p = 0.006), MFS (Pear(Pear-son correlation 0.52, p = 0.04), and STLMS (Pearson correlation 0.43, p = 0.001;Figure S2D). Thus, sarcomas have a low mutation burden, and the mutations present in some sarcomas predomi-nately reflect age-related C > T mutations at CpG dinucleotides, likely representing passenger mutations.
Genomic Correlates of Computational Morphometrics To determine if genomic complexity is reflected in nuclear pleo-morphism (i.e., highly variable nuclear area), a common feature of complex karyotype sarcomas, we used automated computa-tional analysis of whole-slide digital pathology images, to calcu-late a nuclear pleomorphism score as the variance of nuclear area for each patient (Figure S2E). Increased nuclear pleomor-phism correlated significantly with multiple measures of genomic complexity: number of whole genome doublings (p = 0.003,
ANOVA; Figures 3C and 3D), subclonal genome fraction
(p = 4e-6), and aneuploidy score based on the number of arms with gains or losses (p = 5e-6, Pearson correlation) (Figure S2F). Our findings provide a genomic basis for this common observa-tion in cancer histopathology and support the further develop-ment of computational approaches to digital pathology to understand additional aspects of tumor morphology.
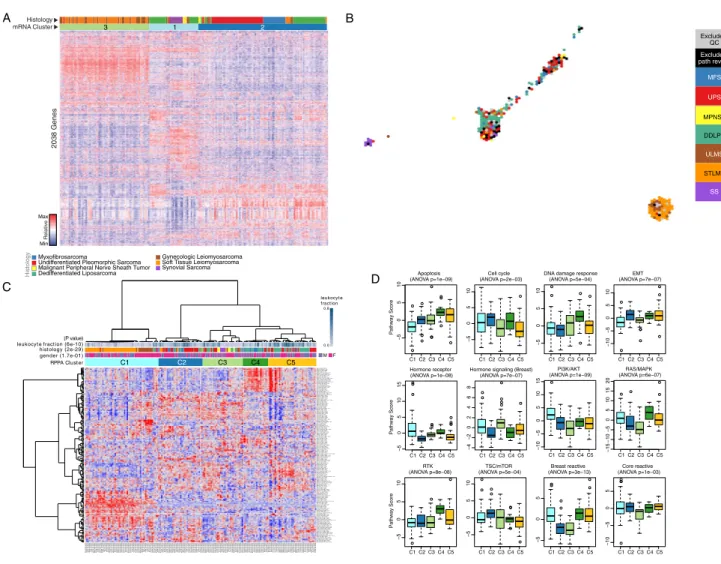
Integrated Clustering Analyses of Sarcomas
Unsupervised analysis using the cross-platform iCluster tool (Figure 3E) demonstrated that SS was the most distinct sarcoma across all platforms. iCluster placed all SS cases into cluster C4, whose discriminatory features included partial or complete loss of chromosome 3p in 5 cases (45%), high expression of FGFR3 (p = 7e-20) and miR-183 (p = 2e-25), and methylation of the PDE4Apromoter (p = 1e-06) (Table S3). While SS lacked recur-rent mutations, it had relatively uniform and unique patterns of DNA methylation, miRNA expression, and gene expression ( Fig-ures S3A–S3C and S4A), consistent with the proposed central role of t(X;18)(p11;q11), which results in an SS18-SSX fusion protein that disrupts epigenetic regulation (Kadoch and Crab-tree, 2013). The distinct patterns of SS mRNA expression are
Figure 1. Landscape of Genomic Alterations in 206 Sarcomas
(A) Integrated plot of clinical and molecular features for all samples, ordered by sarcoma type. From top to bottom panels indicate: frequency of mutations per Mb; mutational signatures, indicating type of substitution; patient sex; sarcoma grade; number of whole genome doublings; number of unbalanced genomic seg-ments; tumor site; sarcoma type; cluster from iCluster analysis; significantly mutated genes, defined by false discovery rate (FDR) of <0.05 as computed by MuSiC2;TRIOorSS18-SSXgene fusions;frequent focal somatic copy-number alterations including gains (pink), amplification (red), shallow deletion (pale blue) or deep deletion (dark blue). The key to the color coding of sarcomas and mutation types is at the bottom. See alsoFigure S1andTable S1.
A
B
illustrated in a schematic 2-D tumor ‘‘map’’ visualization of high-dimensional mRNA expression data (Figure S4B), where distances in the map approximate the similarities between the samples in the original high-dimensional space. The map shows both SS and LMS as spatially distinct clusters from other sarcomas.
iCluster C1 was dominated by LMS, 64 of 65 cases (98%), and was distinguished from other sarcomas largely by genes linked to myogenic differentiation, including high expression of MYLK, MYH11, ACTG2, miR-143, and miR-145 (all p < 5e-39) (Figures S3B, S3C, and S4A). An association with grade was also noted, with iCluster C1 and C2 containing 11 of the 14 low-grade sarcomas (FNCLCC grade 1) compared to 3 in C3 and none in C4-5 (p = 0.011). However, this effect may be driven by iCluster separation by histologic type, as 12 of the 14 low-grade sarcomas were LMS, which was enriched in C1.
Additional differences between LMS and other sarcomas were found in protein expression, as shown by the LMS-enriched RPPA cluster C1 (in which 48 of 53 samples were LMS; Fig-ure S4C) that showed significantly lower inferred activity of the apoptosis pathway (p = 1.03e-9), and higher hormone receptor (ER/PR) levels and inferred PI3K/AKT pathway activity (p = 1.5e-8 and p = 1.02e-9, respectively) (Figure S4D).
Genomic and Molecular Landscapes of Specific Sarcomas
Five sarcoma types had sufficient numbers of samples for detailed analyses of molecular and prognostic subsets, as sum-marized below. These analyses of prognostic subsets should be regarded as hypothesis-generating.
DDLPS: Integrated Analyses Suggest Novel Prognostic Subsets
We first analyzed SCNAs in DDLPS. Then, given the lack of good biomarkers for aggressive DDLPS, we sought prognostic sub-sets based on SCNA and DNA methylation data.
Our 50 DDLPS were defined by 12q1315 amplifications, including highly recurrent copy-number gains or amplification
ofMDM2 (100% of our samples), CDK4(92%), and HMGA2
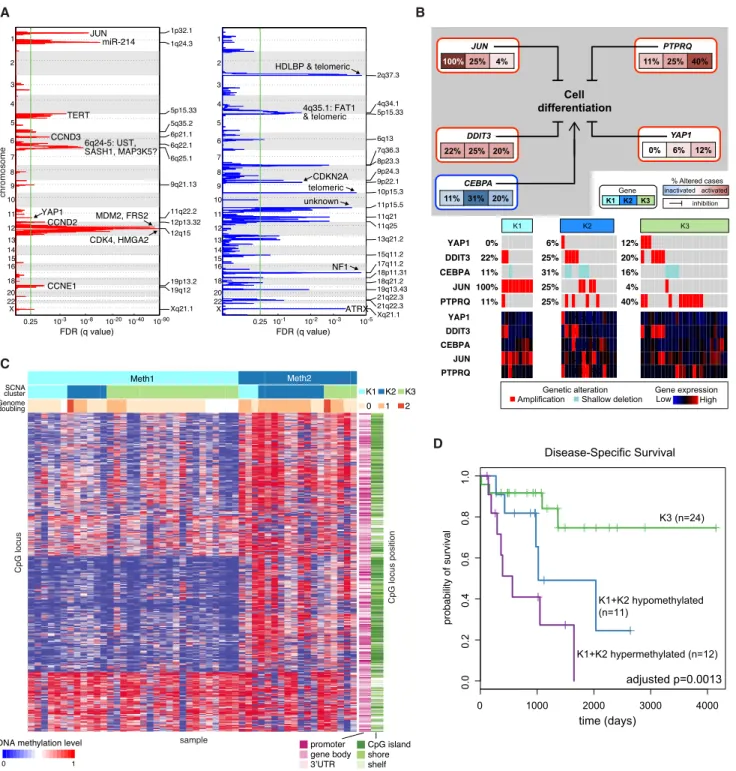
(76%), as previously reported (Barretina et al., 2010) as well as FRS2(96%) andNAV3(60%). Other frequent SCNAs involved genes reported to inhibit adipocyte differentiation:JUN(42%) (Mariani et al., 2007),DDIT3(32%) (Fawcett et al., 1996),PTPRQ (46%) (Jung et al., 2009),YAP1(16%) (Seo et al., 2013), and CEBPA(24%) (Taylor et al., 2011b) (Figures 4A and 4B;Table S4). All 5 genes showed correlations between copy number and mRNA level (p%0.001;Table S4B).PTPRQamplification
tended to be mutually exclusive with JUN amplification
(p = 0.026), with only 1 tumor (2%) having amplification of both genes (Figure 4B). Recurrent deletions (Figure 4A) included ATRX(10% deep; 20% shallow),NF1(6% deep; 22% shallow), andCDKN2A(2% deep; 42% shallow). Given that ATRX may
be required for response to CDK4 inhibitors (Kovatcheva et al., 2015) and that 30% of DDLPS haveATRXdeletions,ATRX alter-ations may represent an important correlative biomarker in future clinical trials of CDK4 inhibitors in DDLPS.
To define potentially prognostic subsets of DDLPS, we per-formed unsupervised clustering of SCNA and DNA methylation data. The SCNA data yielded 3 distinct clusters; clusters K1 (JUNamplified) and K2 (TERTamplified and chromosomally un-stable) had worse disease-specific survival (DSS) than K3 (6q25.1 amplified and fewer unbalanced segments than K2 [mean 384 versus 531; p = 0.02]) (Figure S5A). TheJUN amplifi-cation in K1 could contribute to the group’s poor prognosis, given that JUNoverexpression in DDLPS increases migration and invasion (Sioletic et al., 2014) and that JUN inhibits adipo-cyte differentiation via repression of CEBPb (Mariani et al., 2007). Thus, JUN could be an attractive therapeutic target as agents for its inhibition become available.
Unsupervised consensus clustering of DNA methylation data defined two clusters: hypomethylated (Meth1) and hypermethy-lated (Meth2) (Figure 4C). Meth2 had more genome doublings (p = 0.002) and lower leukocyte fraction (p = 0.0007), and corre-lated with worse DSS (HR = 4.4; p = 0.002). Meth2 also had higher inferred content of Th2 cells (Figure S5B), a finding linked
to poor outcomes in other cancers (De Monte et al., 2011). Integrating the SCNA and methylation clusters, we partitioned the DDLPS samples into the favorable K3 versus the unfavorable K1+K2 SCNA clusters, and subdivided the latter into hyperme-thylated versus hypomehyperme-thylated cases. The 3 groups differed significantly in DSS (p = 0.001;Figure 4D); DSS was longest in the K3 group and shortest in the hypermethylated K1+K2 group, which showed the lowest inferred fraction of immature dendritic cells (iDC: p = 0.004) (Bindea et al., 2013) (Figure S5C). While they require validation, these findings may reflect the impact of genomic alterations and immune microenvironment on the behavior of DDLPS, suggest consideration of different treat-ments for the groups, and provide a rationale for developing SCNAs and methylation as biomarkers in DDLPS.
LMS: ULMS and STLMS Are Molecularly Distinct
Here, we first examined similarities and differences between LMS and other sarcomas, then between ULMS and STLMS. We then defined iCluster subtypes and pathway activities and explored how the findings could influence treatment approaches.
As described above, in integrated and individual platform an-alyses, ULMS and LMS were generally more similar to each other than to other sarcomas. Pathway-level alterations included elevated PI3K/AKT signaling (p = 4e-06), a known feature of LMS (Gibault et al., 2012), and low apoptosis score (p = 1e-05) (Figure S6A). We found deletions of the tumor suppressors TP53(9% deep and 60% shallow deletions),RB1(14% deep, 78% shallow), andPTEN(13% deep, 68% shallow) (Figure 5A)
Figure 2. Mutational Landscape of Sarcomas
(A) Mutations in significantly mutated genes in sarcoma and selected known oncogenes and tumor suppressors. Only genes with recurrent or truncating mu-tations are shown.
(B) Mutation and indel profiles for TP53, ATRX, RB1, NF1, and PRKCD, color-coded by sarcoma type. Splice site mutations are indicated as involving the donor site (exon number + nucleotide position of mutation, e.g., e3+1) or acceptor site (exon – nucleotide position of mutation).
A E
B
C
D
Figure 3. Mutational Signatures, Genomic Complexity, and Integrated Analysis in Sarcoma
(A) Top: signature activities (number of mutations). Bottom: normalized signature activities, projected onto 3 mutational processes, COSMIC1, COSMIC5, and APOBEC (COSMIC2 and 13). Tumors are ordered by overall mutation frequency; not shown are the 2 hypermutated samples (AB32 and A9HT) and 1 ultraviolet signature sample (AB2E).
(B) Left: activities of COSMIC1, COSMIC5, and APOBEC signatures by sarcoma type. Right: normalized signature activity. (C) Variance in nuclear area according to the number of genome doublings in each tumor.
(D) Representative nuclear area analyses for sarcomas with 0, 1, and 2 whole genome doublings. See alsoFigures S2E and S2F.
(E) Unsupervised iCluster analysis, which integrated DNA copy number, DNA methylation, and expression of mRNA and miRNA. Color coding of tumor char-acteristics is at the bottom. Cluster C1 comprised 64 LMS and 1 UPS, including 10 low-grade LMS, and was relatively hypermethylated. Cluster C2 and C3 comprised 49/50 DDLPS and 35 other sarcomas. C4 comprised all 10 SS and one MPNST, and C5 comprised a mix of high-grade sarcomas, with the majority (34/56) being UPS/MFS. The heatmap scale for copy number is copy number log ratio (tumor versus normal); for methylation is normalized beta value, and for expression is normalized counts.
A
C
B
D
Figure 4. Dedifferentiated Liposarcoma
(A) Recurrent focal copy-number alterations in the 50 DDLPS samples by GISTIC 2.0 analysis. Green line indicates the significance threshold (FDR 0.25) for focally amplified and deleted regions. See alsoTable S5.
(B) Alterations of genes involved in inhibition of adipose differentiation. The frequency of copy-number alterations in DDLPS is shown for each of the 3 SCNA clusters, and the heatmap shows gene expression. The scale for gene expression is z-scores from3 to +3.
(C) Methylation clusters from unsupervised consensus clustering of DNA methylation data in DDLPS. Within methylation clusters, samples are ordered by SCNA cluster and genome doubling.
A
1p36.32 1q43 2p24.3 2q37.3 3p21.31 3q29 4q35.1 5q35.3 6p25.3 6q16.3 8p12 9p24.3 9p21.3 9q34.3 10p15.3 10q23.31 11
p15.5
1
1
q23.3
12q12 13q14.2 13q34 14q24.1 15q24.1 16q12.1 17p13.1 17q25.3 18p
11
.3
2
18q23 19p13.3 19q13.43 21q
1
1
.2
Xp21.1 Xq21.1 Xq22.3
1 2 3 4 5 6 7 8 9 10 11 12 13 14 15 16 18 20 22 X telomeric
TP53 HDLBP &
telomeric RB1
PTEN telomeric CDKN2A ATRX 0.25 10-2 10-4 10-7 10-10 10-30 1q21.3 2p 1 1.2 3q13.2 13q12.1 1 17p12 17p1 1.2
19p13.3 19q12 22q1
1.21 8q24.21 MYOCD CCNE1 MYC chromosome
1 2 3 4 5 6 7 8 9 10 11 12 13 14 15 16 18 20 22 X
chromosome 0.25 10-2 10-4 10-6 10-10 amplifications deletions
FDR (q value)
Gender: Histology: TP53 RB1 PTEN 0 20 40 # Mutations SCNA LMS cluster:
Meth LMS cluster: mRNA LMS cluster:
iCluster LMS: ULMS F C1 STLMS M C2 C1 C2
C1 C2 C3
1 2 3
C1 C2 C3 iCluster STLMS: B
No Mutation Synonymous In-frame Indel
Other Non Syn Missense Splice Site Frameshift Nonsense FDR <1e-22 2e-15 0.49 Mutation type C 1 2 3 4 6 8 10 12 14 16 18 20 22
iCluster C1 C2 F M wt mut Gender RB1 copy number DNA methylation mRNA miRNA
DSS by STLMS iCluster D 0.0 0.2 0.4 0.6 0.8 1.0
0 1000 2000 3000 p=0.008
Time (days)
Proportion Surviving C1
C2
% Altered cases
inactivated activated
inhibition E
ULMS STLMS iCluster1 STLMS iCluster2
Genetic Alteration: Amplification Deep Deletion
Missense Mutation Truncating Mutation
mRNA Upregulation (expression >2 SD above the mean) mRNA Downregulation (expression below the mean by >2 SD) IGF1R PIK3CA PTEN AKT1 AKT2 AKT3 TSC1 TSC2 RICTOR RPTOR MTOR gene C1 C2 ULMS STLMS all PTEN 25% 12% 22% PIK3CA 4% 0% 7% TSC2 0% 0% 11% RICTOR 18% 8% 11% RPTOR 0% 16% 11% MTOR 18% 4% 4% IGF1R 57%0% 7% AKT1 18% 4% 11% AKT3 18% 0% 15% AKT2 7% 4% 3%
and mutations ofTP53in 50%,RB1in 15%, andPTENin 5% of samples (Figure 5B). Other shared features of LMS were elevated miR-143 and miR-145 expression, low mRNA expres-sion of inflammatory response genes, and low leukocyte fraction by methylation analysis.
In LMS, 12 miRNAs were associated with recurrence-free sur-vival (RFS) (adjusted p < 0.05;Table S5). The miRNA most highly associated with RFS was miR-181b-5p (univariate HR 8.03; adjusted p < 0.0001; Figure S6B). Although high miR-181b (>571 RPM) was more common in ULMS than in STLMS (26% versus 6%; p = 0.027), it emerged as an independent predictor of RFS (HR 7.4, 95% confidence interval 3.1–17.8, p = 9e-6) in a multivariate model including LMS subtype and tumor size. miR-181b expression has been reported to promote proliferation and migration of vascular smooth muscle via the PI3K pathway (Li et al., 2015); however, we found that high miR-181b-5p was associated with low expression of its predicted PI3K pathway targets AKT3 and MTOR (p < 0.006, Wilcoxon test), suggesting that a different mechanism may account for the predicted contri-bution of miR-181b-5p to aggressive behavior in LMS.
Despite their overall similarity and lack of discriminatory SCNAs, ULMS and STLMS had significantly different methyl-ation and mRNA expression signatures, with ULMS showing a higher DNA damage response score (p = 0.005), and hypome-thylation of ESR1 target genes, while STLMS had a more prominent HIF1a signaling signature (p = 6e-05) (Figures S6A and S6C).
iCluster analysis of all LMS defined two distinct clusters, one highly associated with ULMS and the other with STLMS ( Fig-ure 5B; tumors that were exceptions to clustering by site are listed inTable S6). Considering STLMS alone, iCluster analysis defined two subgroups, C1 and C2 (Figure 5C). C1 had worse recurrence-free survival (RFS; p = 0.0002) and DSS (p = 0.008;
Figure 5D). Our findings are consistent with prior reports of LMS having 3 mRNA expression subtypes, i.e., a mostly uterine type and two mostly soft tissue types with very different progno-ses (Beck et al., 2010; Guo et al., 2015).
The STLMS iCluster groups had molecular features that could contribute to prognostic differences. Compared with C2, C1 was hypermethylated and showed higher expression ofIGF1Rand factors involved in cell-cycle control (CCNE2), DNA replication (MCM2), and DNA repair (FANCI) (all with adjusted p%0.03) (Table S6). C1 also showed more frequent mutations of RB1 (p = 0.04) and amplification of 17p11.2-p12 (q = 0.022; Fig-ure S6D), a known alteration in LMS (Pe´rot et al., 2009) that notably includesMYOCD, encoding myocardin, a transcription
factor involved in smooth muscle differentiation.MYOCDwas highly amplified in 13 STLMS and 2 ULMS independent of tumor site, size, or grade. Both the STLMS C1 cluster and ULMS were enriched forPTENdeletion, mutation, or downregu-lation and for amplification or overexpression of AKT pathway members. Taken together, 46/55 (84%) of ULMS and STLMS iCluster C1 tumors contained alterations in the AKT pathway compared to 11/25 (44%) of STLMS iCluster C2 (p = 1e-04; Fig-ure 5E). The hypomethylated C2 STLMS displayed prominent signatures of inflammatory cells, including NK cells (p = 0.004) and mast cells (p = 0.044).
The predicted differences between ULMS and STLMS in hormonal responsiveness and stress response (e.g., through HIF1aand DNA damage pathways) support the use of different management approaches for the two, consistent with current treatment guidelines (Koh et al., 2015). In LMS as a whole, aberrant PI3K-AKT-MTOR signaling may be crucial, given recurrent deletion/mutation ofPTENalong with frequent amplifi-cation and upregulation ofIGF1R,AKT,RICTOR, andMTOR (Figure 5E) and high AKT pathway scores by RPPA. Indeed, MTOR inhibitors such as everolimus and temsirolimus have shown some clinical efficacy in LMS (Italiano et al., 2011; Schwartz et al., 2013), albeit diminished by their indirect upregu-lation of AKT. Newer TORC1/TORC2 inhibitors and dual PI3K/ MTOR inhibitors may overcome this limitation and offer more effective therapy for LMS patients.
UPS and MFS: Molecular Data Support a Single Entity with a Phenotypic Spectrum
Historically, MFS was considered a subset of UPS (‘‘myxoid ma-lignant fibrous histiocytoma’’), but more recently, MFS and UPS have been classified as distinct clinical entities based on their different clinicopathologic features (Fletcher et al., 2013). MFS has prominent myxoid stroma and is often lower grade and prone to local relapse, while UPS is generally higher grade, more cellular, and prone to distant metastasis and shorter survival.
We found MFS and UPS to be largely indistinguishable across multiple platforms (Figure 6A), the only exception being a small cluster within UPS with distinct mRNA, methylation, and PARADIGM profiles. However, this lack of clear distinction between MFS and UPS could be explained if our MFS tissues had underrepresentation of ‘‘classic’’ low-grade MFS areas and overrepresentation of the high-grade, UPS-like areas that can evolve within an MFS (Figure S6E). On reviewing the frozen tissue submitted for TCGA analysis, we found substan-tial numbers of nonclassic MFS samples (11; 65%) including
Figure 5. Leiomyosarcoma
(A) Recurrent focal copy-number alterations in the 80 LMS samples by GISTIC 2.0 analysis. Green line indicates the significance threshold (FDR 0.25) for focally amplified and deleted regions.
(B) Molecular landscape of LMS. ULMS was enriched for tumors in iCluster C1, mRNA C2, methylation C3, and SCNA C3 (characterized by genomic instability). STLMS was enriched for the other 2 SCNA clusters: C2 (characterized by chromosome 17p1112 gains) and SCNA C1 (genomically quiet). FDR values next to gene mutations were computed by MuSiC2. See alsoFigure S6andTable S6.
(C) iCluster analysis of STLMS, demonstrating hypomethylation of C2 relative to C1. Heatmaps display the most variable distinguishing factors between clusters. See alsoTable S6.
(D) Kaplan-Meier analysis of STLMS iCluster C1 versus C2. Median DSS was 6.7 years for C1 and was not reached for C2.
Histology iCluster UPS MFS SCNA UPS MFS cluster miRNA UPS MFS cluster Meth UPS MFS cluster mRNA UPS MFS cluster RPPA UPS MFS cluster PARADIGM UPS MFS cluster
Gene Mutation
# Mutations
TP53 ATRX RB1
20 10 0
C2 C1 A
B C
D E
MFS / UPS
Myxoid Percentage
Myxoid class 0, 1, 2
mRNA expression
iCluster Group 1, 2
0 100
-3 0 3
DDLPS MFS MPNST SS STLMS ULMS UPS
−
2
−
10
1234
YAP1/VGLL3 gene signature
Histology
normalized gene signature
● ● ● ● ● ● ● ● ● ● ● ●● ● ● ●● ● ●● ● ● ● ● ● ● ● ● ● ● ● ●● ● ● ● ● ● ● ● ● ● ● ● ● ● ● ● ● ● ● ● ● ● ● ● ● ● ● ● ● ● ● ● ● ● ● ● ● ● ● ● ● ● ● ●● ●● ●●● ● ● ● ● ● ● ● ● ● ● ●● ● ● ● ● ● ● ● ● ● ● ● ● ● ● ●● ● ● ● ● ●● ● ● ● ● ● ●● ● ● ● ● ● ● ● ● ● ● ● ● ● ● ● ● ●● ●● ● ● ● ●● ● ● ● ● ● ● ● ●●● ● ● ● ● ● ● ● ● ● ● ● ● ●●● ● ● ● ● ● ● ● ● ● ● ● ● ● ●● ● ● ● ● ●● ● ● ● ● ● ● ● ● ● ● ●●
p = 1.4e−24
Survival (years)
-3 -2 -1 0 1 2 3
miRNA expression
MFS UPS C1 C2 C1 C2
C1 C2 no data C2 C1
2 1
C2 C1 C3 C3 3 C4 MupsMFS: MFS UPS deep deletion Copy Number shallow deletion 1 2 3 4 5 6 7 8 9 10 12 14 16 18 20 22 X Histology VGLL3 amplification RB1 deletion <1e-22 FDR 4e-16 0.06 No Mutation Synonymous In-frame Indel
Other Non Syn Missense Splice Site Frameshift Nonsense Mutation type Classic: Nonclassic: Amplification Deletion
log2 copy ratio
1.5 -1.5
0 1 2 3 4 5
0.0 0.2 0.4 0.6 0.8 1.0 Propor tion sur viving
High score (n=25) Low score (n=31)
padj=2.7e−06
100-5p 10a-5p 194-5p 25-3p 150-5p 22-3p 452-5p Group Disease-specific death Years alive Tumor size Tumor size 5 35 Years alive 2 12 no yes Low score High score
miR-22-3p miR-25-3p miR-194-5p miR-452-5p miR-150-5p miR-100-5p miR-10a-5p tumor size
−0.6 −0.4 −0.2 0.0 0.2 0.4
coefficient
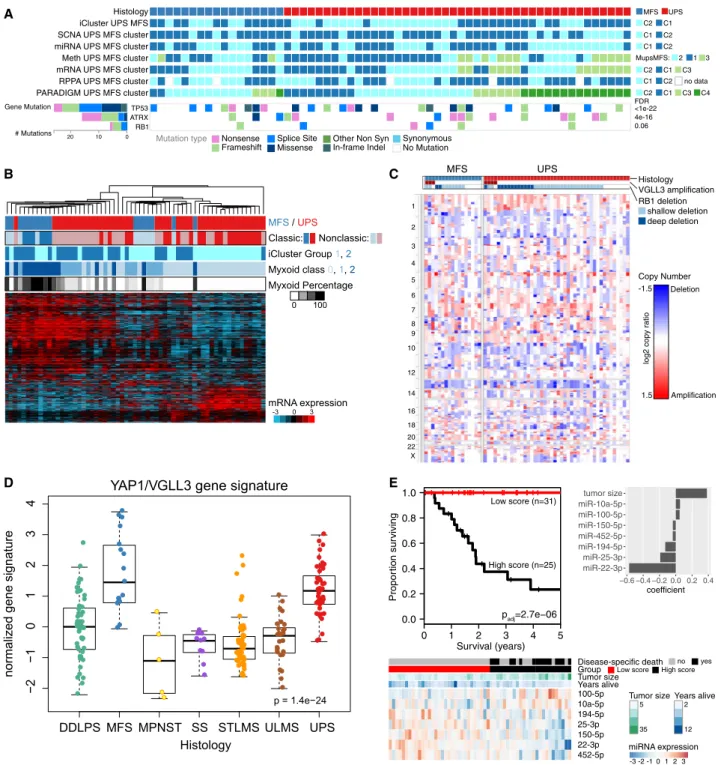
Figure 6. Undifferentiated Pleomorphic Sarcoma and Myxofibrosarcoma
(A) Integrated molecular profile of MFS and UPS, showing clusters from unsupervised analyses and recurrent gene mutations. FDRs next to gene mutations were computed by MuSiC2.
(B) Molecular classification of UPS/MFS by myxoid stromal content of frozen tumor sample. Unsupervised clustering was performed on genes differentially expressed (q < 0.05) between groups defined by extent of myxoid stroma (none, 1%–49% of the tissue,R50% of the tissue). ‘‘Classic’’ cases of MFS (n = 6) and UPS (n = 20) on frozen material are indicated. See alsoFigure S6E.
(C) SCNAs in MFS and UPS.VGLL3amplification andRB1deletion are shown at the top.
(D) Hippo pathway activation. The boxplots show YAP1 and VGLL3 target gene expression signature (He´lias-Rodzewicz et al., 2010).
(E) Multivariable miRNA prognostic classifier for DSS. We performed a penalized regression analysis using all miRNAs and tumor size in the 54 UPS/MFS samples with outcome data. The samples were split into high and low groups based on model score, minimizing the log-rank p value. The p value shown is corrected for multiple testing.
high-grade epithelioid MFS (5; 29%), and these high-grade sam-ples may have contributed to molecular similarity between MFS and UPS.
Because the principal morphological distinction between MFS and UPS is the amount of myxoid stroma, we asked whether genes associated with myxoid stroma could better discriminate MFS and UPS. We identified genes that were differentially ex-pressed based on the proportion of histologic myxoid compo-nent (0, <50%, andR50%). Unsupervised clustering of UPS/ MFS based on this gene set (Figure 6B) segregated MFS from UPS, whether or not they had classic morphology, with matrix-associated genes being more highly expressed in MFS. Overall, our molecular data indicate that these two sarcomas are not distinct entities, but rather fall along a spectrum, as in the original nomenclature for these tumors. Thus, cases will be encountered across a continuum in terms of myxoid component, expression of matrix-related genes, grade, and clinical behavior. Given the molecular similarities, common systemic treatment approaches may be appropriate.
Taking UPS/MFS as a single spectrum of disease, we then evaluated SCNAs across the combined set of samples ( Fig-ure 6C), finding high-level amplification of CCNE1 in 10%, VGLL3in 11%, andYAP1in 3%, as previously reported ( He´l-ias-Rodzewicz et al., 2010). VGLL3 and YAP1 are TEAD cofac-tors in the Hippo signaling pathway that induce proliferation. Copy-number gains ofVGLL3andYAP1 correlated with gene expression (not shown), and a YAP1/VGLL3 target gene signa-ture (He´lias-Rodzewicz et al., 2010) was strongly expressed in UPS/MFS (p = 1e-24;Figure 6D). Thus, a subset of UPS/MFS may be driven by the Hippo pathway, for which inhibitors are becoming available.
Multivariable analysis of miRNAs and tumor size in UPS/MFS identified 7 miRNAs that together with tumor size were associ-ated with metastasis-free survival (p = 2e-08;Figure S6F), and 7 that together with tumor size were associated with DSS (p = 3e-6; Figure 6E); both sets of miRNAs included miR-100-5p and miR-194-5p. Notably, DSS was most strongly associated with miR-22 downregulation, which has also been re-ported as a poor prognostic factor in another complex karyotype sarcoma, osteosarcoma (Wang et al., 2015).
Immune Microenvironment Signatures
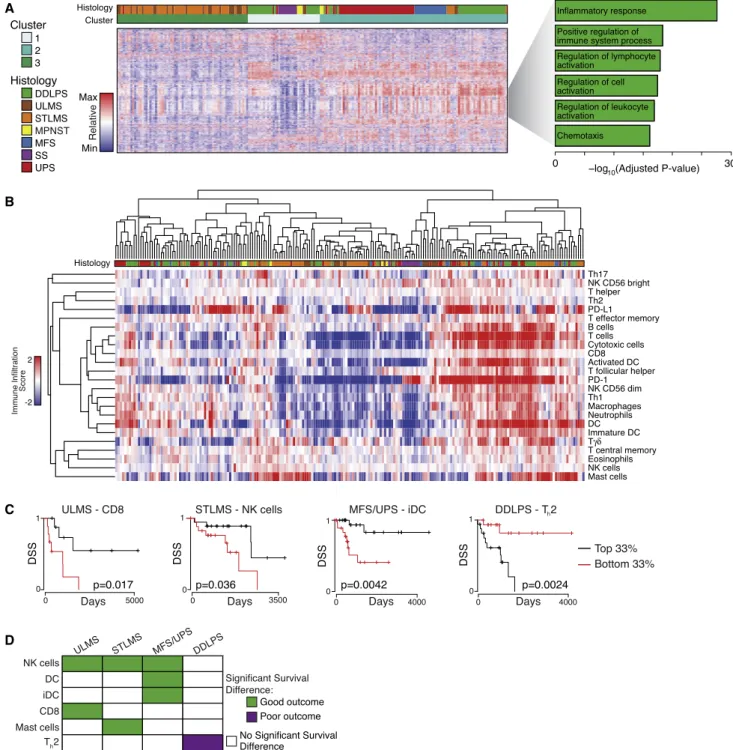
Among the variable genes in the pan-sarcoma unsupervised clustering of the mRNA data were 203 genes involved in im-mune response and inflammation (Figure 7A). To better define the immune cell infiltrates, we assigned each sarcoma type an immune infiltration score for various immune cells based on their gene expression signatures (Bindea et al., 2013) ( Fig-ure 7B). Cases with high or low immune infiltration scores typically showed coordinate increases or decreases in multi-ple inflammatory cell types, rather than changes in a single cell type.
UPS/MFS and DDPLS had the highest median macrophage scores among sarcoma types; DDLPS had highest CD8 score, and STLMS had highest PD-L1 score (Figure S7A), which was significantly higher than in ULMS (p = 4e-5). Across different tu-mors, PD-L1 mRNA level correlated with the copy number of its gene (CD274) (r = 0.42, adjusted p = 4e-10), but not with PD-1
score. Immune signatures in each sarcoma type were validated using publically available RNA sequencing (RNA-seq) data from 113 sarcomas (Lesluyes et al., 2016). Median immune signatures in LMS, MFS, and SS were strongly correlated between the two studies (Spearman coefficients 0.908, p = 8e-09; 0.819, p = 9e-06; and 0.858, p = 4e-08, respectively) (Figure S7B). This approach was not well suited to validation in DDLPS and UPS (as the immune subtypes all had median scores around zero in both series), but the distribution of scores was similar be-tween cohorts (Figure S7C).
We compared DSS of patients with tumors in the top versus bottom third of immune infiltrate scores (Figure 7C and 7D). NK cells were the only immune cell type to correlate significantly with DSS in multiple sarcoma types. For UPS/MFS, DCs and iDCs correlated with improved DSS, suggesting a role for antigen presentation in the immunologic response to these tumors. The impact of immune infiltration scores on DSS differed in STLMS and ULMS (Figure 7D). In DDLPS, an elevated Th2 signature
was associated with shorter DSS (Figure 7D).
Expression of known druggable immune microenvironment markers was then assessed. We found differential expression based on sarcoma type of B7-H3, TGFB1, and TIM3 (p = 1.6e-15, p = 9.8e-11, and p = 2.9e-14, respectively by Kruskal-Wallis test;Figure S7D), among other markers, with median expression highest in DDLPS, UPS, and MFS.
Taken together, these data suggest that the immune microen-vironment differentially affects outcome in different sarcoma types, and can contribute positively or negatively to DSS. More-over, expression of immune microenvironment markers differs by sarcoma type and may affect response to immune checkpoint inhibitors. Such findings are of particular interest given the prom-ising results of the SARC028 trial of a PD-1 inhibitor, in which 40% of UPS cases showed responses (Burgess et al., 2017). Our study suggests that these immunotherapy agents should be specifically explored in MFS as well.
Conclusions
This multi-platform genome-wide dataset provides the most comprehensive database of DDLPS, MFS, UPS, and LMS genomic and epigenomic alterations to date. The depth and breadth of alterations reveals the decidedly heterogeneous na-ture of adult soft tissue sarcomas and highlights their presumed dependence on SCNAs, rather than targetable activating point mutations. In both integrated and platform-specific analyses, the one fusion-associated sarcoma type in the study (SS) was the most dissimilar to other sarcomas, but the analyses also re-vealed distinct differences among LMS and the other complex karyotype sarcomas. Salient differences includeMDM2,CDK4, JUN, andTERTamplifications in DDLPS;MYOCDamplification,
PTEN mutations/deletions, and AKT, IGF1R, and MTOR
A
B
C
D
Figure 7. Specific Types of Immune Infiltration Show Associations with Survival Outcomes
(A) Clusters identified by unsupervised clustering of the 2,038 most variably expressed genes across 206 samples. Heatmap shows expression; the gray wedge marks 203 genes with immune-related and inflammatory-related GO terms. The bar graph (right) shows the Benjamini-Hochberg adjusted p values for enrichment for the specific ontologies listed, as defined by the DAVID algorithm.
(B) Unsupervised cluster analysis of tumors by calculated immune infiltration scores. The analysis defines a subset of DDLPS, LMS, MFS, and UPS with high immune infiltrates (right).
(C) Selected Kaplan-Meier curves for DSS by histology and immune class. The graphs show the patients in the top third versus bottom third for the immune scores indicated.
cell infiltration in the tumor microenvironment was commonly detected in genomically complex DDLPS, LMS, UPS, and MFS and was highly associated with clinical outcome. Given the abovementioned efficacy of PD-1 blockade in some UPS, the nature of the immune cell types recruited may serve as an impor-tant determinant of response to PD-1 blockade. This study provides a detailed genomic landscape of multiple sarcoma types now available for further mining by the sarcoma research community to improve our understanding of sarcomagenesis, hopefully leading to new therapeutic approaches for these deadly diseases.
STAR+METHODS
Detailed methods are provided in the online version of this paper and include the following:
d KEY RESOURCES TABLE
d CONTACT FOR REAGENT AND RESOURCE SHARING
d EXPERIMENTAL MODEL AND SUBJECT DETAILS
B Human Subjects
d METHOD DETAILS
B Biospecimens and Quality Control
B Pathology review
B Copy Number Analysis
B Focal amplification & shallow & deep deletion
B DNA Sequencing and Analysis
B Assessment of telomere length
B Mutation Signature Analysis
B mRNA Analysis
B miRNA Analysis
B DNA Methylation Analysis
B RPPA analysis
B iCluster
B iCoMut
B Regulome Explorer
B PARADIGM
B Quantitation of Nuclear Pleomorphism d QUANTIFICATION AND STATISTICAL ANALYSIS
d DATA AND SOFTWARE AVAILABILITY d ADDITIONAL RESOURCES
SUPPLEMENTAL INFORMATION
Supplemental Information includes seven figures, seven tables, and supple-mental text and can be found with this article online athttps://doi.org/10. 1016/j.cell.2017.10.014.
AUTHOR CONTRIBUTIONS
The Cancer Genome Atlas Network contributed collectively to this study. specimens were provided by the tissue source sites and processed by the Bio-specimen Core Resource. Data generation and analyses were performed by the Genome Sequencing Centers, Cancer Genome Characterization Centers, and Genome Data Analysis Centers. All data were released through the Data Coordinating Center. The NCI and NHGRI project teams coordinated project activities. For a complete description of the contributions of each author, as well as their affiliations, please refer toMethods S1. We also acknowledge the following TCGA investigators of the Sarcoma Analysis Working Group who contributed substantially to the project: Project coordinator, I.F.; Data
coordinator, F.S.V.; Analysis coordinators, I.F. and F.S.V.; Manuscript coordi-nators: E.G.D. and J.E.N.; Project chairs: E.G.D., L.Ding, M.L., A.J.L., S.Singer, and B.A.V.T.; Pathology subgroup: E.G.D., L.A.D., J.L.H., A.J.L., B.P.R., and M.V.D.R.; Clinical subgroup: L.Baker, G.D.D., J.E.G.O., A.J.L., L.I., T.M.L., C.P.R., R.F.R., and S.Singer; Mutation and SMG analysis: M.H.B., Q.G., M.W., and W.W.; Copy-number: A.D.C. and J.S.; mRNA: I.J.D., A.J.H., and K.A.H.; miRNA: R.Bowlby and A.G.R.; Methylation: L.Danilova; Mutational signature: J.K.; Computational histologic-genomics: L.A.D.C., D.H.G., A.J.L., and J.S.; Whole genome: J.K., M.D.M., and W.W.; Whole exome: J.K., M.D.M.; and E.M.T.: L.Byers, L.Diao, and J.Wang; RPPA: R.A., A.M.H., and J.Roszik; Immune signatures: I.J.D., A.J.H., and K.A.H.; Integrative analysis: J.A., E.M.L., Y.N., A.P., F.S.V., and R.S.; iCoMut: D.I.H. and M.S.N.; iCluster: E.D. and R.S.; PARADIGM: C.B. and C.Y.; Regulome explorer: L.I.; Manuscript writing committee: E.G.D., L.Ding, M.L., A.J.L., J.E.N., F.S.V., S.Singer, and B.A.V.T.; Manuscript review: L.Baker, L.Byers, A.D.C., L.A.D.C., L.Cope, I.J.D., L.E.D., L.A.D., E.D., A.K.G., J.E.G.O., D.N.H., A.J.H., K.A.H., D.B.H., J.L.H., L.I., J.K., R.G.M., R.E.P., R.F.R., A.G.R., B.P.R., J.S., J.N.W., and W.W.
ACKNOWLEDGMENTS
We thank the patients and families who contributed to this study. This project is supported by the following NIH grants: U54 HG003273, U54 HG003067, U54 HG003079, U24 CA143799, U24 CA143835, U24 CA143840, U24 CA143843, U24 CA143845, U24 CA143848, U24 CA143858, U24 CA143866, U24 CA143867, U24 CA143882, U24 CA143883, U24 CA144025, U24 CA211006, and P30 CA016672. A.D.C. and M.M. receive funding from Bayer AG.
Received: March 17, 2017 Revised: July 7, 2017 Accepted: October 5, 2017 Published: November 2, 2017
REFERENCES
Akbani, R., Ng, P.K., Werner, H.M., Shahmoradgoli, M., Zhang, F., Ju, Z., Liu, W., Yang, J.Y., Yoshihara, K., Li, J., et al. (2014). A pan-cancer proteomic perspective on The Cancer Genome Atlas. Nat. Commun.5, 3887.
Alexandrov, L.B., Jones, P.H., Wedge, D.C., Sale, J.E., Campbell, P.J., Nik-Zainal, S., and Stratton, M.R. (2015). Clock-like mutational processes in hu-man somatic cells. Nat. Genet.47, 1402–1407.
Barretina, J., Taylor, B.S., Banerji, S., Ramos, A.H., Lagos-Quintana, M., Decarolis, P.L., Shah, K., Socci, N.D., Weir, B.A., Ho, A., et al. (2010). Sub-type-specific genomic alterations define new targets for soft-tissue sarcoma therapy. Nat. Genet.42, 715–721.
Beck, A.H., Lee, C.H., Witten, D.M., Gleason, B.C., Edris, B., Espinosa, I., Zhu, S., Li, R., Montgomery, K.D., Marinelli, R.J., et al. (2010). Discovery of molec-ular subtypes in leiomyosarcoma through integrative molecmolec-ular profiling. Oncogene29, 845–854.
Bibikova, M., Barnes, B., Tsan, C., Ho, V., Klotzle, B., Le, J.M., Delano, D., Zhang, L., Schroth, G.P., Gunderson, K.L., et al. (2011). High density DNA methylation array with single CpG site resolution. Genomics98, 288–295.
Bindea, G., Mlecnik, B., Tosolini, M., Kirilovsky, A., Waldner, M., Obenauf, A.C., Angell, H., Fredriksen, T., Lafontaine, L., Berger, A., et al. (2013). Spatio-temporal dynamics of intratumoral immune cells reveal the immune landscape in human cancer. Immunity39, 782–795.
Budczies, J., Klauschen, F., Sinn, B.V., Gy}orffy, B., Schmitt, W.D., Darb-Esfa-hani, S., and Denkert, C. (2012). Cutoff Finder: a comprehensive and straight-forward Web application enabling rapid biomarker cutoff optimization. PLoS ONE7, e51862.
Cancer Genome Atlas Research Network (2011). Integrated genomic analyses of ovarian carcinoma. Nature474, 609–615.
Cancer Genome Atlas Research Network (2012). Comprehensive genomic characterization of squamous cell lung cancers. Nature489, 519–525.
Cancer Genome Atlas Research Network (2014). Comprehensive molecular profiling of lung adenocarcinoma. Nature511, 543–550.
Carter, S.L., Cibulskis, K., Helman, E., McKenna, A., Shen, H., Zack, T., Laird, P.W., Onofrio, R.C., Winckler, W., Weir, B.A., et al. (2012). Absolute quantifica-tion of somatic DNA alteraquantifica-tions in human cancer. Nat. Biotechnol. 30, 413–421.
Chu, A., Robertson, G., Brooks, D., Mungall, A.J., Birol, I., Coope, R., Ma, Y., Jones, S., and Marra, M.A. (2016). Large-scale profiling of microRNAs for The Cancer Genome Atlas. Nucleic Acids Res.44, e3.
Cibulskis, K., McKenna, A., Fennell, T., Banks, E., DePristo, M., and Getz, G. (2011). ContEst: estimating cross-contamination of human samples in next-generation sequencing data. Bioinformatics27, 2601–2602.
Cibulskis, K., Lawrence, M.S., Carter, S.L., Sivachenko, A., Jaffe, D., Sougnez, C., Gabriel, S., Meyerson, M., Lander, E.S., and Getz, G. (2013). Sensitive detection of somatic point mutations in impure and heterogeneous cancer samples. Nat. Biotechnol.31, 213–219.
Cingolani, P., Platts, A., Wang, L., Coon, M., Nguyen, T., Wang, L., Land, S.J., Lu, X., and Ruden, D.M. (2012). A program for annotating and predicting the effects of single nucleotide polymorphisms, SnpEff: SNPs in the genome of Drosophila melanogaster strain w1118; iso-2; iso-3. Fly (Austin)6, 80–92.
Costello, M., Pugh, T.J., Fennell, T.J., Stewart, C., Lichtenstein, L., Meldrim, J.C., Fostel, J.L., Friedrich, D.C., Perrin, D., Dionne, D., et al. (2013). Discovery and characterization of artifactual mutations in deep coverage targeted cap-ture sequencing data due to oxidative DNA damage during sample prepara-tion. Nucleic Acids Res.41, e67.
De Monte, L., Reni, M., Tassi, E., Clavenna, D., Papa, I., Recalde, H., Braga, M., Di Carlo, V., Doglioni, C., and Protti, M.P. (2011). Intratumor T helper type 2 cell infiltrate correlates with cancer-associated fibroblast thymic stro-mal lymphopoietin production and reduced survival in pancreatic cancer. J. Exp. Med.208, 469–478.
Dees, N.D., Zhang, Q., Kandoth, C., Wendl, M.C., Schierding, W., Koboldt, D.C., Mooney, T.B., Callaway, M.B., Dooling, D., Mardis, E.R., et al. (2012). MuSiC: identifying mutational significance in cancer genomes. Genome Res. 22, 1589–1598.
Delespaul, L., Lesluyes, T., Pe´rot, G., Brulard, C., Lartigue, L., Baud, J., La-garde, P., Le Guellec, S., Neuville, A., Terrier, P., et al. (2017). Recurrent TRIO fusion in nontranslocation-related sarcomas. Clin. Cancer Res. 23, 857–867.
Ding, Z., Mangino, M., Aviv, A., Spector, T., and Durbin, R.; UK10K Consortium (2014). Estimating telomere length from whole genome sequence data. Nu-cleic Acids Res.42, e75.
Elvidge, G.P., Glenny, L., Appelhoff, R.J., Ratcliffe, P.J., Ragoussis, J., and Gleadle, J.M. (2006). Concordant regulation of gene expression by hypoxia and 2-oxoglutarate-dependent dioxygenase inhibition: the role of HIF-1alpha, HIF-2alpha, and other pathways. J. Biol. Chem.281, 15215–15226.
Faraggi, D., and Simon, R. (1996). A simulation study of cross-validation for selecting an optimal cutpoint in univariate survival analysis. Stat. Med.15, 2203–2213.
Fawcett, T.W., Eastman, H.B., Martindale, J.L., and Holbrook, N.J. (1996). Physical and functional association between GADD153 and CCAAT/ enhancer-binding protein beta during cellular stress. J. Biol. Chem.271, 14285–14289.
Fletcher C.D.M., Bridge J., Hogendoorn P.C.W., and Mertens F., eds. (2013). WHO Classification of Tumours of Soft Tissue and Bone (Geneva: WHO Press).
Forbes, S.A., Tang, G., Bindal, N., Bamford, S., Dawson, E., Cole, C., Kok, C.Y., Jia, M., Ewing, R., Menzies, A., et al. (2010). COSMIC (the Catalogue of Somatic Mutations in Cancer): a resource to investigate acquired mutations in human cancer. Nucleic Acids Res.38, D652–D657.
Gaujoux, R., and Seoighe, C. (2010). A flexible R package for nonnegative ma-trix factorization. BMC Bioinformatics11, 367.
Gibault, L., Ferreira, C., Pe´rot, G., Audebourg, A., Chibon, F., Bonnin, S., La-garde, P., Vacher-Lavenu, M.C., Terrier, P., Coindre, J.M., and Aurias, A. (2012). From PTEN loss of expression to RICTOR role in smooth muscle differ-entiation: complex involvement of the mTOR pathway in leiomyosarcomas and pleomorphic sarcomas. Mod. Pathol.25, 197–211.
Gonzalez-Angulo, A.M., Hennessy, B.T., Meric-Bernstam, F., Sahin, A., Liu, W., Ju, Z., Carey, M.S., Myhre, S., Speers, C., Deng, L., et al. (2011). Functional proteomics can define prognosis and predict pathologic complete response in patients with breast cancer. Clin. Proteomics8, 11.
Guo, X., Jo, V.Y., Mills, A.M., Zhu, S.X., Lee, C.H., Espinosa, I., Nucci, M.R., Varma, S., Forgo´, E., Hastie, T., et al. (2015). Clinically relevant molecular sub-types in leiomyosarcoma. Clin. Cancer Res.21, 3501–3511.
He´lias-Rodzewicz, Z., Pe´rot, G., Chibon, F., Ferreira, C., Lagarde, P., Terrier, P., Coindre, J.M., and Aurias, A. (2010). YAP1 and VGLL3, encoding two co-factors of TEAD transcription co-factors, are amplified and overexpressed in a subset of soft tissue sarcomas. Genes Chromosomes Cancer49, 1161–1171.
Hennessy, B.T., Lu, Y., Gonzalez-Angulo, A.M., Carey, M.S., Myhre, S., Ju, Z., Davies, M.A., Liu, W., Coombes, K., Meric-Bernstam, F., et al. (2010). A tech-nical assessment of the utility of reverse phase protein arrays for the study of the functional proteome in non-microdissected human breast cancers. Clin. Proteomics6, 129–151.
Hsu, S.D., Tseng, Y.T., Shrestha, S., Lin, Y.L., Khaleel, A., Chou, C.H., Chu, C.F., Huang, H.Y., Lin, C.M., Ho, S.Y., et al. (2014). miRTarBase update 2014: an information resource for experimentally validated miRNA-target inter-actions. Nucleic Acids Res.42, D78–D85.
Hu, J., He, X., Baggerly, K.A., Coombes, K.R., Hennessy, B.T., and Mills, G.B. (2007). Non-parametric quantification of protein lysate arrays. Bioinformatics 23, 1986–1994.
Huang, W., Sherman, B.T., and Lempicki, R.A. (2009). Systematic and integra-tive analysis of large gene lists using DAVID bioinformatics resources. Nat. Protoc.4, 44–57.
Italiano, A., Kind, M., Stoeckle, E., Jones, N., Coindre, J.M., and Bui, B. (2011). Temsirolimus in advanced leiomyosarcomas: patterns of response and corre-lation with the activation of the mammalian target of rapamycin pathway. Anti-cancer Drugs22, 463–467.
Jung, H., Kim, W.K., Kim, D.H., Cho, Y.S., Kim, S.J., Park, S.G., Park, B.C., Lim, H.M., Bae, K.H., and Lee, S.C. (2009). Involvement of PTP-RQ in differen-tiation during adipogenesis of human mesenchymal stem cells. Biochem. Bio-phys. Res. Commun.383, 252–257.
Kadoch, C., and Crabtree, G.R. (2013). Reversible disruption of mSWI/SNF (BAF) complexes by the SS18-SSX oncogenic fusion in synovial sarcoma. Cell153, 71–85.
Kasar, S., Kim, J., Improgo, R., Tiao, G., Polak, P., Haradhvala, N., Lawrence, M.S., Kiezun, A., Fernandes, S.M., Bahl, S., et al. (2015). Whole-genome sequencing reveals activation-induced cytidine deaminase signatures during indolent chronic lymphocytic leukaemia evolution. Nat. Commun.6, 8866.
Koboldt, D.C., Zhang, Q., Larson, D.E., Shen, D., McLellan, M.D., Lin, L., Miller, C.A., Mardis, E.R., Ding, L., and Wilson, R.K. (2012). VarScan 2: somatic mu-tation and copy number alteration discovery in cancer by exome sequencing. Genome Res.22, 568–576.
Koh, W.J., Greer, B.E., Abu-Rustum, N.R., Apte, S.M., Campos, S.M., Cho, K.R., Chu, C., Cohn, D., Crispens, M.A., Dizon, D.S., et al.; National Compre-hensive Cancer Network (2015). Uterine sarcoma, version 1.2016: featured up-dates to the NCCN guidelines. J. Natl. Compr. Canc. Netw.13, 1321–1331.
Korn, J.M., Kuruvilla, F.G., McCarroll, S.A., Wysoker, A., Nemesh, J., Cawley, S., Hubbell, E., Veitch, J., Collins, P.J., Darvishi, K., et al. (2008). Integrated ge-notype calling and association analysis of SNPs, common copy number poly-morphisms and rare CNVs. Nat. Genet.40, 1253–1260.
turnover and expression of ATRX determine the choice between quiescence and senescence in response to CDK4 inhibition. Oncotarget6, 8226–8243.
Larson, D.E., Harris, C.C., Chen, K., Koboldt, D.C., Abbott, T.E., Dooling, D.J., Ley, T.J., Mardis, E.R., Wilson, R.K., and Ding, L. (2012). SomaticSniper: identification of somatic point mutations in whole genome sequencing data. Bioinformatics28, 311–317.
Lawrence, M.S., Stojanov, P., Polak, P., Kryukov, G.V., Cibulskis, K., Siva-chenko, A., Carter, S.L., Stewart, C., Mermel, C.H., Roberts, S.A., et al. (2013). Mutational heterogeneity in cancer and the search for new cancer-associated genes. Nature499, 214–218.
Lesluyes, T., Pe´rot, G., Largeau, M.R., Brulard, C., Lagarde, P., Dapremont, V., Lucchesi, C., Neuville, A., Terrier, P., Vince-Ranche`re, D., et al. (2016). RNA sequencing validation of the Complexity INdex in SARComas prognostic signature. Eur. J. Cancer57, 104–111.
Li, B., and Dewey, C.N. (2011). RSEM: accurate transcript quantification from RNA-Seq data with or without a reference genome. BMC Bioinformatics 12, 323.
Li, H., and Durbin, R. (2009). Fast and accurate short read alignment with Bur-rows-Wheeler transform. Bioinformatics25, 1754–1760.
Li, J., and Tibshirani, R. (2013). Finding consistent patterns: a nonparametric approach for identifying differential expression in RNA-Seq data. Stat. Methods Med. Res.22, 519–536.
Li, H., Ruan, J., and Durbin, R. (2008). Mapping short DNA sequencing reads and calling variants using mapping quality scores. Genome Res. 18, 1851–1858.
Li, H., Handsaker, B., Wysoker, A., Fennell, T., Ruan, J., Homer, N., Marth, G., Abecasis, G., and Durbin, R.; 1000 Genome Project Data Processing Sub-group (2009). The Sequence Alignment/Map format and SAMtools. Bioinfor-matics25, 2078–2079.
Li, T.J., Chen, Y.L., Gua, C.J., Xue, S.J., Ma, S.M., and Li, X.D. (2015). MicroRNA 181b promotes vascular smooth muscle cells proliferation through activation of PI3K and MAPK pathways. Int. J. Clin. Exp. Pathol. 8, 10375–10384.
Liau, J.Y., Lee, J.C., Tsai, J.H., Yang, C.Y., Liu, T.L., Ke, Z.L., Hsu, H.H., and Jeng, Y.M. (2015). Comprehensive screening of alternative lengthening of telo-meres phenotype and loss of ATRX expression in sarcomas. Mod. Pathol.28, 1545–1554.
Mariani, O., Brennetot, C., Coindre, J.M., Gruel, N., Ganem, C., Delattre, O., Stern, M.H., and Aurias, A. (2007). JUN oncogene amplification and overex-pression block adipocytic differentiation in highly aggressive sarcomas. Can-cer Cell11, 361–374.
Martin, S., Brown, W.M., Klavans, R., and Boyack, K.W. (2011). OpenOrd: An open-source toolbox for large graph layout. SPIE 7868, Visualization and Data Analysis 2011, 786806. Published January 24, 2011.https://doi.org/10.1117/ 12.871402.
McCarroll, S.A., Kuruvilla, F.G., Korn, J.M., Cawley, S., Nemesh, J., Wysoker, A., Shapero, M.H., de Bakker, P.I., Maller, J.B., Kirby, A., et al. (2008). Inte-grated detection and population-genetic analysis of SNPs and copy number variation. Nat Genet.40, 1166–1174.
McKenna, A., Hanna, M., Banks, E., Sivachenko, A., Cibulskis, K., Kernytsky, A., Garimella, K., Altshuler, D., Gabriel, S., Daly, M., and DePristo, M.A. (2010). The Genome Analysis Toolkit: a MapReduce framework for analyzing next-generation DNA sequencing data. Genome Res.20, 1297–1303.
Mermel, C.H., Schumacher, S.E., Hill, B., Meyerson, M.L., Beroukhim, R., and Getz, G. (2011). GISTIC2.0 facilitates sensitive and confident localization of the targets of focal somatic copy-number alteration in human cancers. Genome Biol.12, R41.
Mo, Q., Wang, S., Seshan, V.E., Olshen, A.B., Schultz, N., Sander, C., Powers, R.S., Ladanyi, M., and Shen, R. (2013). Pattern discovery and cancer gene identification in integrated cancer genomic data. Proc. Natl. Acad. Sci. USA 110, 4245–4250.
Niu, B., Scott, A.D., Sengupta, S., Bailey, M.H., Batra, P., Ning, J., Wyczalkow-ski, M.A., Liang, W.-W., Zhang, Q., McLellan, M.D., et al. (2016).
Protein-struc-ture-guided discovery of functional mutations across 19 cancer types. Nat. Genet.48, 827–837.
Olshen, A.B., Venkatraman, E.S., Lucito, R., and Wigler, M. (2004). Circular bi-nary segmentation for the analysis of array-based DNA copy number data. Biostatistics5, 557–572.
Pe´rot, G., Derre´, J., Coindre, J.M., Tirode, F., Lucchesi, C., Mariani, O., Gibault, L., Guillou, L., Terrier, P., and Aurias, A. (2009). Strong smooth muscle differ-entiation is dependent on myocardin gene amplification in most human retro-peritoneal leiomyosarcomas. Cancer Res.69, 2269–2278.
Pidsley, R., Y Wong, C.C., Volta, M., Lunnon, K., Mill, J., and Schalkwyk, L.C. (2013). A data-driven approach to preprocessing Illumina 450K methylation array data. BMC Genomics14, 293.
Radenbaugh, A.J., Ma, S., Ewing, A., Stuart, J.M., Collisson, E.A., Zhu, J., and Haussler, D. (2014). RADIA: RNA and DNA integrated analysis for somatic mu-tation detection. PLoS ONE9, e111516.
Ramos, A.H., Lichtenstein, L., Gupta, M., Lawrence, M.S., Pugh, T.J., Sak-sena, G., Meyerson, M., and Getz, G. (2015). Oncotator: cancer variant anno-tation tool. Hum. Mutat.36, E2423–E2429.
Reinius, L.E., Acevedo, N., Joerink, M., Pershagen, G., Dahle´n, S.E., Greco, D., So¨derha¨ll, C., Scheynius, A., and Kere, J. (2012). Differential DNA methylation in purified human blood cells: implications for cell lineage and studies on dis-ease susceptibility. PLoS ONE7, e41361.
Saunders, C.T., Wong, W.S., Swamy, S., Becq, J., Murray, L.J., and Chee-tham, R.K. (2012). Strelka: accurate somatic small-variant calling from sequenced tumor-normal sample pairs. Bioinformatics28, 1811–1817.
Schwartz, G.K., Tap, W.D., Qin, L.X., Livingston, M.B., Undevia, S.D., Chmie-lowski, B., Agulnik, M., Schuetze, S.M., Reed, D.R., Okuno, S.H., et al. (2013). Cixutumumab and temsirolimus for patients with bone and soft-tissue sar-coma: a multicentre, open-label, phase 2 trial. Lancet Oncol.14, 371–382.
Sedgewick, A.J., Benz, S.C., Rabizadeh, S., Soon-Shiong, P., and Vaske, C.J. (2013). Learning subgroup-specific regulatory interactions and regulator inde-pendence with PARADIGM. Bioinformatics29, i62–i70.
Seo, E., Basu-Roy, U., Gunaratne, P.H., Coarfa, C., Lim, D.S., Basilico, C., and Mansukhani, A. (2013). SOX2 regulates YAP1 to maintain stemness and deter-mine cell fate in the osteo-adipo lineage. Cell Rep.3, 2075–2087.
Shabalin, A.A. (2012). Matrix eQTL: ultra fast eQTL analysis via large matrix op-erations. Bioinformatics28, 1353–1358.
Shen, R., Olshen, A.B., and Ladanyi, M. (2009). Integrative clustering of multi-ple genomic data types using a joint latent variable model with application to breast and lung cancer subtype analysis. Bioinformatics25, 2906–2912.
Sioletic, S., Czaplinski, J., Hu, L., Fletcher, J.A., Fletcher, C.D., Wagner, A.J., Loda, M., Demetri, G.D., Sicinska, E.T., and Snyder, E.L. (2014). c-Jun pro-motes cell migration and drives expression of the motility factor ENPP2 in soft tissue sarcomas. J. Pathol.234, 190–202.
Smigielski, E.M., Sirotkin, K., Ward, M., and Sherry, S.T. (2000). dbSNP: a database of single nucleotide polymorphisms. Nucleic Acids Res. 28, 352–355.
Taylor, B.S., Barretina, J., Maki, R.G., Antonescu, C.R., Singer, S., and Lada-nyi, M. (2011a). Advances in sarcoma genomics and new therapeutic targets. Nat. Rev. Cancer11, 541–557.
Taylor, B.S., DeCarolis, P.L., Angeles, C.V., Brenet, F., Schultz, N., Antonescu, C.R., Scandura, J.M., Sander, C., Viale, A.J., Socci, N.D., and Singer, S. (2011b). Frequent alterations and epigenetic silencing of differentiation pathway genes in structurally rearranged liposarcomas. Cancer Discov.1, 587–597.
Tibes, R., Qiu, Y., Lu, Y., Hennessy, B., Andreeff, M., Mills, G.B., and Kornblau, S.M. (2006). Reverse phase protein array: validation of a novel proteomic tech-nology and utility for analysis of primary leukemia specimens and hematopoi-etic stem cells. Mol. Cancer Ther.5, 2512–2521.
Wang, K., Singh, D., Zeng, Z., Coleman, S.J., Huang, Y., Savich, G.L., He, X., Mieczkowski, P., Grimm, S.A., Perou, C.M., et al. (2010). MapSplice: accurate mapping of RNA-seq reads for splice junction discovery. Nucleic Acids Res. 38, e178.
Wang, G., Shen, N., Cheng, L., Lin, J., and Li, K. (2015). Downregulation of miR-22 acts as an unfavorable prognostic biomarker in osteosarcoma. Tumour Biol.36, 7891–7895.
Wilkerson, M.D., and Hayes, D.N. (2010). ConsensusClusterPlus: a class dis-covery tool with confidence assessments and item tracking. Bioinformatics26, 1572–1573.
Wilks, C., Cline, M.S., Weiler, E., Diehkans, M., Craft, B., Martin, C., Murphy, D., Pierce, H., Black, J., Nelson, D., et al. (2014). The Cancer Genomics Hub
(CGHub): overcoming cancer through the power of torrential data. Database (Oxford)2014, bau093.
Ye, K., Schulz, M.H., Long, Q., Apweiler, R., and Ning, Z. (2009). Pindel: a pattern growth approach to detect break points of large deletions and me-dium sized insertions from paired-end short reads. Bioinformatics 25, 2865–2871.
Yeung, K.Y., Fraley, C., Murua, A., Raftery, A.E., and Ruzzo, W.L. (2001). Model-based clustering and data transformations for gene expression data. Bioinformatics17, 977–987.
STAR
+
METHODS
KEY RESOURCES TABLE
REAGENT or RESOURCE SOURCE IDENTIFIER
Antibodies
RPPA antibodies RPPA Core Facility,
M. D. Anderson Cancer Center; Gonzalez-Angulo et al., 2011, PMID:21906370
https://www.mdanderson.org/research/research- resources/core-facilities/functional-proteomics-rppa-core/antibody-information-and-protocols.
htmlSeeTable S7
Biological Samples
Primary tumor samples Multiple tissue source sites, processed through the Biospecimen Core Resource
See Methods:EXPERIMENTAL MODEL AND SUBJECT DETAILS
Critical Commercial Assays
Affymetrix SNP 6.0 Arrays Affymetrix Cat#901153
EZ-96 DNA Methylation Kit Zymo Research Cat#D5004
Illumina Barcoded Paired-End Library Preparation Kit
Illumina https://www.illumina.com/techniques/sequencing/ ngs-library-prep.html
Infinium HumanMethylation450 BeadChip Kit
Illumina Cat#WG-314-1002
SeqCap EZ Human Exome 3.0 library Roche Cat#06465692001
TruSeq PE Cluster Generation Kit Illumina Cat#PE-401-3001
TruSeq RNA library Prep Kit Illumina Cat#RS-122-2001; RS-122-2002
Deposited Data
Raw and processed clinical, array, and sequence data
NCI Genomic Data Commons https://gdc-portal.nci.nih.gov/legacy-archive/ search/f
Digital Pathology Images NCI Genomic Data Commons
Cancer Digital Slide Archive
https://gdc-portal.nci.nih.gov/legacy-archive/
search/f;http://cancer.digitalslidearchive.net/
Oligonucleotides
120-mer custom capture
oligonucleotides for SNV validation
This paper http://genome.wustl.edu/pub/custom_
capture/42869_capture_set/
cdd7324ce34b49b6834c57ddd89b0e05.bed
120-mer custom capture
oligonucleotides for targeting of HBV
This paper http://genome.wustl.edu/pub/custom_
capture/HBV_IDT_probes_pooled_probes/ 40774c8461274a81b4d223161dc84936.bed
120-mer custom capture
oligonucleotides for targeting of HPV
This paper http://genome.wustl.edu/pub/custom_
capture/HPV_IDT_all_pooled_probes/ 37b1fc41fd114b64b94336ff9b4d97ae.bed
120-mer custom capture
oligonucleotides for targeting of MCPyV
This paper http://genome.wustl.edu/pub/custom_
capture/MCPyV_viral_capture_set/ fb849887d26843f4b17cd5dc464d800b.bed
120-mer custom capture
oligonucleotides for targeting of TERT promoter
This paper http://genome.wustl.edu/pub/custom_
capture/WO2830729_pooled_probes/ fe74a5ca10fc4f378a733cdfd308b130.bed
Software and Algorithms
ABSOLUTE Carter et al., 2012 RRID:SCR_005198;https://www.broadinstitute.
org/cancer/cga/absolute
Array-Pro Analyzer Media Cybernetics
Washington, DC
http://meyerinst.com/imaging-Software/image-pro/array-pro/index.htm
Bam-readcount v0.4 N/A https://github.com/genome/bam-readcount
Bayesian non-negative matrix factorization (Bayesian NMF)
Kasar et al., 2015 PMID: 26638776
Continued
REAGENT or RESOURCE SOURCE IDENTIFIER
Birdseed Korn et al., 2008 RRID:SCR_001122;https://www.broadinstitute.
org/mpg/birdsuite/birdseed.html
Bwa v0.5.9 Li and Durbin, 2009 RRID:SCR_010910;http://bio-bwa.sourceforge.net/
CASAVA Illumina RRID:SCR_001802;https://support.illumina.com/
sequencing/sequencing_software/bcl2fastq-conversion-software.html
Circular Binary Segmentation (CBS) Olshen et al., 2004 PMID:15475419
ConsensusClusterPlus Wilkerson and Hayes, 2010 http://bioconductor.org/packages/release/bioc/ html/ConsensusClusterPlus.html
ContEst Cibulskis et al., 2011 RRID:SCR_000595;https://www.broadinstitute.
org/cancer/cga/contest
Cutoff Finder Budczies et al., 2012 PMID: 23251644
Cytoscape N/A RRID:SCR_003032;http://www.cytoscape.org
DAVID Huang et al., 2009 RRID:SCR_001881;https://david.abcc.ncifcrf.gov/
Genome Analysis Toolkit (GATK) v1.0.5336
McKenna et al., 2010 RRID:SCR_001876;https://software.broadinstitute.
org/gatk
GISTIC v2.0.22 Mermel et al., 2011 RRID:SCR_000151;http://www.mmnt.net/db/0/0/
ftp-genome.wi.mit.edu/distribution/GISTIC2.0
Glmnet N/A RRID:SCR_015505https://cran.r-project.org/
package=glmnet
Heatmap.plus N/A https://CRAN.R-project.org/package=heatmap.plus
iCluster Shen et al., 2009 https://cran.r-project.org/package=iCluster
In Silico Admixture Removal (ISAR) Zack et al., 2013 PMID: 24071852
Indelocator N/A RRID:SCR_005258;https://www.broadinstitute.
org/cancer/cga/indelocator
JoinX v1.9 N/A http://gmt.genome.wustl.edu/packages/joinx/
Mapping Quality Scores (MAQ) Li et al., 2008 RRID:SCR_005485http://maq.sourceforge.net
MapSlice v0.7.5 Wang et al., 2010 RRID:SCR_010844;http://www.netlab.uky.edu/
p/bioinfo/MapSplice
MatrixEQTL v2.1.1 Shabalin, 2012 https://cran.r-project.org/web/packages/MatrixEQTL/
MClust Yeung et al., 2001 https://cran.r-project.org/package=mclust
MicroVigene VigeneTech RRID:SCR_002820;http://www.vigenetech.com/
microvigeneV3.0.htm
MuSiC2 Dees et al., 2012 https://github.com/ding-lab/MuSic2
MuTect v1.1.6 Cibulskis et al., 2013 RRID:SCR_000559;https://www.broadinstitute.org/
cancer/cga/mutect
MutSig2CV Lawrence et al., 2013 RRID:SCR_010779;http://archive.broadinstitute.org/
cancer/cga/mutsig
Oncotator Ramos et al., 2015 RRID:SCR_005183;https://www.broadinstitute.org/
cancer/cga/oncotator
NMF Gaujoux and Seoighe, 2010 https://cran.r-project.org/package=NMF
OpenOrd Martin et al., 2011 http://www.sandia.gov/smartin/software.html
PARADIGM Sedgewick et al., 2013 http://sbenz.github.io/Paradigm
pHeatmap v1.0.2 N/A https://cran.r-project.org/package=pheatmap
Picard v1.46 N/A RRID:SCR_006525;http://broadinstitute.github.io/
picard/
Pindel v.0.2.2 Ye et al., 2009 RRID:SCR_000560;http://gmt.genome.wustl.edu/
pindel/
RADIA Radenbaugh et al., 2014 https://github.com/aradenbaugh/radia/
RSEM Li and Dewey, 2011 RRID:SCR_013027;http://deweylab.biostat.wisc.
edu/rsem/