CC002/Unc
females
are
mouse
models
of
exercise-induced
paradoxical
fat
response
RachelC.McMullan1,2,3,MartinT. Ferris1,Timothy A.Bell1,3,VineetD.Menachery4, RalphS.Baric4, KunjieHua1,DanielPomp1,AbbieE.Smith-Ryan5&FernandoPardo-ManueldeVillena1,3
1 DepartmentofGenetics,SchoolofMedicine,UniversityofNorthCarolinaatChapelHill,ChapelHill,NorthCarolina
2 GeneticsandMolecularBiologyCurriculum,SchoolofMedicine,UniversityofNorthCarolinaatChapelHill,ChapelHill,NorthCarolina
3 LinebergerComprehensiveCancerCenter,UniversityofNorthCarolinaatChapelHill,ChapelHill,NorthCarolina
4 DepartmentofEpidemiology,GillingsSchoolofGlobalPublicHealth,UniversityofNorthCarolinaatChapelHill,ChapelHill,NorthCarolina
5 DepartmentofExerciseandSportScience,CollegeofArtsandSciences,UniversityofNorthCarolinaatChapelHill,ChapelHill,NorthCarolina
Keywords
Body composition, Collaborative Cross, genetic background, high intensity interval training, moderate intensity continuous training.
Correspondence
Fernando Pardo-Manuel de Villena, 5046 Genetics Medicine Building, 120 Mason Farm Road, Chapel Hill, NC 27599-7264. Tel: 919-843-5403
Fax: 919-966-0401 E-mail: [email protected]
Funding Information
This study was partially funded by grants from the National Institute of Allergy and Infectious Diseases at the National Institute of Health (AI100625 to RB, MTF, FPMV), (AI109761 to RB) and (K99AG049092 to VDM), a University of North Carolina-Chapel Hill (UNC) Nutrition Obesity Research Center (NORC) Pilot and Feasibility Grant
(P30DK056350 to ASR and FPMV), the UNC NORC Animal Metabolism Phenotyping Core Facility (NIH DK056350), and the UNC System Genetics Core Facility.
Received: 30 April 2018; Accepted: 3 May 2018
doi: 10.14814/phy2.13716
Physiol Rep, 6 (12), 2018, e13716, https://doi.org/10.14814/phy2.13716
Abstract
Exercise results in beneficial health outcomes and protects against a variety of chronic diseases. However, U.S. exercise guidelines recommend identical exer-cise programs for everyone, despite individual variation in responses to these programs, including paradoxical fat gain. Experimental models of exercise-induced paradoxical outcomes may enable the dissection of underlying physi-ological mechanisms as well as the evaluation of potential interventions. Whereas several studies have identified individual mice exhibiting paradoxical fat gain following exercise, no systematic effort has been conducted to identify and characterize models of paradoxical response. Strains from the Collabora-tive Cross (CC) genetic reference population were used due to its high levels of genetic variation, its reproducible nature, and the observation that the CC is a rich source of novel disease models, to assess the impact genetic back-ground has on exercise responses. We identified the strain CC002/Unc as an exercise-induced paradoxical fat response model in a controlled voluntary exercise study across multiple ages in female mice. We also found sex and genetic differences were consistent with this pattern in a study of forced exer-cise programs. These results provide a novel model for studies to determine the mechanisms behind paradoxical metabolic responses to exercise, and enable development of more rational personalized exercise recommendations based on factors such as age, sex, and genetic background.
ª2018TheAuthors.
2007; Gibala et al. 2012). Initial studies have demonstrated HIIT can efficiently and effectively reduce body fat (Boutcher 2011; Smith-Ryan et al. 2016) and increase lean mass (Smith-Ryan et al. 2015; Blue et al. 2018). However, individual variability in body composition responses with the presence of responders and nonresponders has been observed in HIIT, MICT and other exercise programs mak-ing it difficult to determine effective personalized exercise programs. Furthermore, initial evidence in humans sug-gests that physiological outcomes as a result of HIIT may be sex specific (Scalzo et al. 2014). It is unclear if or how genetics influences body composition in response to HIIT and MICT exercise programs (Tjonna et al. 2008; Nybo et al. 2010; Boutcher 2011; Gibala et al. 2012, 2014; Buch-heit and Laursen 2013; Weston et al. 2014; Smith-Ryan et al. 2015; Seldeen et al. 2018).
Given the complex interactions between physical activ-ity, energy intake, body composition, as well as other variables, it is difficult to determine causal factors and successful exercise regimes that elicit beneficial responses to exercise in the human population. Sets of genetically distinct inbred mouse strains can be used to assess the impact of genetic responses for all of these traits while controlling environmental variables (Kostrzewa and Kas 2013; Kelly et al. 2015). Even though it is common in human studies, especially in women, to observe exercise-induced body fat gain, no inbred mouse models exist which recapitulates these phenotypes. Most mouse studies (Nehrenberg et al. 2009; Leamy et al. 2010; Takeshita et al. 2012; Gordon et al. 2016) have only observed a standard response (body fat loss) to exercise, with the exception of some outbred mice presenting paradoxical responses (Kelly et al. 2011). A previous study used incip-ient Collaborative Cross (pre-CC) mice to examine
exer-cise-related traits and observed ~17% of the pre-CC lines
had a paradoxical response to voluntary exercise (Mathes et al. 2011). Since biological replicates within each pre-CC line were not tested, it remains unknown whether the observed paradoxical body composition responses were due to genetics, experimental noise or another underlying mechanism.
We utilized the CC population (Consortium CC, 2012; Threadgill and Churchill 2012; Bogue et al. 2015; Morgan and Welsh 2015; Srivastava et al. 2017) to determine if there are inbred strains with consistent paradoxical fat response to exercise. The CC was selected because of (1) the previously reported exercise-induced paradoxical responses in the pre-CC (Mathes et al. 2011); (2) its high genetic and phenotypic diversity (Ferris et al. 2013; Phil-lippi et al. 2013; Kelada et al. 2014; Rasmussen et al. 2014; Ferguson et al. 2015); (3) the possibility to generate biological replicates; and (4) it has proven to be a rich source for novel human disease models (Rasmussen et al.
Introduction
Exerciseisknowntohave numerouspositivehealth
bene-fits, playsa role inweight management and obesity
pre-vention, and has the potential to reduce morbidity
associated with chronic diseases (Egan and Zierath 2013;
Drenowatz 2016). Althoughexercise reduces health risks,
the effects onbody compositionare still unknown.
Exer-cise is expected to reduce body mass and fat, but
exer-cise-induced weight loss is often less than expected
(Drenowatz 2016). In both human and rodent
popula-tions, individual variation acrossa multitude of
exercise-induced responses occurs, with some individuals
experi-encingparadoxicalresponses(Goedeckeetal. 2000;
Swal-low etal. 2001; Venables et al. 2005; Barwell et al. 2009;
Garland etal. 2010;Karavirta etal. 2011;Bouchardet al.
2012; Mann etal. 2014). Even when exercise doses and
energyexpenditures are controlled, thereis large
individ-ual variation inbodymassand composition responsesto
exercise programs (Barwell etal. 2009; Kelly etal. 2011;
Blundell et al. 2015). In fact, some humans gain weight
(King etal. 2009; Drenowatz 2016) and gain body fat
(Barwell etal. 2009) in response to exercise; and similar
paradoxical responses have been observed in outbred
mice (Kelly et al. 2011). This observed variation can be
partially attributed to insufficient exercise dose, lack of
adherence, and physiological and behavioral
compen-satory adaptations (e.g., energy intake, habitual activity
levels, metabolic adaptations) (King etal. 2012;
Dreno-watz 2016). Furthermore, the individual variation in
response to exercise treatments suggests genetic variation
contributes to differences in exercise-induced responses
(BouchardandTremblay1997;Pharesetal.2004;Barwell
et al.2009;Brayet al.2009;Nehrenberget al.2009;
Gar-land etal. 2010; Booth etal. 2012; Gordon etal. 2016).
Initial studies inhumans (Bouchard and Tremblay 1997;
Phares et al. 2004; Bray et al. 2009; Garland etal. 2010;
Mitchellet al.2010)androdents(Nehrenberget al.2009;
Leamy etal. 2010; Kellyet al. 2011; Gordon et al. 2016)
have suggested that genetics contribute to
exercise-inducedbodymassandcompositionresponses.
U.S. guidelines for physical activity recommends the
same exercise programs despite age or sex(U.S.
Depart-ment ofHealth and Human Services, 2008).A moderate
intensitycontinuoustraining(MICT)programconsistsof
continuous exercise at a moderate intensity and closely
resemblesrecommendedphysicalactivityguidelines.
Alter-natively, exercise programs can vary in intensity,such as
high intensity interval training (HIIT), which consists of
exercising at intervals ofhigh intensity followed byshort
periods oflowintensityorrest. HIITprogramsare
time-efficientalternativestoMICTandhavebeenshowntoelicit
experiment two mice died of unrelated causes, one CC040/ TauUnc from the control cohort and one CC030/GeniUnc from the experimental cohort (these mice were only used in the baseline phenotypic analysis).
Mice in the experimental cohort were individually housed in standard laboratory cages with ad libitum access to attached running wheels (1.1 m circumference; Lafayette Industries Lafayette, IN; (McMullan et al. 2016)). Mice in the experimental cohort were given access to wheels imme-diately after transfer to cages with attached wheels. Wheel running data were recorded continuously in 1-min interval over a 2-week period using an automated activity wheel monitoring program (AWM, Lafayette Industries, Lafay-ette, IN). The following physical activity measurements were obtained for each day of wheel access: distance (total
revolutions91.1 m), duration (cumulative 1-min interval
in which at least 1 revolution was recorded), and average speed (total distance/total duration; m/min) (Kelly et al.
2012). For days 11–12 of wheel access, the mean total
dis-tance, duration, and average speed were calculated for each mouse. Mice in the control cohort were group housed (or single housed in select cases when all other cage mates were assigned to the experimental cohort) for the 2 weeks.
CC002/Unc model validation
Female mice (n=12 per strain; born September to
Octo-ber 2016) from CC002/Unc and CC037/TauUnc were used to assess robustness of the CC002/Unc model at a
younger age (~4 months2 weeks). Mice were assigned
to control (CC002/Unc n=3; CC037/TauUnc n =5) or
experimental (CC002/Unc n =9; CC037/TauUnc n =7)
cohort. Both cohorts were acclimated for 2 weeks to sin-gle housing with attached wheels in same vivarium room but without access to wheels. After acclimation, mice in the experimental cohort were given ad libitum access to running wheels for 8 weeks. The control cohort did not have access to running wheels. Experimental procedures for running wheel data collection and physical activity calculations follow those detailed in the “Voluntary exer-cise screen” section above. Total weekly distance, total weekly duration and average weekly speed were calculated for each 2-week interval of wheel access and were labeled
1, 2, 3, and 4 (weeks 1–2, weeks 3–4, weeks 5–6, weeks 7–
8 of wheel access, respectively).
Exercise program evaluation
Strain selection
Four strains were selected based on the following criteria: (1) ability to run on treadmills, (2) fat response type to voluntary exercise, (3) endurance ability (MPD datasets:
2014; Rogalaet al. 2014).We expected variation in
exer-cise phenotypes among CC strains to be comparable to
variation observedin the human population (Kelly et al.
2015), and to provide strain(s) that can serveas models
ofexercise-inducedparadoxicalfatresponse.
Here, we report the results of three independent but
relatedexperimentsinCCmice:ascreenforvariabilityin
responses to voluntary exercise; validation of strain
CC002/Unc as a model for paradoxical response; and
finally,anevaluationofmetabolicresponsefortwo
differ-ent exercise programs. These studies aimed to identify
potential CC strains with exercise-induced paradoxical
body composition response for model development and
for understanding genetic background contribution on
physiologicalresponsestodifferentexerciseprograms.
Materials
and
Methods
Each section is dividedinto subsections forthefollowing
experiments: (1) Voluntary exercise screen; (2) CC002/
Uncmodelvalidation;(3)Exerciseprogramevaluation.
Miceandexercisetreatment
All mice werepurchasedfrom theSystems GeneticsCore
Facility (http://csbio.unc.edu/CCstatus/index.py) and
housedintheDivision ofComparative Medicinefacilities
at the University of North Carolina at Chapel Hill. All
procedures performed within this experiment were
approved by the University of North Carolina – Chapel
Hill Institutional Animal Care and Use Committee
(IACUC #15-015). Mice were housed in a
temperature-controlled (231°C) and humidity-controlled vivarium
with a standard 12:12h light:dark cycle (lights on at
0700 h).Mice wereallowedadlibitum accesstostandard
laboratory chow (Tekland2920X irradiated rodent chow,
Envigo, Princeton, NJ; diet consists of 24% of calories
from protein, 16% ofcalories from fatand 60% of
calo-riesfromcarbohydrates)andwater.
Voluntaryexercisescreen
Female mice (n =173 total mice; ~9months4weeks)
from13CCstrainswereusedinthisscreenandarealsopart
ofanongoingagingstudyatUNC.CCstrainswereselected
based on availability of at least 15 age-matched females
(bornApriltoOctober2015).Femaleswereselecteddueto
theneedtogrouphousethemiceduringtheagingprocess.
Mice were assigned to experimental (voluntary exercise;
n =93)orcontrol(noexercise;n =80)treatment cohorts
priortothestartoftheexperiment(n=4–8perstrainand
treatment). The experiment was performedin sixbatches
experiment was performed in five batches. Every strain, sex, exercise program combination was represented at
least once in each batch for batches 1–4. In order to
increase biological replicates, an additional batch (batch 5) was added. Batch 5 consisted of CC002/Unc females, CC027/GeniUnc females, CC037/TauUnc females, CC027/ GeniUnc males, and CC037/TauUnc males (for females
HIIT n=8 & MICT n =8 per strain; for males HIIT
n =3 & MICT n=3 per strain). Across all batches,
within each home cage, there was one mouse randomly assigned to each of the three exercise programs (HIIT, MICT, and no exercise [NE]) to avoid confounding cage effects with exercise program effects (with the exception of batch 5 which consisted of only HIIT and MICT
pro-grams). In five cases (for batches 1–4) more than three
mice were group housed in one cage.
Mice completed 5 weeks of exercise training on the Exer-3/6 treadmills (Columbus Instruments, Columbus, Ohio). Mice assigned to both HIIT and MICT training pro-tocols were acclimated to the treadmills for 3 days during the first week (Table S1). After acclimation, HIIT and MICT mice completed 4 weeks of training, three times a week of their respective training protocol (Table S3). All training occurred in the morning and mice were randomly assigned to a treadmill lane each training day. Compliance was tracked over the full 15 days of exercise training and mice with 50% or more noncompliant days were removed from statistical analysis. A mouse was considered noncom-pliant if it refused or was not able to continue regular treadmill running despite extra stimulus from shock and/or prodding. All noncompliant and dead mice were removed from the analysis and are not included in the presented data or sample sizes. Ten noncompliant mice were removed (two CC002/Unc females HIIT; two CC002/Unc males HIIT; three CC013/GeniUnc females HIIT; two CC027/ GeniUnc females HIIT; one CC027/GeniUnc female MICT). Five mice died during the experiment and were removed (one CC013/GeniUnc female HIIT; one CC027/ GeniUnc male MICT; one CC027/GeniUnc female HIIT; two CC037/TauUnc females HIIT).
Metabolic measurements
In all experiments, body composition was assessed
(dur-ing morn(dur-ings 0700–1200 h) using whole-body MRI
(EchoMRI 3-in-1 Body Composition Analyzer, EchoMRI, Houston, TX) to determine fat and lean mass content (in grams) for each animal.
Voluntary exercise screen
Body mass and composition were measured immediately prior to the start of the experiment (prior to cage
McMullan1, McMullan2, McMullan3; Experiment
“Vol-untary exercise screen”; all data was collected in older
females). Selected strains were: CC002/Unc paradoxical
fat responder, low endurance; CC027/GeniUnc
paradoxi-cal fat responder, high endurance; CC013/GeniUnc
stan-dard fat responder, low endurance; and CC037/TauUnc
standardfatresponder,highendurance.
Maximumendurancespeed
To assess maximum endurance speed, mice from the
selected strains (n =3 per sex and strain) were group
housed with the same sex and strain. Mice were
accli-matedto thetreadmill(Exer 3/6,ColumbusInstruments,
Columbus, Ohio) over 3days (Table S1). Then, mice
were run to exhaustion using the following endurance
protocol performed at 20° inclination: initial speed was
4m/min, increased by 2m/min every 2min then at
12m/min the speedincreased by1m/min everyminute.
The endurance protocol was performed twice on each
mouse on two separate days and maximum speed (m/
min) was recorded for both days. Maximum speed was
defined as thelast speedthe mousewasable tomaintain
steady treadmill running before failure. Failure was
defined as theinabilityorrefusal torunon thetreadmill
despite stimulus via shock grid or prodding. The mean
maximum speed was calculated for each sex and strain
combination(TableS2).
Exerciseprogram protocoldesign
Strain- and sex-specific training protocols (HIIT and
MICT)weredesignedbasedonthemeasuredmean
maxi-mumspeeds.Therewerefiveseparate exercisegroups:(1)
CC002/Unc females; (2) CC013/GeniUnc females; (3)
CC027/GeniUncand CC037/TauUnc females;(4) CC002/
Uncand CC013/GeniUncmales;and(5) CC027/GeniUnc
and CC037/TauUnc males. The HIIT protocols consisted
offiveintervalswith 80%maxspeedfor4min,20%max
speed for 1min, and ten 30sec transitions to decrease
and increase speed between the different intensities. The
MICT protocolswere distancematched tothe HIIT
pro-tocols and consisted of ~43min duration at 50% max
speed(TablesS2andS3).
Exerciseprogram evaluation
Mice (n= 252totalmice;n =minimum8persex,strain
and exercise treatment combination; age: 8–10weeks at
start; born between March toAugust 2016 and February
to March 2017) from CC002/Unc, CC013/GeniUnc,
CC027/GeniUnc and CC037/TauUnc were housed with
values represent a loss and positive values represent a gain in response to treatment. Food intake was calculated as the differential between baseline and postexercise food weights (g). Adjusted food intake was calculated as the food intake relative to the baseline body mass.
Voluntary exercise screen
Body mass and composition responses for both cohorts were calculated for the 2 weeks of treatment. Adjusted body mass and composition responses were calculated for the experimental cohort.
CC002/Unc model validation
For each mouse, cumulative body mass and composition responses were calculated for every experimental time
point interval (1–4; weeks 0–2, weeks 0–4, weeks 0–6, and
weeks 0–8 of treatment, respectively). Adjusted
cumula-tive body mass and composition responses were calcu-lated for the experimental cohort at each time point interval. Adjusted food intake was calculated for each interval.
Exercise program evaluation
Body mass and composition responses were calculated for the 5 weeks of exercise program treatment. Adjusted body mass and composition responses were calculated for HIIT and MICT mice. Calorimetry data collected from 0700 to 1100 h (day) and 1900 to 2300 h (nocturnal) were used to calculate the following traits for each mouse for both day and nocturnal values (at baseline and posttreatment):
mean VO2 intake, mean VCO2 output, mean RER, total
activity, mean heat production, food intake, and water intake.
Statistical analysis
All statistical analyses were performed in the R program-ming environment (https://cran.r-project.org). Descriptive statistics (mean, variance, coefficient of variance, standard deviation, and standard error) were calculated for
pheno-types across CC strain (Tables S4–S8). Pearson’s
correla-tions were calculated for the relacorrela-tionship between body mass and composition responses and potential mediators (physical activity traits and adjusted food intake). Heri-tability of body mass and composition response in the voluntary exercise screen was measured by inter-class cor-relation (icc) and the coefficient of genetic determination (cgd) (Petkova et al. 2008). In order to determine poten-tial mediators of the physiological responses between strains, we utilized a nested ANOVA framework to
transfer), and following the 2-week experiment for all
cohorts. Foodwas weighedprior to and afterthe
experi-mentfortheexperimentalcohort.Topreventvariationin
food intake due to food wastage, any food spillage was
collected and weighed (Koteja et al. 2003). Food intake
for the control cohort was not tracked as a result of
grouphousing.
CC002/Uncmodelvalidation
Bodymassandcompositionweremeasuredevery2weeks
overthe10weeks oftheexperimentforallcohorts.Food
wasweighedatthesametimepointsasbodycomposition
forbothcontrolandexperimental cohorts.
Exercise program evaluation
Metabolicmeasurements andbodymassandcomposition
were measured prior to the start of the experiment and
upon completionofexercisetraining.Metabolic
measure-ments were assessed by indirect calorimetry
(PhenoMas-ter,TSE systems,Chesterfield,MO).Foreachbatch,mice
were randomlyassigned to a calorimetry batch (A, B,or
C) and calorimetry cage (1–24). Calorimetry data
recordedincluded: oxygen consumption (VO2; mL/h/kg),
carbon dioxide output (VCO2; mL/h/kg), activity
(counts), food weight (g), water volume (mL), and heat
production (kcal/h/kg). Respiratoryexchange ratio (RER;
VCO2/VO2) was calculated at each collection point. To
acclimate to single housing, mice were individually
housed for 24h prior to the start of the indirect
calorimetry. Mice were then individually housed in
calorimetry cages for 24hand data wererecorded every
~50min for each calorimetry cage. After, mice were
returnedtotheirassignedgrouphousing.
Metabolic calculations
Body fat and lean mass percentages were calculated
rela-tivetobodymassateachtimepointineveryexperiment.
Bodymassresponsewascalculatedas[(Post-mass
pre-mass)/pre-mass]9 100. Body composition percentage
response was calculated as [(postmeasurement
% premeasurement %)/premeasurement %] 9 100.
Bodymassandcompositionresponsesforindividualmice
in the experimental cohort (or HIIT, MICT) were
adjusted to the mean strain (or strain-by-sex) responses
inthecontrolcohort(orNE)toaccountforexperimental
variability between cohorts (e.g., adjusted body mass
response=[individual body mass response control
cohort strain mean body mass response]; adjusted body
fat%response=[individualbodyfat%response
(lost body fat), and three strains had a significant stan-dard lean mass response (gained lean mass). In the exper-imental cohort (voluntary exercise), six CC strains had a significant body mass loss, seven strains had a significant standard body fat response, and nine CC strains had a significant standard lean mass response (Fig. 1, Table S4). In order to determine the effect of exercise independent of aging, the responses in the experimental cohort were adjusted to the mean strain responses in the control cohort. In the experimental cohort, six strains had a sig-nificant standard adjusted body mass response (Fig. 2A). Eight CC strains had a significant standard adjusted body fat response to exercise treatment. CC072/TauUnc had no significant change in mean body fat as there was great individual variability within the strain. CC002/Unc had a significant paradoxical adjusted fat response (mean:
25.6%; range: 5.78% to +82.06%, nominal P=0.028)
(Fig. 2B). Tukey’s post hoc analysis revealed CC002/Unc experimental mice had unadjusted body fat responses sig-nificantly different from CC001/Unc, CC030/GeniUnc, CC033/GeniUnc, CC037/TauUnc, and CC042/GeniUnc
experimental mice (adjusted P< 0.05). Eight CC strains
had a significant standard adjusted lean mass response and one strain, CC002/Unc, had a significant paradoxical
adjusted lean mass response (nominal P=0.015)
(Fig. 2C, Table S4).
Other traits varied significantly by genetic background
(running distance nominal P=0.0025; duration nominal
P=0.018; speed nominal P<2.79 10 6; adjusted food
intake nominal P= 0.0001) (Figs. S1 and S2, Table S5).
Therefore, phenotypic correlations were used to assess whether these potential mediators were associated with body mass and composition responses. Running duration was significantly and negatively correlated with body mass
(r= 0.211) and body fat response (r= 0.223). Mean
speed was significantly correlated with body fat response
(r= 0.206). All physical activity traits had significant
positive correlations with lean mass response (distance
r=0.244, duration r=0.266, speed r= 0.278). Adjusted
food intake was significantly correlated with body mass
response (r =0.755), although this is not surprising since
adjusted food intake is calculated by dividing food intake
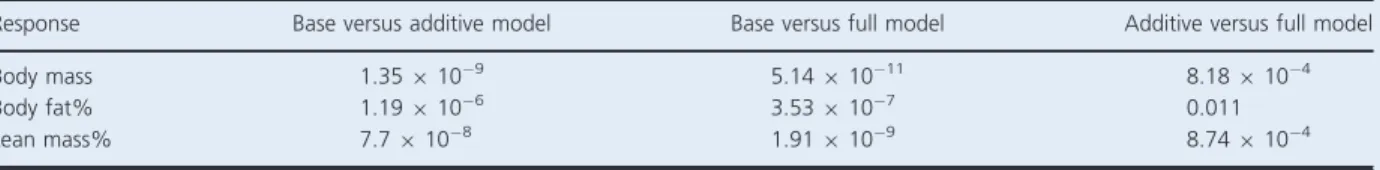
Table 1. NominalP-values from nested ANOVA analysis of treatment cohort and genetic background effect on body mass and composition response. Base models included treatment cohort as a fixed effect. Additive models included treatment cohort and genetic background as an additive effect. Full models included treatment cohort effect, genetic background effect and their interaction.
Response Base versus additive model Base versus full model Additive versus full model
Body mass 1.35910 9 5.14910 11 8.18910 4
Body fat% 1.19910 6 3.53910 7 0.011
Lean mass% 7.7910 8 1.91910 9 8.74910 4
identify the set of explanatory variables (e.g., treatment,
genetic background, sex, metabolic responses), which
robustlyexplainvariationinthephysiologicalresponses.
Dataavailability
All data are publically available at the Mouse Phenome
Database(https://phenome.jax.org). DatasetsMcMullan1–
3 contain forced endurance abilities, voluntary exercise
abilities and body mass and composition responses to
voluntary exercise in aged females from ~50 CC strains.
These datasets were used to select strains for experiment
3 presented here. The data presented in this paper is
availableindatasets: McMullan4–7.DatasetsMcMullan4–
7 contains all raw data and experimental variables for
each individual mouse in each of the three separate
experiments presented. CC strain information is located
at: http://csbio.unc.edu/CCstatus/index.py (Morgan and
Welsh2015;Srivastavaet al.2017).
Results
Screenforvoluntaryexercise-induced
paradoxicalbodycompositionrespondersin agedCCfemales
In ascreenof13CCstrains,bodymassand composition
responsesto2weeks oftreatment(controlor
experimen-tal) were measured in ~9-month-old females. Exercise
had a significant effect on body mass and composition
responses (P< 1.09 10 5), but genetic background had
a greater contribution(Table1).All responses were
heri-table (cgd=31.0%, icc=47.4% body mass response;
cgd=22.4%, icc=36.8% body fat response; and
cgd=26.3%, icc= 41.7% lean mass response).
Further-more,there weresignificant genetic
background-by-treat-ment interactions on bodymass, body fatand lean mass
responses (nominal P=5.1 9 10 11, P=3.59 10 7,
andP=1.9 9 10 9,respectively,Table 1).
In the control cohort(no exercise),three strains had a
significantstandardbodymassresponse(lostbodymass),
Control Experimental
20 10 0 10 20
CC039/Unc
CC033/GeniUnc CC037/T
auUnc
CC030/GeniUnc CC042/GeniUnc CC004/T
auUnc
CC001/Unc
CC040/T
auUnc
CC032/GeniUnc CC043/GeniUnc CC072/T
auUnc
CC041/T
auUnc
CC002/Unc CC039/Unc CC033/GeniUnc CC037/T
auUnc
CC030/GeniUnc CC042/GeniUnc CC004/T
auUnc
CC001/Unc
CC040/T
auUnc
CC032/GeniUnc CC043/GeniUnc CC072/T
auUnc
CC041/T
auUnc
CC002/Unc
CC Strain
Body mass
response (%)
A
Control Experimental
100 0 100
CC039/Unc
CC033/GeniUnc CC037/T
auUnc
CC030/GeniUnc CC042/GeniUnc CC004/T
auUnc
CC001/Unc
CC040/T
auUnc
CC032/GeniUnc CC043/GeniUnc CC072/T
auUnc
CC041/T
auUnc
CC002/Unc CC039/Unc CC033/GeniUnc CC037/T
auUnc
CC030/GeniUnc CC042/GeniUnc CC004/T
auUnc
CC001/Unc
CC040/T
auUnc
CC032/GeniUnc CC043/GeniUnc CC072/T
auUnc
CC041/T
auUnc
CC002/Unc
CC Strain
Body f
at
response (%)
B
Control Experimental
10 0 10 20 30
CC039/Unc
CC033/GeniUnc CC037/T
auUnc
CC030/GeniUnc CC042/GeniUnc CC004/T
auUnc
CC001/Unc
CC040/T
auUnc
CC032/GeniUnc CC043/GeniUnc CC072/T
auUnc
CC041/T
auUnc
CC002/Unc CC039/Unc CC033/GeniUnc CC037/T
auUnc
CC030/GeniUnc CC042/GeniUnc CC004/T
auUnc
CC001/Unc
CC040/T
auUnc
CC032/GeniUnc CC043/GeniUnc CC072/T
auUnc
CC041/T
auUnc
CC002/Unc
CC Strain
Lean mass
response (%)
C
Figure 1. Body mass and composition response to 2 weeks of treatment in aged females across 13 CC strains. Body mass response (%) (A), body fat percentage response (%) (B) and lean mass percentage response (%) (C) over 2 weeks of treatment in both control and experimental
treatment cohorts (n=4–8 per treatment and strain; age~9 months). Each dot represents an individual female mouse. Strains are ordered by
by baseline body mass. Adjusted food intake was also
sig-nificantly correlated with lean mass response
(r = 0.665) and body fat response (r= 0.411) (Table 2).
While potential mediators were correlated with responses, genetic background had a more significant contribution than any mediator alone to body mass and composition responses. There was a significant genetic background-by-adjusted food intake interaction on fat response (nominal
P=0.018, Table 3).
Further characterization of CC002/Unc as a model for exercise-induced paradoxical fat response
To determine whether the CC002/Unc model of exercise-induced paradoxical body composition response extended beyond aged females, the model was tested in younger
females. The experiment was performed in ~4-month-old
females from CC002/Unc and CC037/TauUnc, the latter –20
–10 0 10 20
CC039/Unc
CC033/GeniUnc CC037/T
auUnc
CC030/GeniUnc CC042/GeniUnc CC004/T
auUnc
CC001/Unc
CC040/T
auUnc
CC032/GeniUnc CC043/GeniUnc CC072/T
auUnc
CC041/T
auUnc
CC002/Unc
CC Strain
Adjusted body mass
response (%)
A
0 100
CC039/Unc
CC033/GeniUnc CC037/T
auUnc
CC030/GeniUnc CC042/GeniUnc CC004/T
auUnc
CC001/Unc
CC040/T
auUnc
CC032/GeniUnc CC043/GeniUnc CC072/T
auUnc
CC041/T
auUnc
CC002/Unc
CC Strain
Adjusted body f
at
response (%)
B
–10 0 10 20
CC039/Unc
CC033/GeniUnc CC037/T
auUnc
CC030/GeniUnc CC042/GeniUnc CC004/T
auUnc
CC001/Unc
CC040/T
auUnc
CC032/GeniUnc CC043/GeniUnc CC072/T
auUnc
CC041/T
auUnc
CC002/Unc
CC Strain
Adjusted lean mass
response (%)
C
Figure 2. Exercise-induced body mass and composition response in aged females across 13 CC strains. Adjusted body mass response (%) (A), adjusted body fat percentage response (%) (B) and adjusted lean mass percentage response (%) (C) to 2 weeks of wheel access in the
experimental cohort (n=5–8 per strain; age~9 months). Responses are adjusted to strain mean responses in the control cohort. Each dot
strain had a standard response at ~9 months. There was no significant effect of treatment, genetic background or genetic background-by-treatment interaction on body mass or body composition response to 2 weeks of treat-ment in young CC002/Unc and CC037/TauUnc females. Despite the lack of statistical significance, the direction and magnitude of fat response to 2 weeks of exercise was consistent between young and old CC002/Unc females. Young CC002/Unc females in the experimental cohort had a 28.94% mean unadjusted gain of body fat (range:
14.7–70.7%) and a 19.73% mean adjusted gain of body
fat (range: 23.9–61.5%). CC002/Unc mice had a lower
baseline body fat percentage in young (mean 10.4%) compared to old (mean 16.8%) females. Additionally, adjusted food intake was greater in young females (mean 2.2) than old females (mean 1.85). Younger CC002/Unc
mice ran approximately the same mean distance
(4.51 km), but at lower mean speed (15.7 m/min) and
greater mean duration (279.1 min) than old mice (mean distance 4.49 km, speed 17.8 m/min, duration 248.6 min)
on days 11–12. Initial body fat response to 2 weeks of
voluntary exercise in young CC037/TauUnc females was not the same direction or magnitude as body fat response observed in old females (young: 6.68% unadjusted,
1.93% adjusted; old: 43.64% unadjusted, 37.85%
adjusted mean body fat response) (Fig. S3, Tables S4–S6).
Cumulative body mass and composition response was also measured over 8 weeks of treatment to assess the effect of additional exercise on physiological responses. For cumulative body mass response, there was no signifi-cant effect of time point, treatment, genetic background and all their interactions. There was a significant additive effect of time point and genetic background on
cumula-tive fat response (nominal P=0.0018) and cumulative
lean mass response (nominal P=0.0471) demonstrating
body composition responses varied by time point and genetic background. There was no significant effect of treatment on cumulative fat or lean mass response over time. Young experimental CC002/Unc females had an increase in paradoxical fat response over the 8 weeks of wheel access with a mean unadjusted cumulative fat
response of 28.9, 20.3, 25.6, and 32.0% for weeks 0–2, 0–
4, 0–6, and 0–8. In the CC002/Unc control cohort, mean
unadjusted cumulative fat response increased over time intervals (9.2, 16.9, 23.6, and 30.9%). CC037/Tau mean cumulative fat response fluctuated over 8 weeks in
experi-mental females (6.68, 5.6, 17.9, and 0.19% for weeks 0–
Table 2. Pearson’s correlations between body mass and composi-tion response and potential mediators.
Responses Body mass Body fat % Lean mass %
Distance (days 11–12) 0.144 0.202 0.244
Duration (days 11–12) 0.211 0.223 0.266
Speed (days 11–12) 0.17 0.206 0.278
Adjusted food intake 0.755 0.411 0.665
Food intake 0.584 0.514 0.581
Significant correlations (nominalP<0.05) are highlighted in gray.
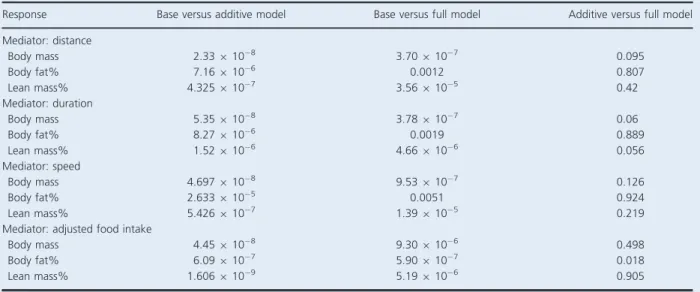
Table 3. Nominal P-values from nested ANOVA analysis of potential mediators and genetic background on body mass and composition response within the experimental cohort.
Response Base versus additive model Base versus full model Additive versus full model
Mediator: distance
Body mass 2.33910 8 3.70910 7 0.095
Body fat% 7.16910 6 0.0012 0.807
Lean mass% 4.325910 7 3.56910 5 0.42
Mediator: duration
Body mass 5.35910 8 3.78910 7 0.06
Body fat% 8.27910 6 0.0019 0.889
Lean mass% 1.52910 6 4.66910 6 0.056
Mediator: speed
Body mass 4.697910 8 9.53910 7 0.126
Body fat% 2.633910 5 0.0051 0.924
Lean mass% 5.426910 7 1.39910 5 0.219
Mediator: adjusted food intake
Body mass 4.45910 8 9.30910 6 0.498
Body fat% 6.09910 7 5.90910 7 0.018
Lean mass% 1.606910 9 5.19910 6 0.905
intake increased during the first 2 weeks of wheel access in both cohorts and strains relative to food intake during sin-gle housing acclimation. Fluctuations in food intake were observed over the course of treatment in both cohorts and strains (Fig. S6). The fluctuations in physical activity levels and food intake over the course of treatment are important since energy expenditure and energy intake contribute to body mass and composition responses.
Control Experimental
–10 0 10
–10 0 10
CC002/Unc
CC037/T
auUnc
1 2 3 4 1 2 3 4
Timepoint
Body mass response (%)
A
Control Experimental
–50 0 50
–50 0 50
CC002/Unc
CC037/T
auUnc
1 2 3 4 1 2 3 4
Timepoint
Body f
at response (%)
B
Control Experimental
–5 0 5
–5 0 5
CC002/Unc
CC037/T
auUnc
1 2 3 4 1 2 3 4
Timepoint
Lean mass response (%)
C
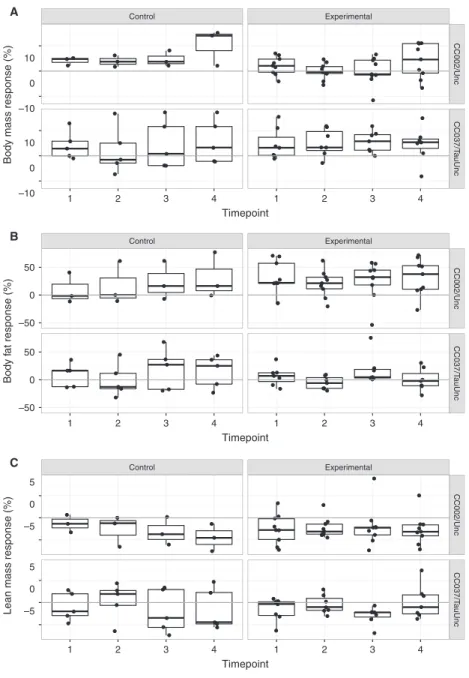
Figure 3. Cumulative body mass and composition response to treatment over 8 weeks in CC002/Unc and CC037/TauUnc. Body mass response (%) (A), body fat percentage response (%) (B) and lean mass percentage response (%) (C) for each 2 week interval of the experiment in both
control and experimental treatment cohorts (n=3–9 per treatment and strain; age~4 months). Each dot represents an individual female
mouse. Each response is calculated for a 2 week interval. Responses are represented as timepoint intervals: timepoint 0 (single housing
acclimation), 1 (weeks 0–2 of treatment), 2 (weeks 2–4 of treatment), 3 (weeks 4–6 of treatment), and 4 (weeks 6–8 of treatment).
2,0–4,0–6,and0–8)and incontrolfemales(8.65, 0.77,
19.04,and14.8%)(Fig.3,Fig.S4,TableS6).
Total distance and duration inthe CC002/Unc
experi-mental femalesdecreased duringweeks 1–4toweeks 4–8.
Meanspeedremainedstableover8weeksofwheelaccess.
CC037/TauUnc experimental females had stable running
duration,butincreasedinmeanspeedanddistanceduring
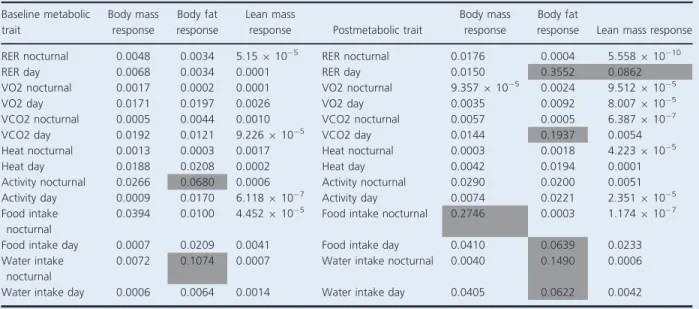
All baseline metabolic variables (RER, VO2, VCO2,
activity, heat, food intake, and water intake) during both nocturnal and daytime were under genetic control
(nomi-nal P<0.05). Baseline metabolic variables were not more
predictive than genetic background for body mass and composition responses to exercise programs. However, baseline nocturnal activity and nocturnal water intake were as predictive as genetic background for body fat response (Table 6). Pearson’s correlations revealed base-line nocturnal activity was positively and significantly
cor-related with body fat response (r =0.185, nominal
P=0.0035). These observations indicate baseline
noctur-nal activity levels are predictive of fat response to exercise. Whereas, baseline nocturnal water intake was not
signifi-cantly correlated with body fat response (r= 0.067,
nominal P=0.29) indicating that water intake is not
likely casual of body fat response to exercise and instead may be confounded. After exercise training, metabolic variables during both nocturnal and day time were under
genetic control (nominal P<0.05) with the exception of
nocturnal RER (nominal P=0.459), day VO2 (nominal
P=0.069) and day heat production (nominalP= 0.056).
In some cases post metabolic traits were just as predictive as genetic background for body fat response (Table 6). This observation is likely due to the fact that the meta-bolic traits are genetically regulated.
Discussion
CC002/Unc is a model for exercise-induced paradoxical body composition response
One previous study that reported an exercise-induced paradoxical response in 17% of partially inbred mice (Mathes et al. 2011), only examined one individual mouse per genotype in the pre-CC population, which limited the ability to assess genetic control of this trait. In contrast, our study used replicate inbred animals from the CC population with both sedentary control and vol-untary exercise cohorts. The most significant finding was that CC002/Unc, one of the 13 CC strains screened in the initial study, had a voluntary exercise-induced paradoxical body composition response among old females. It is pos-sible that CC002/Unc overcompensates with food intake in response to exercise driving the observed paradoxical response, but this may not be the only factor or driving factor contributing to the paradoxical response. Food intake varied significantly by genetic background and there was a significant genetic background-by-adjusted food intake interaction on fat response. Thus, these find-ings suggest genetic background, including food intake, are driving the paradoxical response in old CC002/Unc females. For example, a standard response was observed Effectofexerciseprogramonbody
compositionresponseacrossbothsexes and differentgeneticbackgrounds
We selected four CCstrains (see Materialsand Methods)
tomeasuretheeffects ofgeneticbackground,sexand two
types of forced exercise programs (HIIT and MICT) on
exercise-induced metabolic responses. Overall, exercise
programs, HIIT and MICT, significantly reduced body
mass relative to NE programs (nominal
P=6.829 10 12; HIIT-NE adjusted P<1.09 10 7;
MICT-NEadjusted P=3.09 10 7).Bodymassresponse
in mice exposed to HIIT was not significantly different
from body mass response in mice exposed to MICT.
Geneticbackground-by-exerciseprogramhadasignificant
interaction on body mass response (nominal P=0.007)
indicating that body mass response varied by exercise
program dependent on genetic background. Body mass
responsewasnot significantlymodifiedbysex;thus,both
males and females had similar mass response (Figs. 4A
and5A,Tables4and5,TableS8).
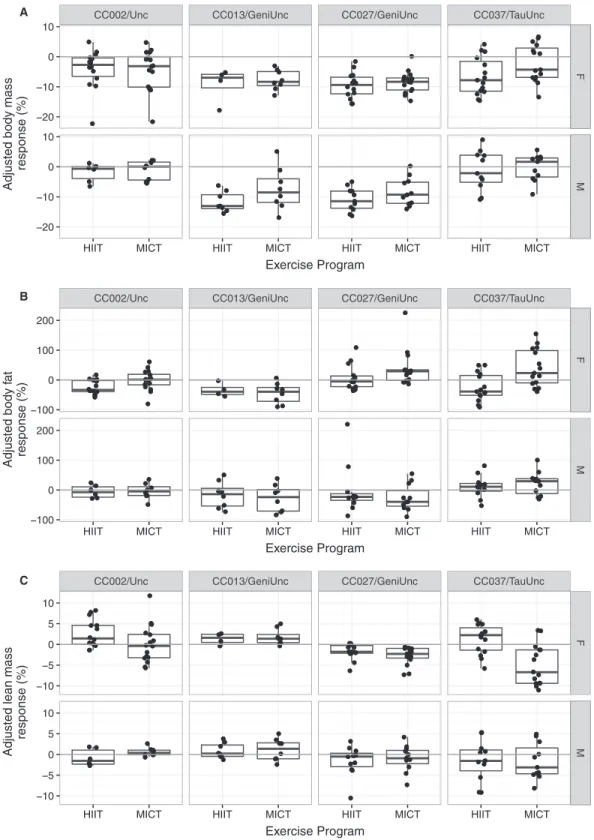
Exercise programs weresuggestive ofbodyfat
percent-age response (nominal P=0.063), but the interaction
betweenexercise programand sex hada significant effect
on body fat percentage response (nominal P =0.039).
Specifically, body fat response varied between HIIT and
MICT programsamong females(adjusted P=0.01).
Fur-thermore, there was a significant genetic
background-by-exercise program-by-sex interaction effect on body fat
percentage response (nominal P=0.0002). CC002/Unc
femaleshadasignificantstandardadjustedfatresponseto
HIIT(mean 24.37%,nominalP=0.002)butno
signifi-cant change in adjusted fat response to MICT (mean
1.0%, nominalP=0.906).CC027/GeniUncfemales had
a significant paradoxical adjusted fat response to MICT
(mean 38.01%, nominal P= 0.028) but no significant
adjusted fat response to HIIT (mean 6.55%, nominal
P=0.571). Unlike females, males demonstrated similar
fatresponsestobothHIITandMICT programs(Figs. 4B
and5B, Tables4and5,TableS8).
Exerciseprogram(nominalP=0.011),andthe
interac-tion between exercise program and sex (nominal
P=0.0109),hadasignificanteffectonleanmass
percent-ageresponse.Again,thedifferencesinleanmassresponse
toHIITand MICTprogramsinfemalesweredrivingthis
significant interaction (adjusted P= 6.979 10 4). There
was a significant genetic background-by-exercise
pro-gram-by-sexinteraction onleanmasspercentageresponse
(nominal P=0.009). CC027/GeniUnc females had a
sig-nificantparadoxicalleanmassresponsetobothHIIT
(ad-justed mean 1.70%, nominal P=0.004) and MICT
(adjusted mean 2.78%, nominal P=0.0002) programs
CC002/Unc CC013/GeniUnc CC027/GeniUnc CC037/TauUnc
0 10 20
0 10 20
F
M
HIIT MICT NE HIIT MICT NE HIIT MICT NE HIIT MICT NE
Exercise Program
Body mass response (%)
CC002/Unc CC013/GeniUnc CC027/GeniUnc CC037/TauUnc
0 100 200
0 100 200
F
M
HIIT MICT NE HIIT MICT NE HIIT MICT NE HIIT MICT NE
Exercise Program
Body f
at response (%)
CC002/Unc CC013/GeniUnc CC027/GeniUnc CC037/TauUnc
15 10 5 0 5 10
15 10 5 0 5 10
F
M
HIIT MICT NE HIIT MICT NE HIIT MICT NE HIIT MICT NE
Exercise Program
Lean mass response (%)
A
B
C
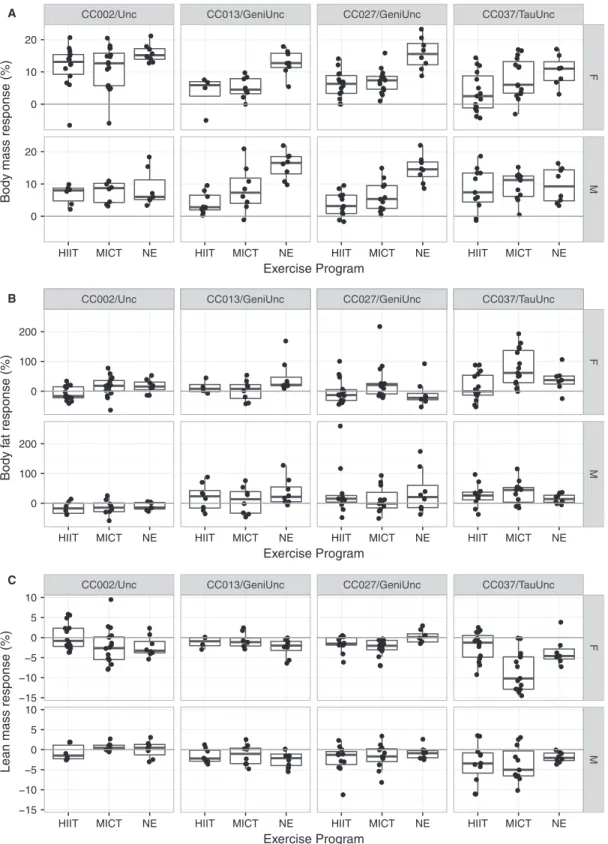
Figure 4. Body mass and composition response to exercise programs in four CC strains. Body mass response (%) (A), body fat percentage
response (%) (B) and lean mass percentage response (%) (C) to 5 weeks of exercise program training (n=4–16 per treatment, sex and strain;
age~8 weeks at start). Top panels are only female mice (F) and bottom panels are only male mice (M). Each dot represents an individual
CC002/Unc CC013/GeniUnc CC027/GeniUnc CC037/TauUnc
20 10 0 10
20 10 0 10
F
M
HIIT MICT HIIT MICT HIIT MICT HIIT MICT
Exercise Program
Adjusted body mass
response (%)
CC002/Unc CC013/GeniUnc CC027/GeniUnc CC037/TauUnc
100 0 100 200
100 0 100 200
F
M
HIIT MICT HIIT MICT HIIT MICT HIIT MICT
Exercise Program
Adjusted body f
at
response (%)
CC002/Unc CC013/GeniUnc CC027/GeniUnc CC037/TauUnc
10 5 0 5 10
10 5 0 5 10
F
M
HIIT MICT HIIT MICT HIIT MICT HIIT MICT
Exercise Program
Adjusted lean mass
response (%)
A
B
C
Figure 5. Adjusted body mass and composition response to exercise programs in four CC strains. Adjusted body mass response (%) (A), adjusted body fat percentage response (%) (B) and adjusted lean mass percentage response (%) (C) to 5 weeks of exercise program training
(n=4–16 per treatment, sex and strain; age~8 weeks at start). Exercise programs include HIIT (high intensity interval training) and MICT
in CC042/GeniUnc, which had similar levels of adjusted food intake and physical activity. Furthermore, a standard response occurred in CC039/Unc, even though CC039/ Unc had similar adjusted food intake levels but lower physical activity levels than CC002/Unc. Stress from accli-mation to single housing with wheel access could partially contribute to body mass and composition responses observed in the experimental cohort.
Young CC002/Unc females had consistent direction and magnitude of fat response to 2 weeks of voluntary exercise with old CC002/Unc females; however the
treat-ment effect was not statistically significant at ~4 months
due to low power. This is likely due to the variability
present in the control and experimental treatment groups leading to overlap in the body composition response mea-surements between the groups in the younger mice. Inter-estingly, there was higher variance in body fat responses
at ~4 months than at ~9 months. The higher levels of
variability could be due to the ongoing alterations in body composition occurring at this age. Larger sample sizes should improve mean estimations and ultimately increase power. The younger CC002/Unc females had a lower baseline body fat percentage than the older mice (mean 10.4 and 16.8%, respectively). This is not surpris-ing, as it is known that aging typically results in increased
body fat, alterations in body composition and
Table 4. NominalPvalues from ANOVA of best-fit linear models for body mass and composition responses.
Response Exercise program Sex
Genetic background
Exercise program-by-sex
interaction
Exercise program-by-genetic background
interaction
Sex-by-genetic background
interaction
Exercise program-by-sex-by-genetic background
interaction
Body mass 1.20910 12 NA 0.017 NA 0.007 NA NA
Body fat 0.04226 0.699 6.738910 5 0.025 0.048 0.034 0.577
Lean mass 0.0034 0.148 1.44910 8 0.0037 0.0037 0.109 0.412
Body mass and composition responses are from mice exposed to either HIIT, MICT or NE (Exercise Program) and include both males and
females (Sex) and four CC strains (Genetic Background). Best fit model are as follows: exercise program*genetic background (body mass
response) or exercise program*sex*genetic background (body fat and lean mass response). Gray boxes represent significant nominalP-values
(P<0.05). NA=not applicable.
Table 5. AdjustedP-values from Tukey’s post hoc analysis for best fit linear model for each body mass and composition response.
Response
Exercise program
Sex Genetic background
MICT versus HIIT
NE versus HIIT
NE versus MICT
M versus F
CC002 versus CC013
CC002 versus CC027
CC002 versus CC037
CC013 versus CC027
CC013 versus CC037
CC027 versus CC037
Body mass 0.057 <2.6910 16 1.0910 7 NA 0.077 0.054 0.026 0.999 0.998 0.991
Body fat 0.041 0.199 0.891 0.7 0.058 0.098 2.04910 5 0.968 0.262 0.056
Lean mass 4.81910 3 0.942 0.033 0.149 0.419 0.334 <2.6910 16 0.999 2.50910 4 3.25910 5
Response
Exercise program-by-sex interaction
F M
NE HIIT MICT
MICT versus HIIT
NE versus HIIT
NE versus MICT
MICT versus HIIT
NE versus HIIT
NE versus
MICT M versus F M versus F M versus F
Body mass NA NA NA NA NA NA NA NA NA
Body fat 4.96910 3 0.3755 0.869 0.994 0.999 0.971 0.999 0.565 0.241
Lean mass 1.01910 4 0.778 0.099 0.993 0.913 0.997 0.961 0.63 0.0175
Body mass and composition responses are from mice exposed to either HIIT, MICT or NE (Exercise Program) and include both males and
females (Sex) and four CC strains (Genetic Background). Best fit model are as follows: exercise program*genetic background (body mass
response) or exercise program*sex*genetic background (body fat and lean mass response). Gray boxes represent significant adjustedP-values
redistribution of fat (St-Onge and Gallagher 2010; McMullan et al. 2016). The younger CC002/Unc females could have been undergoing alterations in body composi-tion associated with aging over the 8 weeks of treatment. Other factors could have contributed to the higher level of variability in the young mice and lack of significant effect. Unlike the older control mice, the young control cohort was housed in the same vivarium and cages as the experimental cohort. The control cohort for the young CC002/Unc and CC037/TauUnc females could have been exposed to stress or other factors impacting body compo-sition responses confounded in the experiment.
Young CC002/Unc females exposed to forced exercise programs (HIIT and MICT) did not have a paradoxical body composition response, as observed in the old and young CC002/Unc females exposed to voluntary exercise. Instead, CC002/Unc females had a significant standard adjusted fat response to HIIT and no significant change in adjusted fat response to MICT. It is important to note the forced endurance programs were performed three times a week over the course of 4 weeks and
totaled ~480 m per session for CC002/Unc females;
whereas, CC002/Unc females in the voluntary exercise
treatment were running ~4.5 km on days 11–12 of wheel
access. Thus, CC002/Unc females exposed to voluntary exercise had a greater frequency, duration and distance and varying intensity of exercise over 2 weeks than the females exposed to forced exercise programs. In rodents,
both forced and voluntary exercise programs are used as a method to measure exercise abilities, exercise perfor-mance and other exercise-related traits. Voluntary exer-cise is a self-rewarding behavior and a complex trait that not only captures physical activity habits but also represents engagement in neural and physiological mech-anisms required for the behavior (Kostrzewa and Kas 2013). While both forced and voluntary depend on common variables (e.g., physiological systems, organ function), there are distinct factors to each program including: psychological desire to run, fear, pain percep-tion, shock avoidance, etc. (Lerman et al. 2002; Kelly and Pomp 2013; Kostrzewa and Kas 2013). Factors unique to voluntary exercise and their interaction with the CC002/Unc genetic background could be driving the observed exercise-induced paradoxical body composition response. In conclusion, CC002/Unc females are a novel model mouse strain for voluntary exercise-induced para-doxical body composition response. These findings strongly suggest that this response is due to unique physiological and metabolic conditions under genetic control. Future studies will be necessary to determine the underlying mechanism of paradoxical body composi-tion responses and determine how other phenotypes respond to exercise in our identified models. Human studies have demonstrated a small subset of individuals have more than one adverse response phenotypes to exercise (Bouchard et al. 2012).
Table 6. Analysis of metabolic traits and genetic background on body mass and composition response.
Baseline metabolic trait
Body mass response
Body fat response
Lean mass
response Postmetabolic trait
Body mass response
Body fat
response Lean mass response
RER nocturnal 0.0048 0.0034 5.15910 5 RER nocturnal 0.0176 0.0004 5.558910 10
RER day 0.0068 0.0034 0.0001 RER day 0.0150 0.3552 0.0862
VO2 nocturnal 0.0017 0.0002 0.0001 VO2 nocturnal 9.357910 5 0.0024 9.512910 5
VO2 day 0.0171 0.0197 0.0026 VO2 day 0.0035 0.0092 8.007910 5
VCO2 nocturnal 0.0005 0.0044 0.0010 VCO2 nocturnal 0.0057 0.0005 6.387910 7
VCO2 day 0.0192 0.0121 9.226910 5 VCO2 day 0.0144 0.1937 0.0054
Heat nocturnal 0.0013 0.0003 0.0017 Heat nocturnal 0.0003 0.0018 4.223910 5
Heat day 0.0188 0.0208 0.0002 Heat day 0.0042 0.0194 0.0001
Activity nocturnal 0.0266 0.0680 0.0006 Activity nocturnal 0.0290 0.0200 0.0051
Activity day 0.0009 0.0170 6.118910 7 Activity day 0.0074 0.0221 2.351910 5
Food intake nocturnal
0.0394 0.0100 4.452910 5 Food intake nocturnal 0.2746 0.0003 1.174910 7
Food intake day 0.0007 0.0209 0.0041 Food intake day 0.0410 0.0639 0.0233
Water intake nocturnal
0.0072 0.1074 0.0007 Water intake nocturnal 0.0040 0.1490 0.0006
Water intake day 0.0006 0.0064 0.0014 Water intake day 0.0405 0.0622 0.0042
NominalP-values from partialFtests of a nested ANOVA analysis was performed comparing the best fit model with each metabolic variable
subbed in for genetic background versus the best fit model including each metabolic variable. Best fit model are as follows: exercise
pro-gram*genetic background (body mass response) or exercise program*sex*genetic background (body fat and lean mass response). Gray boxes
2011). In particular, large individual variability in body fat percentage response, physical activity traits, and adjusted food intake occurred within CC072/TauUnc. It is possible that the differences in adjusted food intake, in combination with the differences in physical activity levels were driving the observed differences in fat response. In addition, CC072/TauUnc may be more susceptible to environmental influences (e.g., life history) or epigenetic influence (e.g., in utero environment) that were unac-counted for in the study design. The large individual vari-ability observed in CC072/TauUnc was unlikely caused by segregating regions of the strain’s genome since only 0.8% of the genome was segregating in this strain 2 years ago (Srivastava et al. 2017).
Concluding remarks
Despite significant health burdens and public interest in understanding and optimizing exercise regimes within the human population, relatively little is known about the genetic architecture and control of the diverse behavioral, metabolic and physiological responses that converge to drive successful response to exercise. This study used mouse strains from the CC population to identify and develop mouse model(s) of exercise-induced paradoxical fat responders. Genetic variation in the CC resulted in phenotypic diversity in exercise-related traits. The pres-ence of outliers in body composition response to exercise in a small subset of CC strains, further supports that the CC population is a rich source for new models of human traits (Rogala et al. 2014; Kelly et al. 2015).
CC002/Unc was identified as a model for paradoxical body composition response under certain conditions (fe-males, voluntary exercise, significance of effect varies by age). Voluntary exercise-induced body mass and compo-sition responses were driven by genetic background independent of physical activity levels further supporting the importance of genetic background on exercise-induced responses (Nehrenberg et al. 2009). Lastly, this study demonstrated a significant genetic background-by-sex-by-exercise program interaction on body composi-tion response. Specifically, HIIT elicited more beneficial body composition responses than MICT programs in females dependent on genetic background. It will be vital to consider genetic background, sex and age in the design of effective exercise programs in the human pop-ulations.
Acknowledgments
We thank Darla Miller and staff members of UNC System Genetics Core Facility for their assistance during this study.
Femaleshavedifferentbodycomposition
responsesdependingonexerciseprogram
andgeneticbackground
Body composition responses to HIIT, MICT, and NE
programs were examined in both males and females in
four different genetic backgrounds. There was a
signifi-cant genetic background-by-sex-by-exercise program
interaction on both body fat and lean mass response to
program. Specifically, females responded differently to
HIIT and MICT programs, and the response further
varied by genetic background. This finding indicates
genetic background, sex, and exercise factors (e.g.,
intensity, duration) should be considered in design of
exercise programs for humans. From this study,
addi-tional CC strains as potential models of paradoxical
body composition responses to exercise were identified.
In particular, both CC027/GeniUnc and CC037/TauUnc
females had a significant paradoxical adjusted fat
response to MICT programs. Additional studies utilizing
these identified models of paradoxical responders and
non-responders will be necessary to identify underlying
mechanistic pathways and genetic biomarkers predicting
response to particular exercise programs. These studies
will be important for informing the design of effective
exercise programs for particular genetic populations and
individuals.
In addition, the currentstudy demonstrated that
base-line metabolism, including RER, did not predict body
mass and composition response. Genetic background
insteadpredictedbodymassandcomposition responsein
the four CCstrains.RERis commonlyused toindirectly
determinethecontributionofcarbohydratesand lipidsto
energy expenditure. The contribution of these fuels can
beaffectedbydiet,muscleglycogenpresence,exercise
fac-tors (intensity, duration) and training status (Venables
et al. 2005;Ramos-Jimenezet al. 2008). Individual
varia-tion in substrate oxidation during exercise has been
observed in both trained and untrained individuals. In
thisstudy, baseline RERwasnot associated body
compo-sition response to exercise supporting prior findings in
humans(Goedeckeet al.2000).
Withinstrainindividualvariabilitywas observedacrossphenotypes
Even though these studies were performed in mouse
strains that were almost fully inbred (Srivastava et al.
2017), variance inall phenotypes and variability inlevels
of variance across CC strains was observed (Tables S4–
S8). This is not surprising since individual variability in
exercise-related phenotypes in inbred strains has
2009. Individual responsiveness to exercise-induced fat loss is associated with change in resting substrate utilization. Metabolism 58:1320–1328.
Blue, M. N. M., A. E. Smith-Ryan, E. T. Trexler, and K. R. Hirsch. 2018. The effects of high intensity interval training on muscle size and quality in overweight and obese adults. J. Sci. Med. Sport. 21:207–212. https://doi.org/10.1016/j.jsa ms.2017.06.001
Blundell, J. E., C. Gibbons, P. Caudwell, G. Finlayson, and M. Hopkins. 2015. Appetite control and energy balance: impact of exercise. Obes. Rev. 16:67–76.
Bogue, M. A., G. A. Churchill, and E. J. Chesler. 2015. Collaborative Cross and Diversity Outbred data resources in the Mouse Phenome Database. Mamm. Genome 26:511– 520.
Booth, F. W., C. K. Roberts, and M. J. Laye. 2012. Lack of exercise is a major cause of chronic diseases. Compr. Physiol. 2:1143–1211.
Bouchard, C., and A. Tremblay. 1997. Genetic influences on the response of body fat and fat distribution to positive and negative energy balances in human identical twins. J. Nutr. 127:943S–947S.
Bouchard, C., S. N. Blair, T. S. Church, C. P. Earnest, J. M. Hagberg, K. Hakkinen, et al. 2012. Adverse metabolic response to regular exercise: is it a rare or common occurrence? PLoS ONE 7:e37887–e37889.
Boutcher, S. H. 2011. High-intensity intermittent exercise and fat loss. J. Obes. 2011:868305.
Bray, M. S., J. M. Hagberg, L. Perusse, T. Rankinen, S. M. Roth, B. Wolfarth, et al. 2009. The human gene map for performance and health-related fitness phenotypes: the 2006-2007 update. Med. Sci. Sports Exerc. 41:35–73. Buchheit, M., and P. B. Laursen. 2013. High-intensity interval
training, solutions to the programming puzzle. Sports Med. 43:313–338.
Consortium CC. 2012. The genome architecture of the Collaborative Cross gouse Genetic reference population. Genetics 190:389–401. https://doi.org/10.1534/genetics.111. 132639/-/dc1.
Drenowatz, C. 2016. The role of compensatory adaptations and individual variability in exercise prescription. JFMK 1:230–239.
Egan, B., and J. R. Zierath. 2013. Exercise metabolism and the molecular regulation of skeletal muscle adaptation. Cell Metab. 17:162–184.
Ferguson, B., R. Ram, H. Y. Handoko, P. Mukhopadhyay, H. K. Muller, H. P. Soyer, et al. 2015. Melanoma susceptibility as a complex trait: genetic variation controls all stages of tumor progression. Oncogene 34:2879–2886.
Ferris, M. T., D. L. Aylor, D. Bottomly, A. C. Whitmore, L. D. Aicher, T. A. Bell, et al. 2013. Modeling host genetic
regulation of influenza pathogenesis in the Collaborative Cross. PLoS Pathog. 9:e1003196-15.
Garland, T., H. Schutz, M. A. Chappell, B. K. Keeney, T. H. Meek, L. E. Copes, et al. 2010. The biological control of voluntary exercise, spontaneous physical activity and daily energy expenditure in relation to obesity: human and rodent perspectives. J. Exp. Biol. 214:206–229.
Gibala, M. J., J. P. Little, M. J. MacDonald, and J. A. Hawley. 2012. Physiological adaptations to low-volume, high-intensity interval training in health and disease. J. Physiol. 590:1077–1084.
Gibala, M. J., J. B. Gillen, and M. E. Percival. 2014.
Physiological and health-related adaptations to low-volume interval training: influences of nutrition and sex. Sports Med. 44:127–137.
Goedecke, J. H., A. S. C. Gibson, L. Grobler, M. Collins, T. D. Noakes, and E. V. Lambert. 2000. Determinants of the variability in respiratory exchange ratio at rest and during exercise in trained athletes. Am. J. Physiol. Endocrinol. Metab. 279:E1325–E1334.
Gordon, C. J., P. M. Phillips, and A. F. M. Johnstone. 2016. Impact of genetic strain on body fat loss, food
consumption, metabolism, ventilation, and motor activity in free running female rats. Physiol. Behav. 153:56–63. Helgerud, J., K. Høydal, E. Wang, T. Karlsen, P. Berg, M.
Bjerkaas, et al. 2007. Aerobic high-intensity intervals improve VO2max more than moderate training. Med. Sci. Sports Exerc. 39:665–671.
Karavirta, L., K. Hakkinen, A. Kauhanen, A. Arija-Blazquez, E. Sillanpaa, N. Rinkinen, et al. 2011. Individual responses to combined endurance and strength training in older adults. Med. Sci. Sports Exerc. 43:484–490.
Kelada, S. N. P., D. E. Carpenter, D. L. Aylor, P. Chines, H. Rutledge, E. J. Chesler, et al. 2014. Integrative genetic analysis of allergic inflammation in the murine lung. Am. J. Respir. Cell Mol. Biol. 51:436–445.
Kelly, S. A., and D. Pomp. 2013. Genetic determinants of voluntary exercise. Trends Genet. 29:348–357.
Kelly, S. A., D. L. Nehrenberg, K. Hua, T. Garland, and D. Pomp. 2011. Exercise, weight loss, and changes in body composition in mice: phenotypic relationships and genetic architecture. Physiol. Genomics 43:199–212.
Kelly, S. A., D. L. Nehrenberg, K. Hua, T. Garland, and D. Pomp. 2012. Functional genomic architecture of
predisposition to voluntary exercise in mice: expression QTL in the brain. Genetics 191:643–654.
Kelly, S. A., F. P.-M. de Villena, and D. Pomp. 2015. The, “Omics” of voluntary exercise: systems approaches to a complex phenotype. Trends Endocrinol. Metab. 26:673–675. King, N. A., M. Hopkins, P. Caudwell, R. J. Stubbs, and J. E.
Blundell. 2009. Beneficial effects of exercise: shifting the focus from body weight to other markers of health. Br. J. Sports Med. 43:924–927.
References
King, N. A., K. Horner, A. P. Hills, N. M. Byrne, R. E. Wood, E. Bryant, et al. 2012. Exercise, appetite and weight management: understanding the compensatory responses in eating behaviour and how they contribute to variability in exercise-induced weight loss. Br. J. Sports Med. 46:315–322. Kostrzewa, E., and M. J. Kas. 2013. The use of mouse models
to unravel genetic architecture of physical activity: a review. Genes Brain Behav. 13:87–103.
Koteja, P., P. A. Carter, J. G. Swallow, and T. Jr Garland. 2003. Food wasting by house mice: variation among individuals, families, and genetic lines. Physiol. Behav. 80:375–383.
Leamy, L. J., D. Pomp, and J. T. Lightfoot. 2010. A search for quantitative trait loci controlling within-individual variation of physical activity. BMC Genet. 11:83–94.
Lerman, I., B. C. Harrison, K. Freeman, T. E. Hewett, D. L. Allen, J. Robbins, et al. 2002. Genetic variability in forced and voluntary endurance exercise performance in seven inbred mouse strains. J. Appl. Physiol. 92:2245–2255. Mann, T. N., R. P. Lamberts, and M. I. Lambert. 2014. High
responders and low responders: factors associated with individual variation in response to standardized training. Sports Med. 44:1113–1124.
Mathes, W. F., D. L. Aylor, D. R. Miller, G. A. Churchill, E. J. Chesler, F. P.-M. de Villena, et al. 2011. Architecture of energy balance traits in emerging lines of the Collaborative Cross. Am. J. Physiol. Endocrinol. Metab. 300:E1124–E1134. McMullan, R. C., S. A. Kelly, K. Hua, B. K. Buckley, J. E.
Faber, F. Pardo Manuel de Villena, et al. 2016. Long-term exercise in mice has sex-dependent benefits on body composition and metabolism during aging. Physiol. Rep. 4: e13011–e13016.
Mitchell, J. A., T. S. Church, T. Rankinen, C. P. Earnest, X. Sui, and S. N. Blair. 2010. FTO genotype and the weight loss benefits of moderate intensity exercise. Obesity 18:641–643. Morgan, A. P., and C. E. Welsh. 2015. Informatics resources for the Collaborative Cross and related mouse populations. Mamm. Genome 26:521–539.
Nehrenberg, D. L., K. Hua, D. Estrada-Smith, T. Jr Garland, and D. Pomp. 2009. Voluntary exercise and its effects on body composition depend on genetic selection history. Obesity 104:531–538.
Nybo, L., E. Sundstrup, M. D. Jakobsen, M. Mohr, T. Hornstrup, L. Simonsen, et al. 2010. High-intensity training versus traditional exercise interventions for promoting health. Med. Sci. Sports Exerc. 42:1951–1958. Petkova, S. B., R. Yuan, S. W. Tsaih, W. Schott, D. C.
Roopenian, and B. Paigen. 2008. Genetic influence on immune phenotype revealed strain-specific variations in peripheral blood lineages. Physiol. Genomics 34:304–314. Phares, D. A., A. A. Halverstadt, A. R. Shuldiner, R. E. Ferrell,
L. W. Bouglass, A. S. Ryan, et al. 2004. Association between body fat response to exercise training and multilocus ADR genotypes. Obes. Res. 12:807–815.
Phillippi, J., Y. Xie, D. R. Miller, T. A. Bell, Z. Zhang, A. B. Lenarcic, et al. 2013. Using the emerging Collaborative Cross to probe the immune system. Genes Immun. 15:38– 46.
Ramos-Jimenez, A., R. P. Hernandez-Torres, P. V. Torres, J. Romero-Gonzalez, D. Mascher, C. Posadas-Romero, et al. 2008. The respiratory exchange ratio is associated with fitness indicators both in trained and untrained men: a possible application for people with reduced exercise tolerance. Clin. Med. Circ. Respirat. Pulm. Med. 2:1–9. Rasmussen, A. L., A. Okumura, M. T. Ferris, R. Green, F. Feldmann, S. M. Kelly, et al. 2014. Host genetic diversity enables Ebola hemorrhagic fever pathogenesis and resistance. Science 346:987–991.
Rogala, A. R., A. P. Morgan, A. M. Christensen, T. J. Gooch, T. A. Bell, D. R. Miller, et al. 2014. The Collaborative Cross as a resource for modeling human disease: CC011/Unc, a new mouse model for spontaneous colitis. Mamm. Genome 25:95–108.
Scalzo, R. L., G. L. Peltonen, S. E. Binns, M. Shankaran, G. R. Giordano, D. A. Hartley, et al. 2014. Greater muscle protein synthesis and mitochondrial biogenesis in males compared with females during sprint interval training. FASEB J. 28:2705–2714.
Seldeen, K. L., G. Lasky, M. M. Leiker, M. Pang, K. E. Personius, and B. R. Troen. 2018. High intensity interval training improves physical performance and frailty in aged mice. J. Gerontol. A Biol. Sci. Med. Sci. 73:429–437. Smith-Ryan, A. E., M. N. Melvin, and H. L. Wingfield. 2015.
High-intensity interval training: modulating interval duration in overweight/obese men. Phys. Sportsmed. 43:107–113.
Smith-Ryan, A. E., E. T. Trexler, H. L. Wingfield, and M. N. M. Blue. 2016. Effects of high-intensity interval training on cardiometabolic risk factors in overweight/obese women. J. Sports Sci. 34:2038–2046.
Srivastava, A., A. P. Morgan, M. L. Najarian, V. K. Sarsani, J. S. Sigmon, J. R. Shorter, et al. 2017. Genomes of the mouse Collaborative Cross. Genetics 206:537–556.
St-Onge, M.-P., and D. Gallagher. 2010. Body composition changes with aging: the cause or the result of alterations in metabolic rate and macronutrient oxidation? Nutrition 26:152–155.
Swallow, J. G., P. Koteja, P. A. Carter, and T. Jr Garland. 2001. Food consumption and body composition in mice selected for high wheel-running activity. J. Comp. Physiol. B. 171:651–659.
Takeshita, H., M. Horiuchi, K. Izumo, H. Kawaguchi, E. Arimura, K. Aoyama, et al. 2012. Long-term voluntary exercise, representing habitual exercise, lowers visceral fat and alters plasma amino acid levels in mice. Environ. Health Prev. Med. 17:275–284.