NOVEL QUANTITATIVE PROTEOMIC APPROACHES TO REVEAL NEW DRIVING MECHANISMS AND BIOMARKERS OF TUMORIGENESIS
J. Astor Ankney
A dissertation submitted to the faculty at the University of North Carolina at Chapel Hill in partial fulfillment of the requirements for the degree of Doctor of Philosophy in the Department of
Biochemistry and Biophysics in the School of Medicine
Chapel Hill 2019
Approved by: Xian Chen
Gaorav P Gupta Leslie V Parise
iii ABSTRACT
J. Astor Ankney: Novel quantitative proteomic approaches to reveal new driving mechanisms and biomarkers of tumorigenesis
(Under the direction of Xian Chen)
Understanding the biological processes and pathways important to healthy and disease states requires the probing of systems at the protein level. While genetic alterations may predict the likelihood of disease, it is the phenotypic changes which characterize disease onset. The growth of mass spectrometry-based proteomics over the past two decades has been essential for our ability to perform systems-level interrogations of both healthy and disease states. Here, we have employed quantitative proteomic techniques to investigate breast cancer and glioma biology.
Chapter 1 provides background on breast cancer heterogeneity and the challenges in classifying breast tumors in a clinically relevant manner. It additionally presents an overview of mass-spectrometry based proteomics and methods of proteomic quantitation.
Chapter 2 presents a novel workflow for the identification of new liquid biopsy
biomarkers for breast cancer prognosis. We developed a multi-omic approach linking oncogenic secreted proteins to patient-specific transcriptomic data and clinical outcomes. Kaplan-Meier analysis of genes having a secretion correlated expression pattern was used to identify new liquid biopsy biomarkers for predicting individualized prognosis.
iv
Chapter 4 introduces a novel approach to the study of secreted proteins termed outside-in proteomics. We first perform an unbiased screen of the secretome to identify phenotypic-relevant markers and use those results to guide our investigation of the intracellular proteome. We applied this approach to analyze the role of EZH2 in the aggressive phenotype of triple negative breast cancer.
Chapter 5 presents a quantitative proteomic comparison of IDH1 mutant and wild type glioma cells. We performed a proteomic screen of IDH1 mutant versus wild type gliomas, and we report several new pathways and processes which may contribute to IDH1 mutant glioma pathogenesis or progression.
v
vi
ACKNOWLEDGEMENTS
I cannot imagine getting this far without tremendous help from a large number of people. A few sentences are not enough to fully express my sincere gratitude to everyone who has contributed to my success, but in this space a few sentences are all I have. I would first like to thank my thesis advisor and mentor Xian Chen. I could not have asked for a better advisor. You have given me the support, freedom, and criticism I needed to grow as a scientist. I would also like to thank my committee members, Greg Wang, Leslie Parise, Gaorav Gupta, and Brian Strahl. You asked tough questions, provided honest feedback, and gave me confidence in my project and in myself. I thank my labmates for helping me work through issues of technique and theory. In particular, I appreciate the patience of Amey when helping me troubleshoot an
experiment or teaching a new technique, and John, who wrote many of the analytical tools I have used, in explaining how to use his scripts and writing new ones at my request. Last, but in no way least, I must thank Ling Xie. If you were ever flustered by my constant questions, you never showed it. You have been an invaluable part of my training as a mentor and as a friend.
It is also important for me to thank the people who helped me get started in science. I thank Larry Eimers for giving me a free career aptitude test that set me on this path. Dr. Isabelle Lemasson gave me my first undergraduate research position and stoked my passion for
research. Yu Yang invited me to join his lab and gave me confidence in my abilities. Geoff Mueller gave me a 10 week internship which challenged me and sparked my independent thought. I thank each of you for guiding me down this path.
vii
have provided much-needed moral support (not to mention babysitting!), but my mom has been especially supportive and I will never be able to thank her appropriately. Each of the people named above has been instrumental to my adventure in science, but none has been as
viii PREFACE
Portions of the work described in this dissertation were previously published:
Chapter 1 contains excerpts from J. Astor Ankney, Adil Muneer, and Xian Chen. Relative and Absolute Quantitation in Mass Spectrometry–Based Proteomics. Annual Review of
Analytical Chemistry. 2018; 11:49-77. doi: 10.1146/annurev-anchem-061516-045357 reprinted with permission
ix
TABLE OF CONTENTS
CHAPTER 1: BACKGROUND ... 1
Breast cancer epidemiology and etiology ... 1
Breast cancer heterogeneity and classification ... 2
A new generation of phenotypic markers is needed ... 5
The cancer cell secretome as a source of novel biomarkers ... 6
Challenges in blood-based proteomics and alternative approaches ... 7
Label Free Quantitative Proteomics ... 8
Ion counting-based label-free quantitation ... 9
Intensity-based label-free quantitation ...11
Limitations of single-omics approaches ...12
CHAPTER 2: NOVEL SECRETOME-TO-TRANSCRIPTOME INTEGRATED OR SECRETO-TRANSCRIPTOMIC APPROACH TO REVEAL LIQUID BIOPSY BIOMARKERS FOR PREDICTING INDIVIDUALIZED PROGNOSIS OF BREAST CANCER PATIENTS...14
INTRODUCTION ...14
METHODS ...16
RESULTS ...19
x
LFQ secretome screening identified particular protein clusters showing BC-subtypic
secretion. ...20
The genes that encode increasingly secreted proteins showed secretion-correlated mRNA over-expression patterns in BC patients in a PAM50-subtypic manner. ...23
Patient-specific mRNA co-overexpression patterns of select secretome-encoding genes mark the high-risk subpopulations of PAM50-subtypic patients with poor prognosis. ...25
Secreto-transcriptomic analysis identified patient-specific co-overexpression patterns of select secreted proteins as prognostic markers to predict personalized response to therapy. ...29
DISCUSSION ...30
CONCLUSIONS ...33
CHAPTER 3: A novel “outside-in” proteomic approach reveals signaling pathways promoting the EZH2-dependent aggressive phenotype of triple negative breast cancer ...53
INTRODUCTION ...53
METHODS ...55
RESULTS ...57
EZH2 inhibition suppresses the extracellular aggressive phenotype of TNBC ...57
Intracellular pathways and processes mirror the secretome ...59
DISCUSSION ...61
CONCLUSIONS ...63
CHAPTER 4: QUANTITATIVE PROTEOMIC ANALYSIS OF SPLICEOSOME PROTEIN SNRPD1 REVEALS COMPLEX ROLE IN BREAST CANCER CELLS ...73
xi
METHODS ...74
RESULTS ...77
SNRPD1 knockdown causes significant widespread changes to diverse cell processes and signaling pathways ...77
The secretome reflects consistent pathway activation to intracellular proteome but contradictory biological functions ...79
DISCUSSION ...81
CONCLUSIONS ...83
CHAPTER 5: PROTEOMIC DISSECTION OF SYSTEMS-LEVEL EFFECTS OF IDH1 MUTATION IN DIFFUSE GLIOMA ...95
INTRODUCTION ...95
METHODS ...97
RESULTS ...99
DISCUSSION ... 101
xii
LIST OF FIGURES
Figure 2.1 - Schematic of secreto-transcriptomic approach for identifying putative liquid biopsy
prognostic markers.. ...34
Figure 2.2 - Heatmap of protein secretion by multiple sub-types ... ..35
Figure 2.3 - Heatmap of basal-specific and luminal-specific protein secretion. ...36
Figure 2.4 - Western blot validation of LFQ data. ...37
Figure 2.5 - IPA analysis of subtype-specific secreted proteins ...38
Figure 2.6 - Protein-protein interaction analysis of basal-specific and luminal-specific secreted proteins. ...39
Figure 2.7 - Heatmap of mRNA expression of SeCEP genes in the TCGA patient cohort ...40
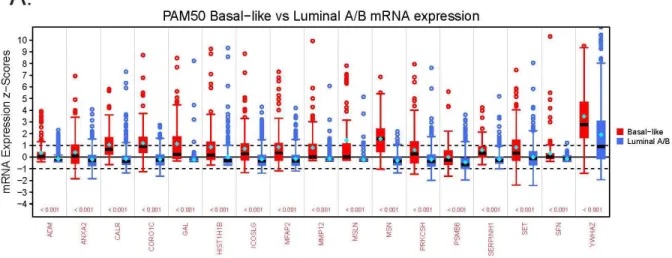
Figure 2.8 - Box plots showing altered mRNA expression for BLBC and luminal secreted proteins among TCGA patients...41
Figure 2.9 - Kaplan-Meier survival plots of clinical outcomes and mRNA co-overexpression of basal SeCEP genes ...42
Figure 2.10 - Kaplan-Meier survival plots of clinical outcomes and mRNA co-overexpression of luminal SeCEP genes ...44
Figure 2.11 - Kaplan-Meier survival plots of clinical outcomes and mRNA co-overexpression of luminal A SeCEP genes ...46
Figure 2.12 - Kaplan-Meier survival plots of clinical outcomes and mRNA co-overexpression of luminal B SeCEP genes ...47
Figure 2.13 - Kaplan-Meier survival plots of clinical outcomes and mRNA co-overexpression of indicated HER2+ SeCEP genes ...48
Figure 2.14 - The interactive subnetworks of basal SeCEP genes.. ...50
Figure 2.15 - The interactive subnetworks of luminal SeCEP genes ...51
Figure 2.16 - Kaplan-Meier survival plots of clinical outcomes and mRNA co-overexpression of indicated SeCEP genes based on GSE25066 patient data...52
Figure 3.1 - Heatmap of altered secretome after treatment with UNC1999 ...64
Figure 3.2 - STRING analysis of decreased EZH2-dependent protein secretion ...65
Figure 3.3 - STRING analysis of increased EZH2-dependent protein secretion ...66
xiii
Figure 3.5 - Heatmap of altered intracellular proteome after treatment with UNC1999 ...68
Figure 3.6 - STRING analysis of increased intracellular proteins after treatment with UNC1999. ...69
Figure 3.7 - STRING analysis of decreased intracellular proteins after treatment with UNC1999 ...70
Figure 3.8 - IPA analysis of EZH2-dependent signaling ...71
Figure 3.9 - IPA analysis of EZH2-dependent biological functions...72
Figure 4.1 - Various forms of alternative splicing ...84
Figure 4.2 - Heatmap of proteome changes due to SNRPD1 knockdown. ...85
Figure 4.3 - Volcano plot of proteome changes due to SNRPD1 knockdown ...86
Figure 4.4 - STRING analysis of downregulated intracellular proteins in SNRPD1 knockdown cells ...87
Figure 4.5 - STRING analysis of upregulated intracellular proteins in SNRPD1 knockdown cells ...88
Figure 4.6 - IPA analysis of changes in intracellular proteins due to SNRPD1 knockdown ...89
Figure 4.7 - Heatmap of secretome changes due to SNRPD1 knockdown ...90
Figure 4.8 - Volcano plot of secretome changes due to SNRPD1 knockdown. ...91
Figure 4.9 - STRING analysis of higher secreted proteins in SNRPD1 knockdown cells. ...92
Figure 4.10 - STRING analysis of higher secreted proteins in SNRPD1 knockdown cells. ...93
Figure 4.11 - IPA analysis of changes in secreted proteins in SNRPD1 knockdown cells ...94
Figure 5.1 - Heatmap of IDH1 mutant and wild type glioma intracellular protein abundance ... 105
Figure 5.2 – Volcano plot of proteins identified in IDH1 mutant and wild type glioma cells ... 106
Figure 5.3 – GOBP and STRING analysis of upregulated proteins in IDH1 mutant glioma cells ... 107
Figure 5.4 – GOBP and STRING analysis of downregulated proteins in IDH1 mutant glioma cells ... 109
xiv
LIST OF ABBREVIATIONS
α-KG α-ketoglutarate
APEX Absolute protein expression
BC Breast cancer
BLBC Basal-like breast cancer
dNSAF Distributed normalized spectral abundance factor DRFS Distant relapse free survival
emPAI Exponential protein abundance index EMT Epithelial-mesenchymal transition ER Estrogen receptor
FDR False discovery rate
GBM Glioblastoma multiforme
GOBP Gene Ontology biological process GOCC Gene Ontology cellular component H3K27Me3 Histone H3 lysine 27 tri-methylation HER2 Human epidermal receptor 2 IPA Ingenuity Pathway Analysis
KD Knockdown
KM Kaplan-Meier
LC-MS/MS Liquid chromatography-tandem mass spectrometry LFQ Label- free quantitative
METABRIC Molecular Taxonomy of Breast Cancer International Consortium
MS Mass spectrometry
xv PAF Protein abundance factor
PAI Protein abundance index PPI Protein-protein interaction PR Progesterone receptor
PRC2 Polycomb repressive complex 2 R-2HG R-2-hydroxyglutarate
SC Spectral counting
SeCEP Secretion-correlated mRNA expression pattern snRNP Small nuclear ribonucleoprotein
snRNA Small nuclear RNA SpC Spectral counts
STRING Search Tool for the Retrieval of Interacting Genes/Proteins TCGA The Cancer Genome Atlas
1
CHAPTER 1: BACKGROUND
Breast cancer epidemiology and etiology
Breast cancer (BC) is the most frequently diagnosed cancer among women in the United States and worldwide, and BC is the second leading cause of cancer death among women in the US.[1] However, despite decreased incidence in lesser developed countries, higher mortality rates in these areas make BC the leading cause of cancer death among women worldwide.[1] It is estimated that approximately 12%, or 1 in 8, women in the United States will be diagnosed in her lifetime.[2] Women of age 50 or older comprise approximately 80% of breast cancer
diagnoses and almost 90% of BC deaths.[2] Although survival rates are higher in BC relative to many other cancer types, [3] this disease remains a significant public health concern.
The incidence rate of BC in the US has increased by an average of 0.4% per year since 2004, [2, 3] however the mortality rate has continued to decline due in part to earlier detection by increased rates of screening mammography and the development of more effective and targeted therapies.[4, 5] Notwithstanding improvement in survival rates, significant racial disparities in BC incidence and mortality have been observed, and black women have higher BC mortality rates versus white women despite having lower incidence rates.[2, 6] These
disparities are partially due to later disease stage at the time of diagnosis, but black women also have worse survival than white women with the same disease stage.[7] Further, black women are more likely to be diagnosed with more aggressive forms of cancer versus other races.[2]
2
diagnosed with BC and their age at first detection.[11] High susceptibility genes BRCA1 and BRCA2 account for less than 25% of this increased risk [12] and are rare in the population.[13] Other known genetic factors conferring intermediate risk, including ATM, PALB2, and CHEK2, comprise 2 to 5% of the increased familial risk.[9] Overall only 37% of excess familial risk is explained by known genetic mutations, with the remaining risk due to undiscovered genetic variants or other factors.[14] Environmental factors also play an important role in BC etiology. These include alcohol consumption, body mass index, and reproductive factors including ages at menarche, first birth, and menopause.[8, 14]
Breast cancer heterogeneity and classification
Breast cancer is not a single disease, but is a heterogeneous group of diseases with distinct clinical features and biological characteristics.[15-17] BC tumors vary widely in
morphological structure, genetic mutation, biological behavior and metastatic potential.[18, 19] Even within an individual patient a tumor may exhibit heterogeneity in different regions of the tumor (spatial intratumor heterogeneity) or properties of the tumor may change over time (temporal intratumor heterogeneity).[20] For decades pathologists have recognized the need to classify tumors to guide therapeutic decisions and aid in prognosis.[21, 22]
Tumor classification may be defined by clinical, histological, or molecular features. An early classification based on clinical features was tumor stage, and this classification is still standard in pathology reports. Previously, tumor stage was defined solely by primary tumor size, involvement of regional lymph nodes, and distant metastasis.[23] Based on these features the patient was assigned a stage from 0 (non-invasive) to IV (metastatic).[23] In 2018, the American Joint Committee on Cancer updated the staging guidelines to also include molecular and
histological features of the tumor.[24]
The histological tumor grade is based on the morphologic and proliferative
3
index.[22] However, when initially introduced this system was susceptible to problems with reproducibility and interobserver variation in grading.[25, 26] Revisions to this grading system [21] increased objectivity and made grading semiquantitative, substantially improving
reproducibility.[25, 26] Due to the prognostic value, this grading system is an important component of histopathological reports.[26, 27]
Histological tumor type is another longstanding method of classification still in use despite having limited prognostic value.[28] Based on cytological and architectural features, a tumor may be assigned to one of at least 17 subtypes.[20, 25] In this system, approximately 70% of all breast tumors are invasive ductal carcinomas not otherwise specified, which is a diagnosis of exclusion since these tumors cannot be classified as any special type.[15, 29] Another 5-15% are invasive lobular carcinomas which have lower risk of mortality.[25, 30] Although tumors of special histological type differ prognostically, this classification method has limited clinical utility because the vast majority of tumors are of no special type.[20]
While classification of BC tumors based on clinical and histological features provides a primarily prognostic benefit, molecular features can aid in therapeutic decision-making. The potential role of hormone signaling in breast cancer was first recognized in the late 19th
century.[31] By the 1960’s experiments using radiolabeled estrogens had established that these hormones accumulate and promote growth in specific tissues [32, 33] supporting the hypothesis that an estrogen receptor (ER) may exist in these tissues.[34] Subsequent experiments confirmed the existence of the estrogen receptor.[35, 36] Within a decade
additional experiments established the link between ER expression and response to endocrine therapy, [37] and assays to quantify ER expression were being developed.[38] In addition to the therapeutic role, ER expression was also identified as an independent marker of better
prognosis.[39]
4
some ER+ tumors may have a defect in the estrogen signaling pathway which prevents estrogen action in the cell.[41] Reasoning that the presence of an estrogen signaling product may indicate an intact signaling pathway, and therefore endocrine therapy responsiveness, the progesterone receptor (PR) was proposed as a suitable marker.[41] However, the use of PR as a predictor of response to endocrine therapy has been questionable due to differences in results between studies.[42, 43] Further, limited response is observed in some ER+/PR- tumors so that the clinician and patient must weigh the risks and benefits of undertaking endocrine therapy on an individual basis.[44] Endocrine therapy for the uncommon ER-/PR+ phenotype remains controversial.[45] Although PR status has questionable utility as a therapeutic predictor, PR+ patients typically have more favorable outcomes than PR- patients, making PR an important prognostic marker in BC.[45]
The existence of human epithelial growth factor receptor 2 (HER2) and its amplification in BC was first described by a series of reports in the mid-1980’s [46-49] and its importance to relapse and survival were reported only two years later.[50] The prognostic significance of HER2 is well supported by subsequent studies.[51-53] HER2 is overexpressed by 15-20% of BC tumors, [54, 55] and these tumors are typically more aggressive with poorer differentiation and higher lymph node involvement than HER2- tumors.[56, 57] Further, although about half of HER2+ tumors are also ER+, these tumors are more likely to develop resistance to endocrine therapy, likely due to crosstalk between signaling pathways.[58] Encouragingly, since the introduction of HER2-targeted therapies including trastuzumab, [57] overall and relapse-free survival rates for HER2+ BC have improved significantly.[54]
5
cannot be treated with therapies that target HER2 or estrogen signaling, making systemic chemotherapy and radiation the most common treatment options.[61, 62] The development of improved therapies for TNBC is currently an area of intense research.[61]
Among broadly used classification systems, the most recently developed relies on DNA microarray analysis of tumor gene expression. In a seminal work, Perou et. al. identified four BC subtypes based on the expression of a 496-gene set.[63] Further refinement led to the
establishment of a 50-gene set (PAM50) which identified five primary “intrinsic molecular subtypes”: luminal A, luminal B, basal-like (BLBC), HER2-enriched, and normal-like.[64]
Importantly, molecular subtypes exhibit important differences in prognosis [65] and response to therapy.[64, 66] Approximately half of tumors are classified as luminal A making this the most prevalent PAM50 subtype.[67, 68] About 20% of tumors are luminal B, 15-20% are BLBC, 10-15% are HER2-enriched, and >5% are normal-like.[67, 68] PAM50 subtypes roughly match molecular marker status as luminal A tumors are typically ER+/ER2-, luminal B are usually ER+/HER2+, the HER2-enriched group is most often ER-/HER2+, and the majority of basal-like tumors are triple-negative.[63] Although these groups are sometimes inappropriately equated [2, 69] the PAM50 subtype classification is distinct from receptor status.[70] Despite the dramatic advances that gene expression profiling has provided in prognostic prediction and overall understanding of tumor biology and heterogeneity, the lack of correlation between PAM50 subtype and tumor phenotype make this classification system unsuitable for therapeutic decision-making.[70]
A new generation of phenotypic markers is needed
6
unavailable.[24] Likewise, histological tumor type can be prognostically valuable in special-type tumors, however about 70% of tumors are of no special type and are therefore not benefitted by this system.[20] On the other hand, tumor receptor status has proven highly clinically valuable but cannot predict which tumors will be unresponsive to endocrine or HER2-directed therapies or will develop therapeutic resistance.[19, 71] Finally, the transcriptomic data used in gene expression profiling is unable to resolve the phenotypic changes which govern BC
characteristics.[70] To prevent undertreatment of aggressive BC and avoid overtreatment of patients who will gain little benefit, there is a pressing need for a new generation of phenotypic BC markers which can better predict personalized prognosis and response to therapy.
The cancer cell secretome as a source of novel biomarkers
The most basic definition of a biomarker as set forth by the NIH Biomarkers Definitions
Working Group is “A characteristic that is objectively measured and evaluated as an indicator of normal biological processes, pathogenic processes, or pharmacologic responses to a
therapeutic intervention.”[72] However, the ideal biomarker should be obtainable in a non-invasive manner and be easily and inexpensively assayed.[73-76] Because bodily fluids
including blood can be obtained non-invasively, they are excellent biomarker reservoirs.[77, 78] Many biological molecules and processes have been proposed as potential cancer biomarkers, e.g. microRNA, circulating tumor DNA, and DNA methylation patterns.[79-81] Alterations in any of these proposed markers usually results in an increase or decrease in the expression of various protein products.[82] Tumor cells secrete and shed characteristic proteins at a higher rate than healthy cells, and many of these proteins enter circulation to play
7
in angiogenesis, invasion, and metastasis when deregulated in cancer.[77, 85] Secreted proteins have also been increasingly recognized for their role in the mechanisms of drug response.[86] Proteins secreted or shed by cancer cells, collectively referred to as the “cancer secretome”, could therefore be phenotypic biomarkers. More importantly, in clinical practice these tumor-characteristically secreted proteins may be detectable in blood or other bodily fluids in a non-invasive manner.[83, 84]
Challenges in blood-based proteomics and alternative approaches
Immunoassays are in wide clinical use for the detection and quantification of individual plasma proteins but are limited by isoform specificity and low multiplex capability.[87] Mass spectrometry (MS) –based proteomics is a commonly used technology which can overcome these limitations.[85, 87] However, a major challenge in biomarker discovery using blood-based proteomics is the complex diversity of blood. Thousands of proteins with varying isoforms and glycosylation patterns, have a dynamic range of abundance spanning 10 or more orders of magnitude.[85, 88] Albumin alone comprises over half of the protein mass in blood, and only a dozen proteins account for 95% of total blood protein mass.[88, 89] These highly abundant proteins may suppress the detection or quantification of lower abundance proteins which are potential biomarkers.[85] Several methods have been developed to address this obstacle by depletion of high abundance proteins from the plasma sample before MS analysis, including Cibacron blue dye to remove albumin, protein A and G resins to remove immunoglobulins, and various commercial products incorporating multiple antibodies to deplete panels of 7-50 highly abundant proteins.[90-93] Despite improving low abundance protein identification, these methods are inefficient and unreliable due to the depletion of unintended targets.[92, 94]
8
to the need for collection protocol standardization.[77] Proximal fluid controls may also be insufficient due to discrepancies in fluid output from disease and healthy tissue.[101] Likewise, the use of tumor interstitial fluid is complicated by difficulty in sample availability, and proteomic results are directly influenced by the collection method.[102] On the other hand, cell lines are benefitted by the reduced complexity of conditioned media versus biological fluids and
controlled experimental conditions which limits experimental variability.[77] Sampling of cell line conditioned media has therefore become a common approach to proteomic secretome
analysis.[99, 103-106]
Label Free Quantitative Proteomics
9
labels in metabolically active cells. Even within these broadly general groupings, numerous options exist with each offering advantages and disadvantages. For example, labeling techniques can tag peptides chemically, metabolically, or enzymatically, while label-free quantitation (LFQ) techniques can be ion counting- or intensity-based. Multiple approaches are further available even within these narrower groupings.
Increasingly, LFQ approaches are being employed to replace or complement labeling methods due to the ease of experimental set-up and relative low cost. Two major methods have emerged for label free quantitation. The first, known as spectral counting (SC), provides relative quantitation by comparing the number of MS/MS spectra produced by the same protein across multiple liquid chromatography-tandem MS (LC-MS/MS) runs. The second is based on the precursor ion intensity as determined by the extracted ion chromatogram (XIC), which is the plot of intensity versus retention time of a particular m/z value. Both LFQ methods offer several benefits over labeling methods. (i) LFQ approaches typically identify larger number of proteins with a wider dynamic range of detection compared to labeling methods.[107] (ii) Both LFQ approaches are less expensive because no special media or expensive reagents are required to perform an experiment.[107] (iii) LFQ workflows are simpler and faster because there is no need to determine labeling efficiency.[108] (iv) LFQ approaches offer the ability to compare a large number of experiments, whereas labeling methods are limited in multiplexing capabilities.
Ion counting-based label-free quantitation
10
accurate than other available methods.[112] However, unlike most other LFQ methods emPAI can be used to estimate total protein abundance.[111]
In the spectral counting method, the number of MS/MS spectra identified for a given protein across multiple LC-MS/MS runs provides relative quantification.[113] The relationship between spectral counts and protein abundance was first explored based on the observation that more abundant proteins will produce a larger number of proteolytic peptides.[113] These peptides are more likely to be sampled, yielding a higher number of spectra.[113] Indeed, protein abundance is strongly correlated (r2=0.9997) to spectral count but only weakly correlated to peptide count or sequence coverage.[113] However, the common use of dynamic exclusion to aid in the identification of low abundance peptides has a suppressive effect on quantitation by spectral counting. [107] Dynamic exclusion parameters which maximize identification of low abundance peptides while minimizing undersampling of highly abundant peptides have been reported, but this remains a consideration when designing an experiment.[114]
11
Absolute Protein Expression (APEX) algorithm which is a machine learning classification system that corrects spectral counts for the likelihood that a spectrum might be detected.[115]
SC shows some limitation in the ability to quantify small abundance changes. Typically, larger numbers of spectra must be identified in order to calculate smaller abundance changes.[107] The minimum detectable fold change and the number of spectra required can be improved by increasing the scoring requirements for spectrum identification.[118] However, these improvements come at the expense of dynamic range and the accurate quantification of lowly abundant proteins.[118] A final limitation of SC is the handling of peptides that can be assigned to more than one protein. Typically these spectra would be assigned to all possible matching proteins.[119] This has an obvious negative impact on the accuracy of the quantitation for those proteins, since any peptide can only have been generated by a single protein.[119] To address this issue the distributed Normalized Spectral Abundance Factor (dNSAF) was developed, which divides shared spectra proportionally between the possible contributing proteins based on the distribution of the other identified unique peptides.[119]
Intensity-based label-free quantitation
12
One concern with XIC-based quantitation is that XIC mapping is based on the full MS spectrum while peptide identification is based on MS2 spectra. However, MS is typically operated in a data dependent manner such that MS1 and MS2 spectra are obtained in the same run with MS2 acquisition being based on MS1 results. Because identification and quantitation are competing for scan time, a balance must be achieved between these goals. Excess time dedicated to peptide identification will negatively impact quantitation. Conversely, too much focus on quantitation will reduce the number of MS2 scans leading to a lower number of peptides identified. Another concern with XIC-based quantitation versus SC is that peak identification, noise reduction, retention time alignment, and peak intensity calculations including normalization require significantly more computational power than the simpler spectral counting process. Several algorithms requiring varying levels of computational strength have been published. (Reviewed in Ref. [123])
Numerous comparisons between SC and XIC-based quantitation have been performed (Reviewed in Ref. [124]). XIC-based methods are consistently more sensitive and more accurate than SC when using high resolution mass spectrometers because these machines are able to discriminate between co-eluting peptides of similar mass while allowing the accurate mapping of XIC to peptide.[125] XIC-based quantitation also offers the advantage of accurately discerning fold-changes as low as 1.1 versus the SC limit of approximately 1.4. [112, 116] Some reports have also noted that SC tends to overestimate low abundance peptides.[126, 127]
Limitations of single-omics approaches
13
14
CHAPTER 2: NOVEL SECRETOME-TO-TRANSCRIPTOME INTEGRATED OR SECRETO-TRANSCRIPTOMIC APPROACH TO REVEAL LIQUID BIOPSY BIOMARKERS FOR
PREDICTING INDIVIDUALIZED PROGNOSIS OF BREAST CANCER PATIENTS
INTRODUCTION
Breast cancer (BC) is the most prevalent type of cancer among women in the United States, with over 200,000 new diagnoses of invasive BC per year.[130] However, significant
heterogeneity among BC tumors contributes to highly variable clinical pathology and patient outcomes, ultimately confounding efforts toward precision diagnosis and prognosis.[131] A 50-gene expression pattern has been used to classify five molecular subtypes or PAM50-subtypes, including basal-like/triple-negative (BLBC/TNBC), luminal-A and –B, Her2+, and normal-like BC.[64] Within these molecular subtypes, the luminal subtype accounts for approximately half of all tumors, [132] and BLBC/TNBC is the most aggressive form of the disease with the overall worst survival rate.[65] However, these gene-expression signatures are inadequate to resolve interpatient heterogeneity and patient subpopulations with different clinical outcomes cannot be stratified within each BC or PAM50 subtype.[133] These limitations arise because disease onset is directly governed by phenotype-specific proteomic changes [134, 135] which cannot be measured using genomic/transcriptomic tools or data alone. Because prognoses of BC patients cannot be easily discerned, there is an urgent need for individualized/personalized biomarkers
that predict patient-specific survival rates and therapeutic response so that standard
15
by cancer cells (the “cancer secretome”), could be phenotypic biomarkers. More importantly, in clinical practice these tumor-characteristically secreted proteins may be detectable in blood or other bodily fluids in a non-invasive manner.[84]
Secreted proteins, which constitute approximately 10% of the human proteome, play an important role in normal physiological processes including cell signaling, immune defense, and blood coagulation.[77] Further, when deregulated, secreted proteins are critical participants in pathological processes such as cancer angiogenesis, invasion, and metastasis.[77] Also, secreted factors have been increasingly recognized for their role in the mechanisms of drug response.[86] The studies of BC secretomes using nanoliter liquid chromatograph tandem mass spectrometry (nanoLC-MS/MS) to sample conditioned medium from cell lines, tumor/tissue interstitial fluid, or tumor proximal body fluids have been reported.[83, 99, 136-138] However, few proteins identified in these BC secretomes have established correlation with patient-specific clinical outcomes.
Technically, at the current level of sensitivity, mass spectrometry can detect only very limited regions of each individual protein, further limiting information about patient-specific alterations in these secreted proteins.[128, 129] Therefore, due to either the low phenotypic accuracy of genomics/transcriptomics or the low phenotypic coverage of proteomics, approaches that employ only single-omics methods will necessarily fail to identify biomarkers of patient-specific alterations which distinguish patient subpopulations having different clinical outcomes or
prognoses. To overcome these single-omics limitations for identifying new biomarkers to predict individualized prognosis in non-invasive, blood-based tests, we developed a new multi-omics method, termed secreto-transcriptomics, to identify the BC-subtypic secreted proteins that are encoded by genes bearing patient-specific mRNA expression patterns of prognostic
significance.
16
patient-specific proteomic alterations, integrating oncogenic (tumorigenic) multi-omics data for efficient de novo discovery of personalized/individualized prognostic markers. In the clinic, these markers may be used to stratify patients, within single PAM50 subtypes, into different prognostic groups, and predict treatment benefit and/or outcome with patient-specific or individualized sensitivity and specificity before any therapeutic decision for newly diagnosed breast cancer.
METHODS
Chemicals and reagents. Cell culture media and fetal bovine serum (FBS) were obtained from Gibco. All other components of cell culture media and protease inhibitor cocktails were
purchased from Sigma (St, Louis, MO). Trypsin was purchased from Promega. All chemicals were HPLC-grade unless specifically indicated. All cell lines including MCF10A, MCF7, MDA-MB-231, T47D, and HCC1806 were purchased from ATCC (Manassas,VA).
Secreted protein extraction from cell lines. MCF10A cells were cultured in DMEM/F12 supplemented with 5% horse serum, 20 ng/mL epidermal growth factor, 50 ng/mL cholera toxin, 500 ng/mL hydrocortisone, and 2 µg/mL insulin. MCF7 and MDA-231 cells were cultured in DMEM containing 10% fetal bovine serum. T47D and HCC1806 cells were maintained in RPMI supplemented with 10% fetal bovine serum. When cells reached approximately 70%
confluence, the growth media was removed, cells were washed twice with PBS, and serum-free media without phenol red was added to the plate. After 24 hours the conditioned media were collected and centrifuged at 500 x g for 5 minutes to remove cellular debris, then the
17
centrifuged for 10 minutes at max speed, 4° C. The pellets were washed in cold acetone and air dried until no residual odor was detected. Next, the pellets were resuspended in 50 μl buffer (8 M Urea, 50 mM Tris-HCl pH 8.0, 150 mM NaCl), reduced with dithiothreitol (5 mM final) for 30 minutes at room temperature, and alkylated with iodoacetamide (15 mM final) for 45 minutes in the dark at room temperature. Alkylation was quenched with dithiothreitol (10 mM final).
Samples were diluted 4-fold with 25mM Tris-HCl pH 8.0, 1mM CaCl2 and digested with 500 ng
trypsin overnight at room temperature. Peptides were desalted on a StageTip containing a 4 × 1 mm C18 extraction disk (3M) and dried.[139]
LC-MS/MS analysis. Desalted peptides were dissolved in 20 μl 0.1% formic acid (Thermo-Fisher), of which 2 μl was injected and analyzed by an Easy nanoLC 1000 coupled to a Q-Exactive Orbitrap mass spectrometer (Thermo Fisher Scientific, San Jose, CA) Peptides were loaded on to a 15 cm C18 RP column (15 cm × 75 μm ID, C18, 2 μm, Acclaim Pepmap RSLC,
Thermo-Fisher) and eluted with a gradient of 2-30% buffer B at a constant flow rate of 300
nl/min for 70 min followed by 30% to 80% B in 5 min and 80% B for 10 min.The Q-Exactive was
operated in the positive-ion mode but using a data-dependent top 20 method. Survey scans
were acquired at a resolution of 70,000 at m/z 200. Up to the top 20 most abundant isotope
patterns with charge ≥ 2 from the survey scan were selected with an isolation window of 2.0 m/z
and fragmented by HCD with normalized collision energies of 27. The maximum ion injection
time for the survey scan and the MS/MS scans was 250 ms and 120 ms, respectively and the
ion target values were set to 1e6 and 2e5, respectively. Selected sequenced ions were
dynamically excluded for 20 seconds.
Mass spec data and LFQ analysis. Mass spectral processing and peptide identification were
performed on the Andromeda search engine in MaxQuant software (Version 1.5.3.17) against a
human UniProt database. All searches were conducted with a defined modification of
cysteine carbamidomethylation, with methionine oxidation and protein amino-terminal
18
approach with a peptide false discovery rate (FDR) of 1% and a protein FDR of 5%. A minimum
peptide length of 7 amino acids was required, maximally two missed cleavages were allowed,
initial mass deviation for precursor ion was up to 8 ppm and the maximum allowed mass
deviation for fragment ions was 0.5 Da. LFQ-based LC-MS/MS experiments were conducted in
multiple replicates (three biological replicates each with two technical replicates). For LFQ analysis, a match between runs option was enabled and time window at 0.7 minutes. Data
processing and statistical analysis were performed on Perseus (Version 1.5.1.6)[140].
Analysis of functional category and networks of subtype-specific secreted proteins. The
biological processes and molecular functions of the G9a-interacting proteins were categorized by Ingenuity Pathway Analysis (IPA) [141] and STRING [142] similar to previously described. [143]
TCGA and METABRIC data sets. All TCGA and METABRIC data used in our study were
retrieved from cBioPortal [144, 145] using the ‘cgdsr’ R package (version 1.2.6)[146]. For our analysis of TCGA data, we used complete samples (case list id =
brca_tcga_pub2015_3way_complete / brca_tcga_pub2015_freeze) with mutation, copy-number, and mRNA expression data provided (N = 816) from the TCGA cancer study
brca_tcga_pub2015 (Breast Invasive Carcinoma)[147]. The mRNA expression data sets for G9a interactor genes were obtained from TCGA Genetic Profile:
19
publication.[147] For the METABRIC [148, 149] data we used: case list id =
brca_metabric_cnaseq (samples with mRNA, GISTIC, mutational data), gene profile = brca_metabric_mrna_U133_Zscores (for mRNA expression), and gene profile =
brca_metabric_cna (for GISTIC data). We used 1866 of the 2051 samples in the METABRIC case list for which there was survival data.
Heatmap construction. The heatmaps of mRNA expression levels SeCEP genes from the
TCGA BRCA datasets were constructed using the ‘ComplexHeatmap’ R package (version 1.12.0)[150]. Hierarchical clustering was performed using the euclidean distance method and the Ward clustering method (option ward.D2 in R’s hclust function).
Statistical Analyses. Kaplan-Meier curve plotting and statistical analysis for differences of overall survival (OS) based on mRNA expression of SeCEP genes among TCGA BRCA
samples, and distant relapse free survival (DRFS) for the GSE25066 samples, were performed using the ‘survival’ R package (2.41.3).[151] Kaplan-Meier estimator and log-rank tests were performed using the survival functions Surv, survfit, and survdiff. Cox proportional hazard
survival analysis was performed using the survival function coxph. Mann-Whitney-Wilcoxon Test was performed using the wilcox.test function in R. In the iCEP analysis, we included all genes in the TCGA (n = 18,097) or METABRIC (n = 16,555) data sets in order to obtain an adjusted p-value for multiple comparisons for the SeCEP genes. The adjusted p-p-values were calculated by submitting all the p-values from the individual Mann-Whitney-Wilcoxon Tests determined for each gene to the p.adjust function in R using the ‘fdr’ method.
RESULTS
The secreto-transcriptomic workflow for discovering candidate biomarkers for
non-invasive, individualized prognosis.
20
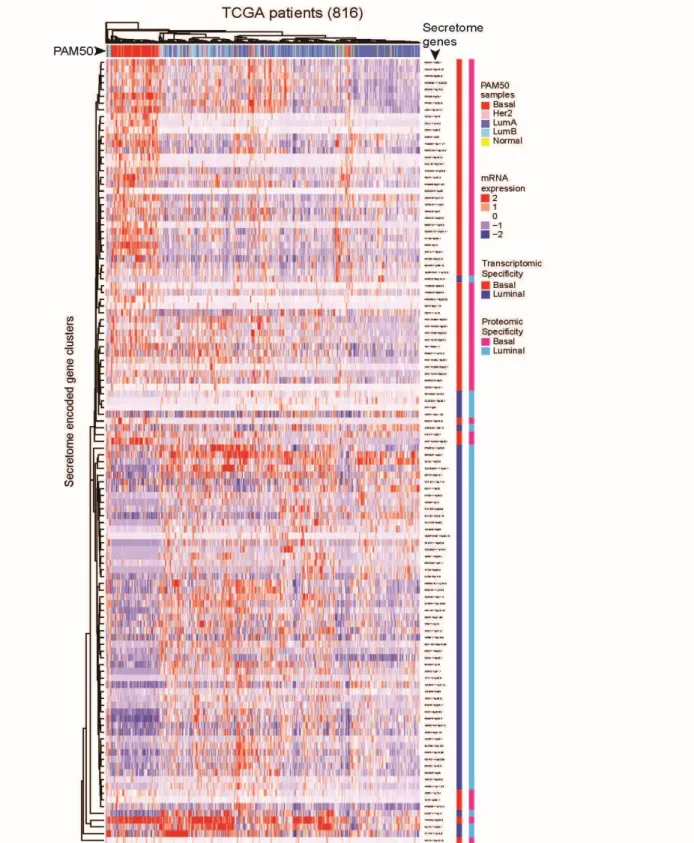
The proteins showing BC or PAM50 subtype-specific or subtypic secretion were identified by LFQ-based Perseus analysis.[152] Taking advantage of the databases of two large patient cohorts, TCGA [147] and METABRIC (Molecular Taxonomy of BC International Consortium) [148], which contain clinic-pathologically correlated gene-expression or transcriptomic data, we retrospectively established the proteo-transcriptomic links between BC subtypically secreted proteins and the patient-specific mRNA-expression alterations of the genes that encode these proteins. As a result, this proteo-transcriptomic approach identified the secretome-encoding genes that showed a secretion-correlated mRNA expression pattern (SeCEP), wherein the patient-specific mRNA expression of these genes was positively correlated with increased secretions of the proteins encoded by these genes in similar BC subtypes. This expression-to-secretion correlation not only indicated those genes that are fully translated into extracellularly functional, oncogenically active proteins, but also identified new phenotypic markers that describe the similar PAM50-classified BC subtype. Further, Kaplan-Meier (KM) survival analyses were used to distinguish, from >18,000 genes, patient-specific mRNA expression patterns of select SeCEP genes of prognostic value, indirectly identifying those proteins showing BC subtypic secretion as candidate markers for non-invasive prognostic prediction.
LFQ secretome screening identified particular protein clusters showing BC-subtypic
secretion.
We used a similar LFQ proteomic approach [153, 154] to comparatively profile the extracellular proteins secreted from different cell lines, respectively representing the
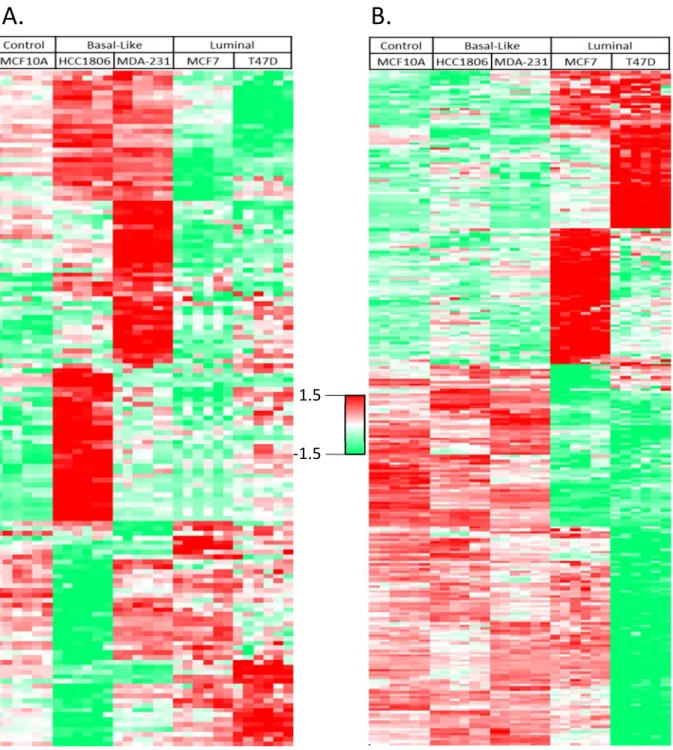
BLBC/TNBC subtypes (MDA-231 and HCC1806), luminal subtypes (MCF-7 and T47D), and non-malignant mammary control (MCF10A). (Figure 2.2a) A total of 2,345 proteins were identified in these five cell lines. Using existing databases of secreted proteins we then examined the purity of our secretome isolation. The analysis of Gene Ontology Cellular
21
known for their locations in the extracellular space or plasma membrane. Also, 503 proteins were previously known as secreted or highly likely secreted proteins in the MetazsecKB database that is generated by multiple bioinformatics tools including SignalP4, TMHMM, and TargetP.[155] By comparing our identifications to a number of experimentally identified secretomes 832 proteins were found in common in the secretome from the LPS-stimulated macrophages [154] and 1042 proteins were also identified in a breast cancer secretome.[156] These results in combination validated the high quality of our secretome preparation and analysis.
To identify the proteins showing BC-subtypic secretion we used the Profile Plot function of the Perseus software platform [152] to determine the relative abundances of individual secreted proteins across different cell lines, which correlate with the LFQ ratios of identified proteins. Profile Plot performs pattern matching but does not perform statistical testing on the identified proteins, therefore the statistical significance of protein abundance changes between BC subtypes was validated by one-way ANOVA. As a result we identified clusters that contain the proteins showing increased or decreased secretion only in either BLBC- or luminal-subtypic cell lines, respectively. (Figure 2.2 b-e)
22
Similarly, we identified a total of 274 proteins that showed luminal-specific secretion changes in one or both of the luminal cell lines (Figure 2.3b), including decreased secretion of several members of the cathepsin family of globular proteases such as CTSB, CTSL, and CTSZ that were known to promote breast cancer progression and metastasis, [162] and the increased secretion of metastasis suppressor PEBP1 (a.k.a. RKIP) that showed luminal-specific
intracellular expression.[163]
Immunoblotting of some of BC-subtypic secreted proteins showed consistent results with LFQ secretome screening (Figure 2.4).
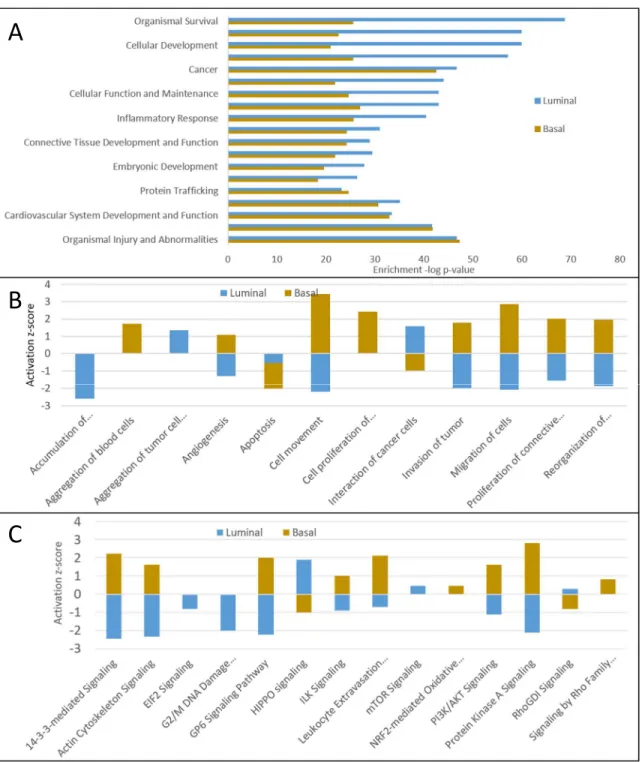
Using bioinformatics tools including Ingenuity Pathway Analysis (IPA) [141] and the Search Tool for the Retrieval of Interacting Genes/Proteins (STRING) database [142] we then studied the biological processes and pathways in which these BC-subtypic secreted proteins are involved. In the IPA annotation, greater than 95% of all identified BC-subtypic secreted proteins, i.e., 136 of 141 BLBC-specific and 269 of 274 luminal-specific secreted proteins were respectively cancer-related.
Figure 2.5a shows the biological processes that are over-presented by the BLBC- and luminal-specific proteins. Although major biological processes are comparable between
subtypes, more detailed analysis of these broad categories highlighted the differences between subtype characteristics. BLBC-specific proteins were involved in increased cell movement or migration, invasiveness of breast cancer cells, and cell survival, while luminal-specific proteins were associated with decreases in cell movement and vascularization, indicating the
aggressiveness differences between these two BC subtypes (Figure 2.5b).
IPA analysis of BLBC-specific secreted proteins (Figure 2.5c) indicated the activation of a few known BC-driving signaling pathways, including PI3K-Akt signaling, [164] protein kinase A signaling, [165] signaling by Rho family GTPases, [166] the 14-3-3-mediated signaling
BLBC-23
specific proteins indicated that the activity of the HIPPO signaling was suppressed in BLBC cells, which could lead to a more invasive tumor phenotype.[169] On the other hand, the
luminal-specific secreted proteins revealed activation of HIPPO and mTOR signaling along with the suppression of eIF2 signaling, G2/M DNA damage checkpoint regulation, and ILK signaling (Figure 2.5c).
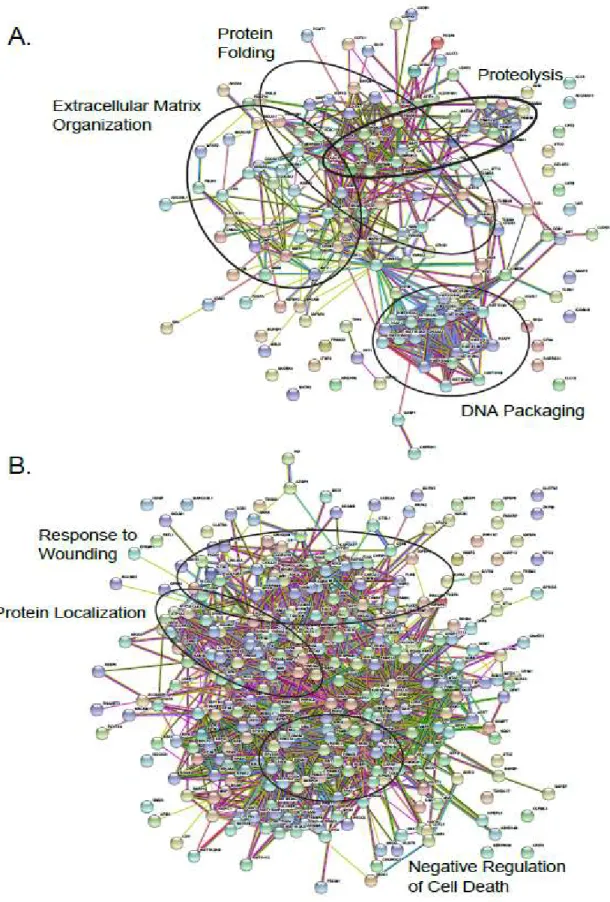
To further determine the functional networks involving BC subtypic secreted proteins we performed protein-protein interaction (PPI) analysis using STRING, which revealed statistically significant enrichment of PPIs among the proteins secreted in both BLBC-specific (p<1e-16) and luminal-specific (p<1e-16) manners (Figure 2.6). The Gene Ontology Biological Process enrichment of the proteins with BLBC-specific increased secretion identified multiple
subnetworks associated with protein folding, regulation of cell communication, regulation of apoptosis, cell development, regulation of cell motility, blood coagulation, and proteolysis. Analysis of the proteins with decreased secretion in BLBC cells also revealed particular
subnetworks/pathways with suppressed activities, including DNA damage response, regulation of actin depolymerization, and regulation of cell-cell adhesion. In contrast, the proteins showing luminal-specific increases of secretion over-represented the subnetworks associated with regulation of growth, and cell differentiation while the proteins with decreased secretion in luminal cells were involved in positive regulation of apoptotic process, angiogenesis, extracellular matrix disassembly, and cell motility. These results showed that the proteins secreted or secretomes are characteristic of distinct BC subtypes.
The genes that encode increasingly secreted proteins showed secretion-correlated mRNA
over-expression patterns in BC patients in a PAM50-subtypic manner.
24
or luminal-specific secretion. These databases contain large cohorts of > 2600 BC patients that were classified by PAM50 as the BLBC/TNBC, luminal-A and luminal-B, Her2+, and normal-like BC subtypes, [170] and the information about mRNA expression, mutations, copy-number variations, and associated clinical/pathological data (stages/grades and relapse status).
First, to determine the mRNA expression differences between BLBC and luminal A/B TCGA patients we performed a Mann-Whitney-Wilcoxon Test on the z-scored expression values (downloaded from the cBioPortal for Cancer Genomics [144, 145]) of the two PAM50-subtypic populations. This test was performed on all secreted protein-encoding genes in each subtype-specific dataset, and p-values were adjusted by the Benjamini Hochberg procedure for multiple testing. Using this multi-testing scheme, a secreted protein-encoding gene was classified as BLBC if the expression level between the two PAM50-subtypic populations was significantly different (adjusted p-value < 0.05) and the median mRNA expression was greater among BLBC patients. Likewise, a gene was classified as luminal if its median mRNA expression level was higher for luminal patients and the gene showed a statistically significant difference between luminal and BLBC patients (adjusted p-value < 0.05).
25 active secretome in a BC-subtypic manner.
Further, we observed interpatient heterogeneity in the mRNA expression pattern of secretome genes within each PAM50 subtype, i.e., not all SeCEP genes were simultaneously overexpressed at the mRNA level in each individual BLBC or luminal patient. Bearing in mind that mRNA expression patterns of PAM50 genes are insufficient to stratify the patient subsets with different clinical outcomes or prognoses, we reasoned that, within a single
PAM50-classified subtype, these patient mRNA expression variations of select SeCEP genes can mark the patient subpopulations with distinct prognoses.
Patient-specific mRNA co-overexpression patterns of select secretome-encoding genes
mark the high-risk subpopulations of PAM50-subtypic patients with poor prognosis.
To identify BC-subtypic secreted proteins of prognostic significance, we performed Kaplan-Meier (KM) analysis on PAM50-subtypic patients in the two independent datasets TCGA and METABRIC [148, 149] for any combination of up to five SeCEP genes having mRNA
overexpression (z-score > median z-score) for all genes in the combination. The statistical significance of each gene combination was determined by a multi-parameter threshold including log-rank p value < 0.05 and lower 95 confidence interval for the hazard ratio > 1 in both the TCGA and METABRIC datasets.
For example, we identified approximately 8% or more subpopulations of BLBC patients who showed mRNA co-overexpression of four BLBC-specific SeCEP genes, YWHAZ, GDA, MFAP2, and PRKCSH in correlation with poor survival (Figure 2.9 a,b). YWHAZ, which encodes the 14-3-3ζ protein, was characterized as a promoter of cell survival which, when
overexpressed, is associated with poor prognosis and disease-free survival.[171, 172] Another SeCEP gene combination indicating the co-overexpression-correlated poor prognosis was ADM, PSMB6, SERPINH1, and SFN (Figure 2.9 c,d). ADM was known to promote
26
in ovarian cancer patients.[175] Interestingly, although SFN (14-3-3σ or stratifin) was considered as a tumor suppressor, overexpression in BLBC was reported.[176] Recently, overexpression of SFN was found to be associated with tumor invasion and migration.[177] Another BLBC subpopulation showed co-overexpression of GAL, MMP12, MSLN, and a multifunctional oncoprotein SET.[178] (Figure 2.9 e,f).
Similarly, this secreto-transcriptomic approach enabled identifications of the distinct subpopulations of luminal patients with poor prognosis. Further, as an example of how the co-overexpression of multiple SeCEP genes improves the specificity and sensitivity in predicting personalized prognosis, as shown in Figure 2.10 a,b, overexpression of CLEC3A alone indicated modest differences in the overall survival rate of two major luminal patient
subpopulations. However, the luminal patient subsets showing co-overexpression of CLEC3A with CTTN, IGFBP5, NRCAM were statistic-significantly correlated with worse prognosis and can be readily discriminated from other luminal patients (Figure 2.10 c,d). Among these SeCEP genes, CLEC3A is a C-type lectin that promotes tumor adhesion in breast cancer [179] and was recently found to enhance plasminogen activation by tissue-type plasminogen activator.[180] CTTN encodes cortactin, an actin cytoskeleton regulator that promotes metastasis in breast cancer.[181] Meanwhile, co-overexpression of CLEC3A with ALDOA, EEA1, and FKBP4 was also associated with substantially worse prognosis than CLEC3A alone. (Figure 2.10 e,f)
Importantly, the use of co-overexpressed SeCEP genes can further resolve individual luminal subtypes among luminal patients to identify the high-risk subpopulations of luminal-A or luminal-B patients. For example, the luminal-A subpopulations overexpressing CAPZA2,
27
metastasis, [182-185] over-expression of these genes individually did not provide subtype-specific prognostic value. Overall, we found 52 gene combinations with co-overexpression that showed poor survival among luminal-A patients but not in other BC subtypes.
Several gene co-overexpression patterns specifically correlated with luminal-B patient prognosis were also identified. In the co-overexpression pattern involving HSP90B1, EEF1A2, EIF4B, and KRT18, (Figure 2.12 a,b) HSPB1 was known to play a role in
epithelial-mesenchymal transition and tumors overexpressing HSPB1 demonstrated enhanced drug resistance.[186] Similarly, luminal-B patients overexpressing a combination of AGR2, CYFIP2, KRT18, and RAB1B exhibited worst overall survival while luminal-A patients and the combined luminal A/B group showed no significant differences in survival (Figure 2.12 c,d). In total we identified 39 gene combinations that, when overexpressed, indicated poor overall survival specifically among luminal-B patients. Our combined results demonstrated that patient-specific co-overexpression of SeCEP genes can resolve the interpatient heterogeneity within different PAM50-subtypes, confirming that these gene expression alteration patterns are prognostically meaningful in distinguishing the subsets of BLBC or luminal patients with distinct clinical outcomes with multi-testing of large patient cohorts.
co-28
overexpression of CAPZA2, CBX1, G6PD, and NQO1 had worse survival (Figure 2.13 a,b). NQO1 was highly expressed in BC patients with high HER2 expression and was linked to increased metastasis.[187] High expression of CYFIP1, DDR1 and GYG1 was also associated with worse survival (Figure 2.13 c,d), and DDR1 was linked to BC invasion and drug
resistance.[188, 189] Another HER2-enriched subpopulation with poor survival showed co-overexpressed G6PD, CYFIP1, PSMC2, and KYNU (Figure 2.13 e,f), the latter of which has been implicated in increased metastasis and tumor aggressiveness.[190] In sum, these results indicate that altered mRNA expression patterns of select luminal SeCEP genes can be used to distinguish the distinct subpopulations of HER2-enriched patients with poor prognosis.
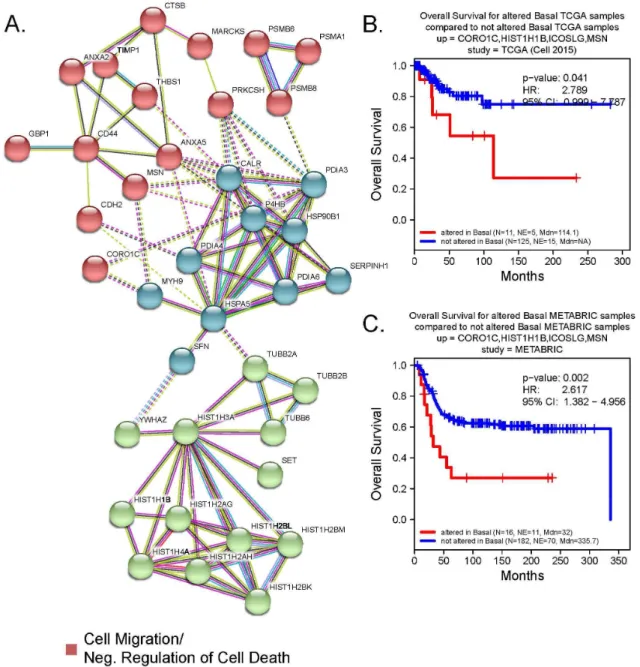
More importantly, the majority of the genes encoding BLBC- or luminal-specific secretome in networks showed statistically significant, secretion-correlated cis-mRNA
expression in some BC patients. Further, by identifying their co-overexpressed patterns in BC-subtypic patients, we revealed the pathological or prognostic significance of these secreted proteins in multiple interactive sub-networks (Figure 2.14a). Strikingly, the majority of the BLBC-specific proteins involved in the interactive subnetworks associated with unfolded protein response, cell migration, and negative regulation of cell death. Specifically, the glycoprotein THBS1 promoted BC invasion and metastasis and was associated with disease recurrence in BC patients.[191, 192] Similarly, higher serum levels of metallopeptidase inhibitor TIMP-1 were associated with increased likelihood of BC metastasis.[193] Further, the disulfide isomerase PDIA6 promoted tumor immune evasion [194] and enhanced cell proliferation by activating Wnt/β-catenin signaling.[195] Three of four genes in the combination of CORO1C, MSN,
ICOSLG, and HIST1H1B are in this subnetwork, and KM analysis reveals a significant decrease in the overall survival rate of BLBC patients overexpressing these genes. (Figure 2.14 b,c)
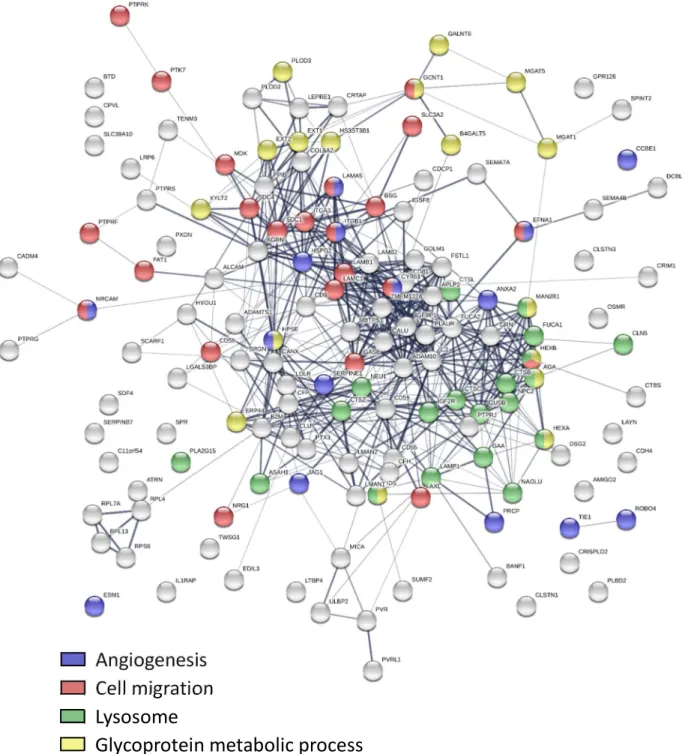
Luminal-specific subnetworks were also identified, (Figure 2.15a) however there was no biological process enrichment observed. These oncogenically active interacting proteins
29
included RHOC, a small GTPase that regulates cytoskeletal architecture [197] and is associated with increased rates of metastasis.[198] SNCG, a neuronal protein overexpressed in BC was also associated with higher likelihood of metastasis.[199] TCGA and METABRIC patients exhibiting a four gene co-overexpression pattern involving SNCG, CLEC3A, DNPEP, and KRT18, three of which are members of the interacting subnetworks, had lower overall survival rates (Figure 2.15 b,c). Together, these results indicate the coordinated, extracellular oncogenic activity of the networked proteins.
Secreto-transcriptomic analysis identified patient-specific co-overexpression patterns of
select secreted proteins as prognostic markers to predict personalized response to
therapy.
Nether the TCGA nor the METABRIC study was designed to answer specific clinical questions. To assess the clinical significance of altered mRNA expression of multiple SeCEP genes in predicting the response to specific therapeutic interventions, we next looked for distinct combinations of SeCEP genes showing statistically significant changes in distant relapse free survival (DRFS) among patients receiving neoadjuvant taxane-anthracycline therapy in the clinical trial GSE25066.[200] Following similar procedures to those described above for TCGA and METABRIC, we performed KM analysis on the BLBC-SeCEP genes in combinations of up to five genes having mRNA overexpression (z-score > median z-score) for all genes in the combination.
Among BLBC patients, we found 12 combinations with >10% of both GSE25066 and TCGA patients overexpressing each gene in the combination and having a significant difference in DRFS. Examples are shown in Figure 2.16 a,b. One such combination was ANXA2, CALR, MFAP2, and SERPINH1. ANXA2 has been reported as an independent predictor of poor prognosis in breast cancer patients receiving neoadjuvant therapy, [201] however
30
GSE25066 patients. Likewise, co-overexpression of ADM, MAGEA4, and PRKCSH was also associated with a statistically significant change in DRFS. Similar analysis of luminal-SeCEP gene combinations yielded five combinations with at least 10% of patients in both the
GSE25066 and TCGA datasets overexpressing all genes in the combination and p value < 0.05. One combination was BLVRB, EIF4B, and ISOC1 (Figure 2.16c). Importantly, BLVRB is
associated with the development of chemotherapeutic resistance, though overexpression of BLVRB alone did not predict worse patient outcomes.[202]
Overall, these analyses identified the subpopulations within each PAM50 subtype with resistance to neoadjuvant anthracycline-taxane therapy along with the correlation to their poorer overall survival. Thus, we demonstrate the potential clinical uses of the analysis to aid the clinician in determining the appropriate therapeutic intervention to be employed.
DISCUSSION
The development of a novel secreto-transcriptomic approach underlies our innovation in the identification of liquid biopsy biomarkers capable of discriminating between patient
subpopulations having variable outcomes. Recognizing that single-omics approaches are insufficient for making these distinctions, due to the negligible data on the oncogenic phenotype provided by genomics/transcriptomics and the inadequate phenotypic coverage of patient-specific proteomics offers, our secreto-transcriptomic workflow is a multi-omic integrated method which offers a robust and efficient scheme to distinguish patient subpopulations within each BC subtype. First, by using a LFQ-based nanoLC-MS/MS approach for secretome
31
(Molecular Taxonomy of BC International Consortium). [148] We found a PAM50-subtypic Secretion-Correlated mRNA Expression Pattern (SeCEP) wherein the PAM50-subtypic secretion of some proteins showed statistically significant cis-mRNA expression of the genes that encode them in patients with the corresponding PAM50-subtypes. This expression-to-secretion correlation highlighted those genes that are fully translated into the oncogenically active secretome in a PAM50-subtypic manner. Further, we observed that patient-to-patient mRNA expression variations of individual secretome genes describe the interpatient
heterogeneity within each single PAM50 subtype. In this regard, patient-specific
co-overexpression of distinct SeCEP genes were found in correlation with specific prognoses within distinct subsets of BLBC or luminal-A and luminal-B patients. Currently, available blood-based tests for cancer prognosis or diagnosis are often based on a single gene or protein marker, therefore lacking the specificity and sensitivity in determining individualized clinical
outcomes.[204] Our identification of multi-gene or multi-protein panels as systems signatures can precisely describe the predominant tumor phenotype with significantly improved phenotype accuracy. Because our workflow starts with the identification of tumor-phenotypic alterations and work back to the genotypic data with the coverage of patient-specific alterations, we are able to bypass the need for extensive modeling [205] or analysis of a large number of patients [206] by pinpointing a few prognostically significant marker genes.
32
aggressive nature of BLBC subtype in general. Similarly, pathway activation analysis found the same pathways enriched in both subtypes, but with opposite activation states.
We identified multiple over-secreted proteins exhibiting a BC-subtypic SeCEP consistently in both TCGA and METABRIC databases with > 2600 BC patients which constitute the subtype-specific fully translated oncogenic-active secretome. Additionally, the co-overexpression of multiple SeCEP genes in unique combinations was prognostic of differential survival rates of subpopulations within each PAM50-subtype. Further, these co-overexpressed gene
combinations were distinct for each subtype, i.e. combinations showing decreased overall survival in one subtype did not exhibit altered survival rates in other subtypes.
There are some important considerations to note in this study. First, due to the significant breast tumor heterogeneity our work cannot, and is not intended to, identify all of the secreted proteins relevant to the characteristics of a given tumor. We used breast cell lines as a model system to identify potential markers and reinforce these identifications with a broad set of patient
data. In order to efficiently connect patient outcomes to potential markers, we must select practical criteria. The high expression/high secretion correlation provides a reasonable and straightforward link between the secretome and the transcriptome. Alternate
expression/secretion patterns are observed, however these are harder to quantify and correlate. Importantly, it is not necessary to identify every gene combination of relevance in order to identify specific patient subpopulations with poorer outcomes. The present study also has some limitations which preclude the ability to identify all such subgroups, including the number of basal and luminal cell lines examined and the exclusion of the HER2-enriched subtype from the secretome analysis. Despite these limitations our work names several noteworthy gene
combinations which define specific patient subpopulations, but more importantly provides a template for the further identification of combinations defining other subgroups.
gene-33
coded proteins are putative liquid biopsy markers to distinguish high-risk populations within PAM50-subtypic classification. Importantly, we also demonstrated the clinical utility of this method in identifying patient subpopulations with the worst outcomes in response to specific therapeutic interventions.
CONCLUSIONS
34
Figure 2.1 - Schematic of secreto-transcriptomic approach for identifying putative liquid biopsy prognostic markers. Label-free quantitative (LFQ) proteomics is used to resolve the
compositional differences in cell line secretomes. Then, TCGA/METABRIC patient data are analyzed to determine the PAM50-subtypic transcription of genes encoding the proteins
exhibiting either BLBC- or luminal-specific secretion. Kaplan-Meyer (KM) analysis is performed on combinations of genes showing a secretion-correlated mRNA expression pattern of
35
36
Figure 2.3 - A heatmap of unsupervised hierarchical clustering analysis of the z-scored basal-specific (A) and luminal-basal-specific (B) proteins (rows) secreted by five cell lines (columns). Each cell line is represented by 3 biological replicates and 2 technical replicates. Red indicates higher secretion, green indicates lower secretion, and white indicates mean secretion.
A.
B.
1.5
38
Figure 2.5 - A) Over-represented biological processes in the basal-like and luminal BC subtypes. Bars representing the negative log p-values of BLBC process enrichment are
displayed in orange and luminal values are in blue. B) Biological functions activated (positive z-score) or suppressed (negative z-z-score) in the BLBC (orange) and luminal (blue) PAM50 subtypes. C) Pathway activation analysis of PAM50 subtypes. Orange bars represent BLBC values and blue bars represent luminal values. Positive z-scores indicate pathway activation; negative z-scores indicate pathway suppression.
A
B
39
40
41
Figure 2.8 - Box plots showing the statistically significant altered mRNA expression (x-axis) for BLBC and luminal secreted proteins among TCGA patients. The distribution of mRNA
43
Figure 2.9 - Correlation between Kaplan-Meier survival plots of the clinical outcomes and mRNA co-overexpression of indicated basal SeCEP genes based on TCGA (left column) and
45
46
47
49
Figure 2.13 - Correlation between Kaplan-Meier survival plots of the clinical outcomes and mRNA co-overexpression of indicated luminal SeCEP genes based on HER2+ patient data. "N" refers to "Number of patients," and "NE" refers to "Number of Events (Overall Survival status = DECEASED)". Each plot shows the log-rank p-value and Hazard Ratio (HR) with 95%
Confidence Interval (CI) between the two groups. The red line designates the patient