J
OURNAL OF
C
LINICAL
O
NCOLOGY
O R I G I N A L
R E P O R T
Ethan Basch, Mark G. Kris, Howard I. Scher, Clifford A. Hudis, Paul Sabbatini,
Lauren Rogak, Thomas M. Atkinson, Joanne F. Chou, Dorothy Dulko, Laura Sit,
Michael Fruscione, and Deborah Schrag, Memorial Sloan Kettering Cancer Center,
New York, NY; Ethan Basch, Allison M. Deal, and Antonia V. Bennett, University
of North Carolina, Chapel Hill, NC; Amylou C. Dueck, Mayo Clinic, Scottsdale, AZ; Allison Barz, Children’s Hospital of Philadelphia, Philadelphia, PA; Paul Novotny and Jeff A. Sloan, Mayo Clinic,
Rochester, MN; and Deborah Schrag, Dana-Farber/Harvard Cancer Center,
Boston, MA.
Published online ahead of print at
www.jco.orgon December 7, 2015.
Supported by the National Cancer Institute and a grant from the Society of
Memorial Sloan Kettering.
The National Cancer Institute and the
Steps for Breath Fund of Memorial Sloan Kettering Cancer Center did not play any
role in the design and conduct of the study; collection, management, analysis,
and interpretation of the data; preparation, review, or approval of the manuscript; or decision to submit the manuscript for
publication.
Authors’disclosures of potential conflicts of interest are found in the article online at
www.jco.org. Author contributions are found at the end of this article.
Clinical trial information: NCT00578006.
Corresponding author: Ethan Basch, MD, Cancer Outcomes Research Program, Lineberger Comprehensive Cancer
Center, University of North Carolina, 170 Manning Dr, Chapel Hill, NC 27599;
e-mail: [email protected].
© 2015 by American Society of Clinical
Oncology
0732-183X/16/3406w-557w/$20.00
DOI: 10.1200/JCO.2015.63.0830
Symptom Monitoring With Patient-Reported Outcomes
During Routine Cancer Treatment: A Randomized
Controlled Trial
Ethan Basch, Allison M. Deal, Mark G. Kris, Howard I. Scher, Clifford A. Hudis, Paul Sabbatini, Lauren Rogak,
Antonia V. Bennett, Amylou C. Dueck, Thomas M. Atkinson, Joanne F. Chou, Dorothy Dulko, Laura Sit,
Allison Barz, Paul Novotny, Michael Fruscione, Jeff A. Sloan, and Deborah Schrag
See accompanying editorial on page 527
A B S T R A C T
Purpose
There is growing interest to enhance symptom monitoring during routine cancer care using
patient-reported outcomes, but evidence of impact on clinical outcomes is limited.
Methods
We randomly assigned patients receiving routine outpatient chemotherapy for advanced solid
tumors at Memorial Sloan Kettering Cancer Center to report 12 common symptoms via tablet
computers or to receive usual care consisting of symptom monitoring at the discretion of clinicians.
Those with home computers received weekly e-mail prompts to report between visits. Treating
physicians received symptom printouts at visits, and nurses received e-mail alerts when participants
reported severe or worsening symptoms. The primary outcome was change in health-related quality
of life (HRQL) at 6 months compared with baseline, measured by the EuroQol EQ-5D Index.
Secondary endpoints included emergency room (ER) visits, hospitalizations, and survival.
Results
Among 766 patients allocated, HRQL improved among more participants in the intervention group
than usual care (34%
v
18%) and worsened among fewer (38%
v
53%;
P
,
.001). Overall, mean
HRQL declined by less in the intervention group than usual care (1.4-
v
7.1-point drop;
P
,
.001).
Patients receiving intervention were less frequently admitted to the ER (34%
v
41%;
P
= .02) or
hospitalized (45%
v
49%;
P
= .08) and remained on chemotherapy longer (mean, 8.2
v
6.3 months;
P
= .002). Although 75% of the intervention group was alive at 1 year, 69% with usual care survived
the year (P
= .05), with differences also seen in quality-adjusted survival (mean of 8.7
v. 8.0 months;
P
= .004). Bene
fi
ts were greater for participants lacking prior computer experience. Most patients
receiving intervention (63%) reported severe symptoms during the study. Nurses frequently
ini-tiated clinical actions in response to e-mail alerts.
Conclusion
Clinical bene
fi
ts were associated with symptom self-reporting during cancer care.
J Clin Oncol 34:557-565. © 2015 by American Society of Clinical Oncology
INTRODUCTION
Symptoms are common among patients receiving
treatment of advanced cancers
1,2and often go
undetected.
3-6Systematic collection of symptom
information using patient-reported outcome
(PRO) standardized questionnaires has been
suggested as an approach to improve symptom
control.
7,8Several web-based systems exist
9,10and have been shown to prompt clinicians to
intensify symptom management,
11-13to improve
symptom control,
11,13-15and to enhance
patient-clinician communication, patient satisfaction,
and well-being.
16-22Most patients are willing
and able to self-report via the web, even close to
the end of life.
23worse survival in advanced cancer and lead to functional impairment
and deconditioning.
25Therefore, improved symptom control may
improve survival. To address these questions, we conducted a
single-center randomized controlled trial to test whether systematic
web-based collection of patient-reported symptoms during chemotherapy
treatment, with automated alerts to clinicians for severe or worsening
symptoms, improves health-related quality of life (HRQL) as well as
survival, quality-adjusted survival, ER use, and hospitalization.
METHODS
Trial Design and Participants
Patients initiating chemotherapy at Memorial Sloan Kettering Cancer
Center (MSK) in New York for metastatic breast, genitourinary,
gyne-cologic, or lung cancers were enrolled in a nonblinded, randomized,
controlled trial of web-based self-reporting of symptoms, compared with
usual care. The study protocol was approved by the MSK institutional
review board and registered on ClinicalTrials.gov (NCT00578006).
Patients were eligible if they planned to receive chemotherapy at MSK
and could read English. Patients were ineligible if they were participating in
an investigational treatment, because such studies stipulate structured
symptom reporting. The included tumor types were selected because they
represent a spectrum of symptoms related to cancer and treatment;
metastatic disease was speci
fi
ed because treatment is often continuous and
symptoms are common.
1All participants provided written informed
consent. Randomization was conducted by the institutional Biostatics
Service via a computer system using randomly permutated blocks.
Par-ticipants remained on study until discontinuation of cancer treatment,
voluntary withdrawal, or death.
Preplanned Subgroups
Before randomization, participants were assigned to one of two
subgroups based on level of prior computer and e-mail use. Those with
regular access to a computer and e-mail use at least weekly were assigned to
a computer-experienced subgroup; the remainder were assigned to a
computer-inexperienced subgroup. This approach was based on evidence
that patients with computer experience are more receptive to electronic
self-reporting than those with less computer experience.
26The patients in
each subgroup were independently allocated to self-reporting versus usual
care (1:1 in the computer-experienced subgroup and enriched at 2:1 in the
computer-inexperienced subgroup, to enable an assessment of the logistics
of obtaining PROs in this group as a part of a parallel feasibility study).
Intervention
Self-reporting was conducted via STAR (Symptom Tracking and
Reporting), a web-based interface previously established as easy to use for
patients with cancer with high symptom burdens.
20,27-29STAR includes
questions adapted for patient use from the National Cancer Institute
’
s
Common Terminology Criteria for Adverse Events,
26,27pertaining to 12
common symptoms experienced during chemotherapy
1,30: appetite loss,
constipation, cough, diarrhea, dyspnea, dysuria, fatigue, hot
fl
ashes,
nausea, pain, neuropathy, and vomiting. These symptoms are graded on a
fi
ve-point scale from 0 (not present) to 4 (disabling) based on clinical
criteria.
31STAR did not allow skipped questions or free-text responses.
At enrollment, nonclinical study staff trained participants to use
STAR and facilitated completion of a baseline self-report. At subsequent
medical oncology or infusion suite visits, study staff invited participants
to self-report either via wireless touchscreen tablet computers or
free-standing computer kiosks. Participants in the computer-inexperienced
subgroup were asked to self-report using STAR only at clinic visits.
Participants in the computer-experienced subgroup were given remote
access to STAR, with a weekly e-mail reminder encouraging but not
requiring a between-visit report.
STAR triggered e-mail alerts to nurses whenever a patient-reported
symptom worsened by
$
2 points or reached an absolute grade
$
3. The
system informed participants that e-mails are not generally monitored after
business hours, and participants were therefore encouraged to call the of
fi
ce
at such times for symptoms of concern. A report tracking participants
’
symptoms
20,23,26was printed at each clinic visit for both the nurse and
treating oncologist. No speci
fi
c guidance was provided to clinicians about
what actions to take in response to alerts or printed symptom pro
fi
les.
Usual Care
Usual care for both the experienced and
computer-inexperienced subgroups consisted of the standard procedure at MSK
for monitoring and documenting symptoms, which is typical of medical
oncology practice and was identical for both subgroups.
5,20Symptoms are
discussed and documented in the medical record during clinical
encounters between patients and their oncologists. Patients are encouraged
to initiate telephone contact between visits for concerning symptoms.
Outcome Measures
The primary outcome was change in HRQL at 6 months from
baseline, measured via the EuroQol EQ-5D Index.
32The EQ-5D Index is a
fi
ve-item questionnaire (measuring mobility, self-care, usual activities,
pain/discomfort, and anxiety/depression) that produces a composite score
between 0 and 1 (multiplied by 100 to yield a result between 0-100)
representing general health status, normalized for the US population.
33,34Lower scores represent worse HRQL. A score change of 6 points on the 0 to
100 scale is considered clinically meaningful in US cancer populations.
35The EQ-5D was administered via paper at clinic visits every 12
6
4 weeks
throughout study participation, with an understanding that in the routine
care setting, clinic visit intervals vary between patients.
Survival at 1 year was tabulated based on medical records and
Social Security Death Index data. Quality-adjusted survival was
eval-uated by multiplying EQ-5D scores by survival time for each patient.
36Time to
fi
rst ER visit and time to
fi
rst hospitalization at MSK were based
on admissions data in the medical record. Time receiving active cancer
treatment was abstracted from medical charts. The number of nursing
calls to patients was tabulated based on nursing logs in the medical
record.
Adherence with STAR self-reporting was assessed by calculating the
proportion of participants completing questionnaires at each successive
visit. For computer-inexperienced participants to be considered adherent
at a given visit, a self-report must have been completed at the time of that
visit. For computer-experienced participants to be adherent at a given visit,
a STAR report had to be completed remotely within 72 hours. Nurses used
a standardized form to record if and what clinical actions were taken in
response to e-mail alerts.
Statistical Analysis
The study was designed to accommodate combined and separate
analyses of the computer-experienced and computer-inexperienced
sub-groups. Based on prior work,
28it was projected that 30% to 40% of
participants would fall in the inexperienced category. The experienced
subgroup was randomized 1:1 and the inexperienced was randomized 2:1,
to facilitate focus on the feasibility of obtaining PROs in this group. The
study planned to enroll until 225 patients were allocated within the smaller
inexperienced subgroup (150 assigned to STAR and 75 to usual care). With
225 participants in the inexperienced subgroup, there was 80% power to
detect an effect size of 0.40 in mean EQ-5D index change from baseline
between arms using a
t
test with a two-sided
a
of 0.05.
unchanged, or worsened scores from baseline was compared using
Fisher
’
s exact test. This analysis was conducted both for any level of
change from baseline and for a 6-point change from baseline, which is
considered as clinically meaningful.
34Mean score changes from baseline
were compared using two group
t
tests. A multivariable linear regression
model, with change score as the dependent variable, adjusted for
covariates including age, sex, cancer type, race, and education level.
Multiple sensitivity imputation analyses were conducted including last
observation carried forward but including baseline observations for
patients with no postbaseline EQ-5D score, no observations carried
forward, minimum observation values carried forward, average
obser-vation values carried forward, and last obserobser-vation carried forward but
assigning an EQ-5D value of zero if death occurred before 6 months. For
each method, analyses were conducted separately for the whole group
and for the subgroups based on computer experience.
For ER and hospitalization endpoints, cumulative incidence
func-tions were calculated with death treated as a competing event.
37Competing
risk regression was used to model risk with and without adjustment for
baseline covariates.
Comparisons of the percentage of patients alive at 1 year were made
using logistic regression, adjusting for baseline covariates, because
com-plete survival data were available for all patients. For the quality-adjusted
survival analysis, participants
’
average EQ-5D scores were multiplied by
survival times for each EQ-5D reporting interval during the initial year of
enrollment; these values were summed to yield a total number of
quality-adjusted life months for that patient during that year.
35Participants with
missing baseline EQ-5D scores were excluded. Mean quality-adjusted life
months were compared between arms in each cohort, using two group
t
tests. A multivariable linear regression model was used to adjust for the
baseline covariates in
Table 1
.
Two-sided
P
values of less than .05 were considered to indicate
statistical signi
fi
cance.
RESULTS
Baseline Characteristics
Between September 14, 2007 and January 6, 2011, 1,007
subjects were identi
fi
ed as potentially eligible and approached to
participate. Of these, 154 were found to be ineligible, and 87
declined. The remaining 766 subjects were enrolled and randomly
assigned,
including
227
computer-inexperienced
and
539
computer-experienced participants (
Fig 1
). Mean time on study
was 7.4 months and median time was 3.7 months (range, 0.25 to
49), with a mean of 16 clinic visits per patient (range, 1 to 114).
Baseline characteristics were balanced between
randomi-zation arms in both the computer-experienced and -inexperienced
subgroups (
Table 1
). Computer-inexperienced participants
were signi
fi
cantly older, more often men, more often black,
and less educated than computer-experienced participants (all
P
,
.001).
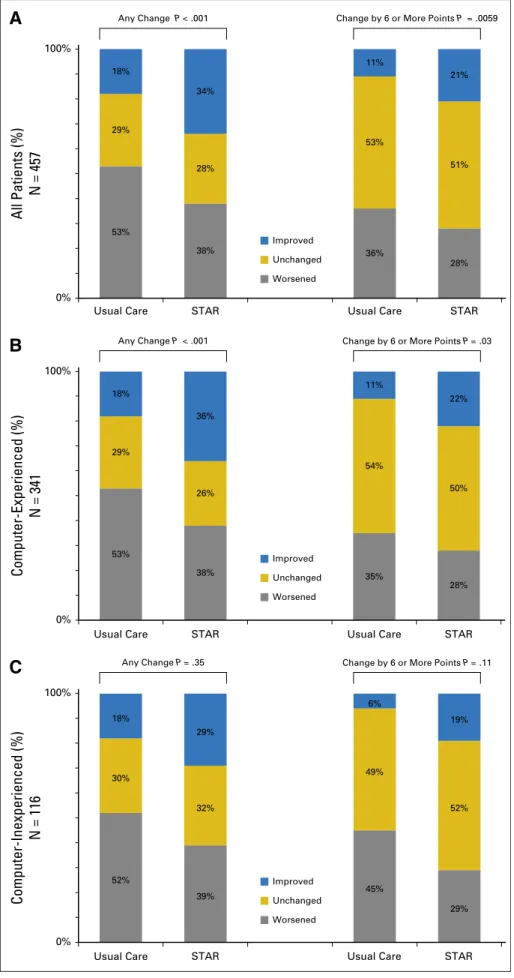
Quality of Life
HRQL scores improved by any amount from baseline to
6 months among more participants in the STAR arm than in the
usual care arm (34%
v
18%) and worsened among fewer (38%
v
53%;
P
,
.001;
Fig 2
; Data Supplement). Similarly, more
par-ticipants in the STAR arm experienced an improvement in
HRQL by the previously established clinically meaningful score
change threshold of
$
6 points
34compared with usual care (21%
v
11%), and fewer experienced a
$
6-point worsening (28%
v
Table 1.Baseline Characteristics of the Participants
Characteristic
All Patients (N = 766)
Computer-Experienced Subgroup (n = 539)
Computer-Inexperienced Subgroup (n = 227)*
STAR (n = 441)
Usual Care
(n = 325) STAR (n = 286)
Usual Care
(n = 253) STAR (n = 155)
Usual Care (n = 72)
Age, median (range), years 61 (30-91) 62 (26-88) 59 (30-85) 60 (26-88) 67 (38-91) 67 (44-86)
Female sex 257 (58) 187 (58) 184 (64) 152 (60) 73 (47) 35 (49)
Race
White 377 (86) 283 (87) 253 (89) 230 (91) 124 (80) 53 (74)
Black† 43 (10) 24 (7) 20 (7) 10 (4) 23 (15) 14 (19)
Asian 21 (5) 18 (6) 13 (5) 13 (5) 8 (5) 5 (7)
Cancer type
Genitourinary 143 (32) 102 (31) 78 (27) 77 (30) 65 (42) 25 (35)
Gynecologic 97 (22) 80 (25) 67 (23) 66 (26) 30 (19) 14 (19)
Breast 89 (20) 54 (17) 72 (25) 47 (19) 17 (11) 7 (10)
Lung 112 (25) 89 (27) 69 (24) 63 (25) 43 (28) 26 (36)
Education
High school or less 106 (24) 64 (20) 46 (16) 36 (14) 60 (39) 28 (39)
College 205 (47) 155 (48) 143 (50) 125 (49) 62 (40) 30 (42)
Graduate degree 130 (30) 106 (33) 97 (34) 92 (36) 33 (21) 14 (19)
HRQL‡
Mean 0.85 0.84 0.86 0.85 0.82 0.84
Range 0.27-1.0 0.20-1.00 0.33-1.00 0.22-1.00 0.27-1.00 0.20-1.00
Days since initiation of chemotherapy
Mean 46 40 44 41 51 39
Range 0-1,025 0-840 0-511 0-840 0-1,025 0-427
NOTE. Data presented as No. (%) unless otherwise noted. No significant differences between study arms were seen for any of the baseline characteristics in the study population overall or within either of the subgroups (allP..3).
Abbreviations: HRQL, health related quality of life; STAR, Symptom Tracking and Reporting web-based self-reporting system (study intervention). *Randomized 2:1 in this subgroup.
37%;
P
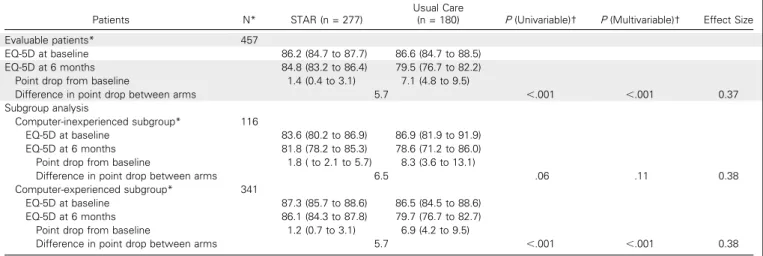
= .001). Mean HRQL scores declined by less in the intervention
arm compared with usual care (1.4-
v
7.1-point drop;
P
,
.001;
Table 2
). Although effect sizes were the same in the two subgroups
(0.38), results were statistically signi
fi
cant in the
computer-experienced subgroup (
P
,
.001) but did not reach statistical
signi
fi
cance in the relatively smaller computer-inexperienced
subgroup (
P
= .06). Notably, 230 patients (30% of participants)
died or discontinued cancer treatment before completing a
follow-up HRQL questionnaire. In a sensitivity analysis that included
these individuals by carrying forward their baseline HRQL values,
results were similar; results were also robust across multiple
additional sensitivity analyses (Data Supplement). In an analysis
of the EQ-5D
’
s subdomains, three were statistically signi
fi
cantly
better with STAR compared with usual care at 6 months
compared with baseline, including Mobility (
P
= .02), Self-Care
(
P
= .01), and Anxiety/Depression (
P
= .01), but did not reach
signi
fi
cance for Pain/Discomfort (
P
= .05) or Usual Activities
(
P
= .09).
Assigned to STAR (n = 286) Assigned to STAR
(n = 286)
Missing baseline QOL (n = 2) Missing baseline QOL
(n = 2)
Off study before 6 Months Died Off treatment Withdrew Off study before 6 Months Died Off treatment Withdrew
On study at 6 months missing QOL
(n = 21) On study at 6 months missing QOL
(n = 21)
Analyzed for quality of life 56 LOCF (n = 56)§ Analyzed for quality of life 56 LOCF (n = 56)§
Analyzed for quality-adjusted
survival (n = 284) Analyzed for quality-adjusted
survival (n = 284)
Analyzed for 1-year overall survival
(n = 286) Analyzed for 1-year
overall survival (n = 286)
Computer-experienced (n = 539) Computer-experienced
(n = 539)
Computer-inexperienced (n = 227) Computer-inexperienced
(n = 227)
Randomly assigned (n = 539) Randomly assigned
(n = 539)
Randomly assigned (n = 227)* Randomly assigned
(n = 227)*
Assigned to usual care (n = 253) Assigned to usual care
(n = 253)
Missing baseline QOL (n = 0) Missing baseline QOL
(n = 0)
Off study before 6 Months Died Off treatment Withdrew Off study before 6 Months Died Off treatment Withdrew
On study at 6 months missing QOL
(n = 17) On study at 6 months missing QOL
(n = 17)
Analyzed for quality of life 42 LOCF (n = 147)§ Analyzed for quality of life 42 LOCF (n = 147)§
Analyzed for quality-adjusted
survival (n = 253) Analyzed for quality-adjusted
survival (n = 253)
Analyzed for 1-year overall survival
(n = 253) Analyzed for 1-year
overall survival (n = 253)
Assigned to STAR (n = 155) Assigned to STAR
(n = 155)
Missing baseline QOL (n = 5) Missing baseline QOL
(n = 5)
Off study before 6 Months Died Off treatment Withdrew Off study before 6 Months Died Off treatment Withdrew
On study at 6 months missing QOL
(n = 21) On study at 6 months missing QOL
(n = 21)
Analyzed for quality of life 16 LOCF (n = 83)§ Analyzed for quality of life 16 LOCF (n = 83)§
Analyzed for quality-adjusted
survival (n = 150) Analyzed for quality-adjusted
survival (n = 150)
Analyzed for 1-year overall survival
(n = 155) Analyzed for 1-year
overall survival (n = 155)
Assigned to usual care (n = 72) Assigned to usual care
(n = 72)
Missing baseline QOL (n = 2) Missing baseline QOL
(n = 2)
Off study before 6 Months Died Off treatment Withdrew Off study before 6 Months Died Off treatment Withdrew (n = 69)†
(n = 5) (n = 59)‡ (n = 5) (n = 69)† (n = 5) (n = 59)‡ (n = 5)
(n = 89)† (n = 12) (n = 71)‡ (n = 6) (n = 89)† (n = 12) (n = 71)‡ (n = 6)
(n = 46)† (n = 5) (n = 31)‡ (n = 10) (n = 46)† (n = 5) (n = 31)‡ (n = 10)
(n = 26)† (n = 5) (n = 18)‡ (n = 3) (n = 26)† (n = 5) (n = 18)‡ (n = 3)
On study at 6 months missing QOL
(n = 11) On study at 6 months missing QOL
(n = 11)
Analyzed for quality of life
8 LOCF (n = 33)§ Analyzed for quality of life
8 LOCF (n = 33)§
Analyzed for quality-adjusted
survival (n = 70) Analyzed for quality-adjusted
survival (n = 70)
Analyzed for 1-year overall survival
(n = 72) Analyzed for 1-year
overall survival (n = 72) Assessed for eligibility
(N = 1,007) Assessed for eligibility
(N = 1,007)
Enrolled (n = 766) Enrolled (n = 766)
Excluded
Not meeting inclusion criteria Declined to participate Excluded
Not meeting inclusion criteria Declined to participate
(n = 241) (n = 154) (n = 87) (n = 241) (n = 154) (n = 87)
Fig 1.CONSORT diagram. *Computer-inexperienced patients were allocated 2:1, Symptom Tracking and Reporting web-based self-reporting system (STAR) to usual care.†Participants went off study before reporting postbaseline quality of life (QOL).‡Participants discontinued chemotherapy treatment before 6 months.§
Improved
Unchanged
Worsened 52%
39% 45%
29% 30%
32%
49%
52% 18%
29%
6%
19% Change by 6 or More Points P = .0059
28% Any Change P < .001
100%
0%
All Patients (%)
N = 457
100%
0%
Computer-Experienced (%)
N = 341
100%
0%
Computer-Inexperienced (%)
N = 116
Usual Care STAR Usual Care STAR
Usual Care STAR Usual Care STAR
Usual Care STAR Usual Care STAR
Improved
Unchanged
Worsened
Improved
Unchanged
Worsened
Change by 6 or More Points P = .03 Any Change P < .001
Change by 6 or More Points P = .11 Any Change P = .35
11%
21%
51% 53%
36% 18%
34%
28%
38% 29%
53%
11%
22%
50%
28% 54%
35% 18%
36%
26%
38% 29%
53%
A
B
C
ER Visits, Hospitalization, Cancer Treatment
Fewer participants in the STAR arm visited the ER compared
with usual care (34%
v
41% at 1 year;
P
= .02;
Fig 3
). These
differences appeared more pronounced in the
computer-inexperienced subgroup (34%
v
56%;
P
= .02) than in the
computer-experienced subgroup (34%
v
36%;
P
= .16). A similar
trend was seen in the proportion of patients hospitalized at 1 year
for the overall study population (45%
v
49%;
P
= .08), again more
pronounced and signi
fi
cant in the computer-inexperienced
sub-group (44%
v
63%;
P
= .003) but not in the computer-experienced
subgroup (46%
v
45%;
P
= .75; Data Supplement). Patients in the
STAR arm received active chemotherapy treatment for signi
fi
cantly
longer than usual care during the study, with a mean of 8.2 months
(range, 0 to 49 months) versus 6.3 months (range, 0 to 41 months),
respectively (
P
= .002), and a median of 4.1 months versus
3.5 months, respectively (
P
= .002).
Overall and Quality-Adjusted Survival
At 1 year, 69% of patients were alive in the usual-care arm
compared with 75% with STAR, a difference of 6% (
P
= .05;
Table 3
).
This difference was more pronounced among computer-inexperienced
participants (60% vs. 74%;
P
= .02), with a trend seen among
computer-experienced participants (71%
v
76%;
P
= .45).
Signi
fi
cant differences in quality-adjusted survival were observed
during this 1-year period for all patients (mean of 8.0
v
8.7 months;
P
= .004) and were statistically signi
fi
cant in both subgroups.
Symptom Reporting and Nurse Responses to E-mail
Alerts
On average, 73% of participants assigned to the intervention
arm completed a self-report at any given clinic visit (Data
Supplement). A total of 84,212 individual symptoms were
self-reported during the study. Among these, 1,431 or 1.7% were severe
or disabling (grade 3 or 4), reported by 277 of the 441 (63%)
intervention arm participants. The most common severe or
dis-abling patient-reported symptoms were fatigue, pain, anorexia,
dyspnea, neuropathy, and nausea. Nursing interventions taken in
direct response to e-mail alerts included telephone counseling
about symptom management (in response to 77% of alerts),
supportive medication initiation/change (12%), referral to the ER/
hospital (8%), chemotherapy dose modi
fi
cation (2%), and
imaging/test orders (2%). No difference in the number of nursing
calls to patients during participation was detected, with a mean of
12.8 in the STAR group vs. 12.9 in the control group (
P
= .93).
DISCUSSION
For adults receiving outpatient chemotherapy for advanced cancer
at a large specialty cancer center, web-based symptom reporting
with automated clinician e-mail alerts resulted in better HRQL,
fewer ER visits, fewer hospitalizations, a longer duration of
pal-liative chemotherapy, and superior quality-adjusted survival.
Although the vast majority of patient-reported symptoms
were grade 1 or 2 (mild to moderate), more than 1,400 were grade
3 or 4 (severe to disabling). In response to e-mail alerts for severe or
worsening symptoms, nurses performed direct interventions
primarily composed of telephone counseling, medication changes,
and ER or hospital referral. Clinical actions may also have been
taken in response to symptom reports delivered to clinicians at
each of
fi
ce visit including responses to mild/moderate symptoms,
although these were not systematically tracked and may be a useful
focus of future research.
Prior studies have explored mechanisms by which patient
reporting of symptoms may confer clinical bene
fi
ts, with
fi
ndings
including increased rates of symptom discussions between
patients and clinicians,
11,18,19intensi
fi
ed symptom management by
Table 2.Mean Quality-of-Life Changes From Baseline at 6 Months
Patients N* STAR (n = 277)
Usual Care
(n = 180) P(Univariable)† P(Multivariable)† Effect Size
Evaluable patients* 457
EQ-5D at baseline 86.2 (84.7 to 87.7) 86.6 (84.7 to 88.5)
EQ-5D at 6 months 84.8 (83.2 to 86.4) 79.5 (76.7 to 82.2)
Point drop from baseline 1.4 (0.4 to 3.1) 7.1 (4.8 to 9.5)
Difference in point drop between arms 5.7 ,.001 ,.001 0.37
Subgroup analysis
Computer-inexperienced subgroup* 116
EQ-5D at baseline 83.6 (80.2 to 86.9) 86.9 (81.9 to 91.9)
EQ-5D at 6 months 81.8 (78.2 to 85.3) 78.6 (71.2 to 86.0)
Point drop from baseline 1.8 ( to 2.1 to 5.7) 8.3 (3.6 to 13.1)
Difference in point drop between arms 6.5 .06 .11 0.38
Computer-experienced subgroup* 341
EQ-5D at baseline 87.3 (85.7 to 88.6) 86.5 (84.5 to 88.6)
EQ-5D at 6 months 86.1 (84.3 to 87.8) 79.7 (76.7 to 82.7)
Point drop from baseline 1.2 (0.7 to 3.1) 6.9 (4.2 to 9.5)
Difference in point drop between arms 5.7 ,.001 ,.001 0.38
NOTE. Data presented as mean (95% CI) unless otherwise noted.
Abbreviations: STAR, Symptom Tracking and Reporting web-based self-reporting system; EQ-5D, EuroQoL EQ-5D quality of life questionnaire.
*Patents without postbaseline EQ-5D scores were not included in the primary health-related quality of life analysis but were included in the sensitivity analysis with similar results.
clinicians in response to patient reports,
11-13and improved
symptom control when patient reports are shared with
clincians.
11-14,18As such, systematic patient reporting appears to
enhance clinician awareness and can augment existing mechanisms
for symptom management during routine oncology care.
Con-versely, when undetected in the absence of patient self-reporting,
symptoms may continue to worsen and cause serious
complica-tions, lead to hospital visits, limit the ability to safely deliver
chemotherapy, and diminish outcomes, as observed in this study.
This randomized trial should be interpreted in the context of
three key limitations. First, it was conducted at a single, urban
tertiary care cancer center limiting generalizability. However,
inclusion of a computer-inexperienced subgroup, with 39% having
no education beyond high school, suggests its applicability to
diverse US cancer populations. The study included only English
speakers; future assessments should include additional languages
and nontext interfaces, such as interactive voice response. ER and
hospital admissions regardless of primary site were tracked based
on the institution
’
s electronic medical record system. However,
some admissions to outside institutions may not have been
recorded.
Second, we chose to use the EQ-5D assessment of overall
HRQL rather than more granular questionnaires that evaluate
particular symptoms in detail. We selected this approach to avoid
con
fl
ating the intervention with the outcome metric and to enable
calculation of quality-adjusted survival. As a result, we have limited
information about which symptoms were best addressed by
symptom reporting. Despite the generic nature of the EQ-5D
measure, signi
fi
cant and clinically meaningful differences were
observed between study arms.
Third, substantial numbers of participants did not have
6-month HRQL data available because they had died or discontinued
treatment. The survival and utilization endpoints would not be
affected by these missing data, and HRQL results were similar in
multiple sensitivity analyses. Moreover, missing HRQL would be
more likely expected to attenuate detection of potential bene
fi
ts of
PRO reporting because of informative censoring of scores when
patients died or discontinued treatment earlier in the usual care
arm who otherwise might have reported low HRQL scores.
38Nonetheless, earlier or more frequent systematic outcomes data
collection is warranted for future assessments. The study design did
not anticipate the observed level of attrition in the accrual plan.
Some bene
fi
ts appeared greater for computer-inexperienced
patients, who were overall older, frailer, and more symptomatic
than computer-experienced patients. Participants lacking
com-puter experience may have less-developed health communication
skills and thereby bene
fi
t more from a structured program for
eliciting symptoms. Future work is warranted to discern which
patient populations may bene
fi
t most from this type of health
communication intervention.
A formal cost-utility analysis was not performed. Resource use
was relatively modest and included software development, server
space and maintenance, eight tablet computers, and time spent by
patients and clinicians to report and review symptoms and to
respond when they were severe or worsening. The software did not
provide recommendations to patients or clinicians about
man-agement of detected symptoms, which could be added in future
systems.
p =.02
p =.02
p =.16
Months Since Enrollment
Months Since Enrollment
Months Since Enrollment
20 40 60
0 6 12 18 24 30 36
0 6 12 18 24 30 36
6 12 18 24 30 36
Patients Visiting ER (%)
20 40 60
Patients Visiting ER (%)
20 40 60
0
Patients Visiting ER (%)
All Patients
Computer-Experienced
Computer-Inexperienced
Usual careSTAR
Usual care
STAR
Usual care
STAR
A
B
C
No. At Risk
Total 766 533 412 337 289 228 182 STAR 441 323 254 209 179 144 109 Usual Care 325 210 158 128 110 84 73
In the context of a changing health care delivery system where
both population management and patient centeredness are
pri-oritized, symptom self-reporting engages patients as active
par-ticipants and may improve the experience, ef
fi
ciency, and
outcomes of care. Given the favorable outcomes we have
dem-onstrated with a simple prototype, further work to re
fi
ne optimal
strategies for engaging both patients and clinicians in harnessing
technology to improve care should be a priority.
AUTHORS
’
DISCLOSURES OF POTENTIAL CONFLICTS
OF INTEREST
Disclosures provided by the authors are available with this article at
www.jco.org
.
AUTHOR CONTRIBUTIONS
Conception and design:
Ethan Basch, Deborah Schrag
Administrative support:
Lauren Rogak, Michael Fruscione
Provision of study materials or patients:
Ethan Basch, Mark G. Kris,
Howard I. Scher, Clifford A. Hudis, Paul Sabbatini
Collection and assembly of data:
Ethan Basch, Mark G. Kris, Howard I.
Scher, Clifford A. Hudis, Paul Sabbatini, Lauren Rogak, Antonia V.
Bennett, Dorothy Dulko, Laura Sit, Allison Barz, Michael Fruscione,
Deborah Schrag
Data analysis and interpretation:
Ethan Basch, Allison M. Deal, Lauren
Rogak, Antonia V. Bennett, Amylou Dueck, Thomas M. Atkinson, Joanne
F. Chou, Paul Novotny, Jeff A. Sloan, Deborah Schrag
Manuscript writing:
All authors
Final approval of manuscript:
All authors
REFERENCES
1. Reilly CM, Bruner DW, Mitchell SA, et al: A literature synthesis of symptom prevalence and severity in persons receiving active cancer treatment. Support Care Cancer 21:1525-1550, 2013
2. Henry DH, Viswanathan HN, Elkin EP, Traina S, Wade S, Cella D: Symptoms and treatment burden associated with cancer treatment: results from a cross-sectional national survey in the U.S. Support Care Cancer 2008;16:791-801
3. Fromme EK, Eilers KM, Mori M, et al: How accurate is clinician reporting of chemotherapy adverse effects? A comparison with patient-reported symptoms from the Quality-of-Life Questionnaire C30. J Clin Oncol 22:3485-3490, 2004
4. Laugsand EA, Sprangers MA, Bjordal K, et al: Health care providers underestimate symptom intensities of cancer patients: A multicenter Euro-pean study. Health Qual Life Outcomes 8:104, 2010
5. Atkinson TM, Li Y, Coffey CW, et al: Reliability of adverse symptom event reporting by clinicians. Qual Life Res 21:1159-1164, 2012
6. Fisch MJ, Lee JW, Weiss M, et al:
Pro-spective, observational study of pain and analgesic prescribing in medical oncology outpatients with breast, colorectal, lung, or prostate cancer. J Clin Oncol 30:1980-1988, 2012
7. Snyder CF, Aaronson NK, Choucair AK, et al: Implementing patient-reported outcomes assessment
in clinical practice: A review of the options and con-siderations. Qual Life Res 21:1305-1314, 2012
8. Fung CH, Hays RD: Prospects and challenges in using patient-reported outcomes in clinical prac-tice. Qual Life Res 17:1297-1302, 2008
9. Jensen RE, Snyder CF, Abernethy AP, et al: Review of electronic patient-reported outcomes systems used in cancer clinical care. J Oncol Pract 10:e215-e222, 2014
10. Bennett AV, Jensen RE, Basch E: Electronic patient-reported outcome systems in oncology clinical practice. CA Cancer J Clin 62:337-347, 2012
11. Seow H, Sussman J, Martelli-Reid L, et al: Do high symptom scores trigger clinical actions? An
audit after implementing electronic symptom
screening. J Oncol Pract 8:e142-e148, 2012
12. Santana MJ, Feeny D, Johnson JA, et al:
Assessing the use of health-related quality of life measures in the routine clinical care of lung-transplant patients. Qual Life Res 19:371-379, 2010
13. Kroenke K, Krebs EE, Wu J, et al: Telecare collaborative management of chronic pain in primary care: A randomized clinical trial. JAMA 312:240-248, 2014
14. Cleeland CS, Wang XS, Shi Q, et al: Auto-mated symptom alerts reduce postoperative symp-tom severity after cancer surgery: A randomized controlled clinical trial. J Clin Oncol 29:994-1000, 2011
15. Gilbert JE, Howell D, King S, et al: Quality improvement in cancer symptom assessment and
control: The Provincial Palliative Care Integration Project (PPCIP). J Pain Symptom Manage 43: 663-678, 2012
16. Valderas JM, Kotzeva A, Espallargues M, et al: The impact of measuring patient-reported outcomes in clinical practice: A systematic review of the liter-ature. Qual Life Res 17:179-193, 2008
17. Chen J, Ou L, Hollis SJ: A systematic review of the impact of routine collection of patient reported outcome measures on patients, providers and health organisations in an oncologic setting. BMC Health Serv Res 13:211, 2013
18. Kotronoulas G, Kearney N, Maguire R, et al: What is the value of the routine use of patient-reported outcome measures toward improvement of patient outcomes, processes of care, and health service outcomes in cancer care? A systematic review of controlled trials. J Clin Oncol 32:1480-1501, 2014
19. Detmar SB, Muller MJ, Schornagel JH, et al: Health-related quality-of-life assessments and
patient-physician communication: A randomized
controlled trial. JAMA 288:3027-3034, 2002
20. Basch E, Artz D, Dulko D, et al: Patient online self-reporting of toxicity symptoms during chemo-therapy. J Clin Oncol 23:3552-3561, 2005
21. Velikova G, Booth L, Smith AB, et al: Meas-uring quality of life in routine oncology practice improves communication and patient well-being: A randomized controlled trial. J Clin Oncol 22:714-724, 2004
Table 3.Overall and Quality-Adjusted Survival at 12 Months
Patients N STAR (95% CI) Usual Care (95% CI) P(Univariable)* P(Multivariable)*
Overall survival, % alive at 1 year
All patients 766 75.1 (70.7 to 79.0) 68.6 (63.2 to 73.6) .03 .05
Subgroup analysis, % alive at 1 year
Computer inexperienced 227 74.2 (66.6 to 80.9) 59.7 (47.5 to 71.1) .03 .02
Computer experienced 539 75.5 (70.1 to 80.4) 71.1 (65.1 to 76.7) .25 .45
Quality-adjusted 12-month survival, months
All patients 757† 8.7 (8.3 to 9.0 ) 8.0 (7.6 to 8.4 ) .002 .004
Subgroup analysis, months
Computer inexperienced 220† 8.3 (7.8 to 8.8 ) 7.2 (6.3 to 8.2 ) .03 .02
Computer experienced 537† 8.8 (8.5 to 9.2 ) 8.2 (7.7 to 8.6 ) .02 .046
Abbreviation: STAR, Symptom Tracking and Reporting web-based self-reporting system (study intervention).
*Pvalues for between-arm comparisons. Multivariable analyses controlled for age, sex, cancer type, race, and education level. For overall analyses, subgroup assignment (computer experienced or computer inexperienced) was also included as a covariate.
22. Berry DL, Blumenstein BA, Halpenny B, et al: Enhancing patient-provider communication with the electronic self-report assessment for cancer: A randomized trial. J Clin Oncol 29:1029-1035, 2011
23. Judson TJ, Bennett AV, Rogak LJ, et al: Feasibility of long-term patient self-reporting of tox-icities from home via the Internet during routine chemotherapy. J Clin Oncol 31:2580-2585, 2013
24. Mayer DK, Travers D, Wyss A, et al: Why do patients with cancer visit emergency departments? Results of a 2008 population study in North Carolina. J Clin Oncol 29:2683-2688, 2011
25. Trajkovic-Vidakovic M, de Graeff A, Voest EE, et al: Symptoms tell it all: A systematic review of the value of symptom assessment to predict survival in advanced cancer patients. Crit Rev Oncol Hematol 84:130-148, 2012
26. Basch EM, Thaler HT, Shi W, et al: Use of information resources by patients with cancer and their companions. Cancer 100:2476-2483, 2004
27. Basch E, Iasonos A, Barz A, et al: Long-term toxicity monitoring via electronic patient-reported
outcomes in patients receiving chemotherapy.
J Clin Oncol 25:5374-5380, 2007
28. Basch E, Jia X, Heller G, et al: Adverse symptom event reporting by patients vs clinicians: Relationships with clinical outcomes. J Natl Cancer Inst 101:1624-1632, 2009
29. Basch E, Artz D, Iasonos A, et al: Evaluation of an online platform for cancer patient self-reporting of chemotherapy toxicities. J Am Med Inform Assoc 14: 264-268, 2007
30. Basch E, Abernethy AP, Mullins CD, et al: Recommendations for incorporating patient-reported outcomes into clinical comparative effectiveness research in adult oncology. J Clin Oncol 30: 4249-4255, 2012
31. National Cancer Institute, National Institutes of Health, U.S. Department of Health and Human Services: Common Terminology Criteria for Adverse Events (CTCAE). http://evs.nci.nih.gov/ftp1/CTCAE/ CTCAE_4.03_2010-06-14_QuickReference_8.5x11.pdf 32. EuroQol Group: EuroQol–A new facility for the measurement of health-related quality of life. Health Policy 16:199-208, 1990
33. Agency for Healthcare Research and Quality. U.S. Valuation of the EuroQol EQ-5D Health States. January 2012.http://archive.ahrq.gov/professionals/ clinicians-providers/resources/rice/EQ5Dproj.html
34. Sullivan PW, Ghushchyan V: Mapping the EQ-5D index from the SF-12: US general population preferences in a nationally representative sample. Med Decis Making 26:401-409, 2006
35. Pickard AS, Neary MP, Cella D: Estimation of minimally important differences in EQ-5D utility and VAS scores in cancer. Health Qual Life Outcomes 5: 70, 2007
36. Zhao H, Tsiatis AA: A consistent estimator for the distribution of quality adjusted survival time. Biometrika 84:339-348, 1997
37. Gray RJ: A class of K-sample tests for com-paring the cumulative incidence of a competing risk. Ann Stat 16:1141-1154, 1988
38. Ratcliffe J, Young T, Longworth L, et al: An assessment of the impact of informative dropout and nonresponse in measuring health-related quality of life using the EuroQol (EQ-5D) descriptive system. Value Health 8:53-58, 2005
AUTHORS’DISCLOSURES OF POTENTIAL CONFLICTS OF INTEREST