Development of a Practical Model for Targeting Patient Decision
Support Interventions to Promote Colorectal Cancer Screening
in Vulnerable Populations
Alison Tytell Brenner, PhD,
University of Washington School of Public Health and Community Medicine, Department of Health Services, Seattle, WA, University of Washington Medical Center, Division of
Gastroenterology, Seattle, WA, Cecil G. Sheps for Health Services Research, University of North Carolina at Chapel Hill
Shivani Gupta, MD,
Emory University School of Medicine, Atlanta, GA
Linda K. Ko, PhD,
University of Washington School of Public Health and Community Medicine, Department of Health Services, Seattle, WA, Fred Hutchinson Cancer Research Center, Cancer Prevention Program, Seattle, WA
Nancy Janz, PhD, and
University of Michigan School of Public Health, Department of Health Behavior and Health Education, Ann Arbor, MI
John M. Inadomi, MD
University of Washington School of Public Health and Community Medicine, Department of Health Services, Seattle, WA, University of Washington Medical Center, Division of
Gastroenterology, Seattle, WA
Abstract
We sought to develop a practical model for predicting probability of colorectal cancer (CRC) screening completion in a diverse safety-net population and a subsequent framework for targeting screening promotion interventions. Data used to construct the models was prospectively collected from a CRC screening intervention. Models were cross-validated by randomly splitting the data into training and validation samples. The predicted probabilities of screening completion from the final model were trichotomized into framework groups and cross-validated by defining cut-points in the training sample, applying them to the validation sample, and comparing across samples for homogeneity. The final model included demographic and simple psychosocial measures and predicted screening behavior adequately (AUROC=0.63). The framework groups (cut-points 0.62
Alison Tytell Brenner is the corresponding author and can be reached at Cecil G. Sheps for Health Services Research, University of North, Carolina at Chapel Hill, 725 Martin Luther King Jr. Blvd, CB# 7590, Chapel Hill, NC 27599-7590, t. 919-966-2340, f. 919-966-1634, [email protected].
Financial disclosure: No financial disclosures were reported by the authors of this paper.
HHS Public Access
Author manuscript
J Health Care Poor Underserved
. Author manuscript; available in PMC 2017 July 20.Published in final edited form as:
J Health Care Poor Underserved. 2016 ; 27(2): 465–478. doi:10.1353/hpu.2016.0090.
A
uthor Man
uscr
ipt
A
uthor Man
uscr
ipt
A
uthor Man
uscr
ipt
A
uthor Man
uscr
(low), 0.74 (medium), and 1.0 (high)) were homogeneous across the two samples. The model and framework may be useful for designing and delivering targeted interventions to promote CRC screening. Future research should validate the framework groups.
Keywords
Cancer prevention; colorectal cancer; vulnerable populations; prediction
Colorectal cancer (CRC) is the third leading cause of cancer death in the United States. Screening for CRC screening is effective and the United States Preventive Services Task Force recommends regular screening for adults ages 50–75.1–5 However, completion of recommended screening remains suboptimal; only 65% of all adults are up to date with recommended screening practices.6 Among Asian and Hispanic Americans specifically, only 45% and 47%, respectively, are up to date with CRC screening.7,8
Patient decision support has been shown to increase completion of CRC screening, but implementation can be difficult and expensive.9–13 Additionally, without significant follow-up, uptake of patient decision support materials tends to be low, which can minimize the effect on screening rates.11–13 One possible reason for low uptake may be that patient decision support materials are not targeted at patients' information needs.14 However, identifying the information needs of a patient or a group of patients for targeting may be challenging.
One potential approach for identifying information needs is to measure patient activation.15,16 Patient activation is defined as a patient's willingness and ability to
participate in and make health care decisions.17 There is some evidence that patient decision support interventions targeted at patient activation level improve participation in preventive care more effectively than non-targeted interventions.17,18 Hibbard and colleagues
developed the Patient Activation Measure (PAM) to formally assess patient activation level.16 While the PAM has been validated and shown to be a useful tool for targeting interventions, it consists of 13– 22 items, depending on the version, and is therefore time-intensive to administer and complete. Using a time-time-intensive instrument such as the PAM to identify patients for targeted decision support may not be feasible in a busy clinic setting.19 It may, alternatively, be possible to identify information needs by identifying how likely a patient is to complete CRC screening using existing clinical data and a few simple patient-reported items.
The goals of this project were twofold: first, to develop a simple, practical model to predict the individual probability of completing screening using as few items as possible, while still maintaining reasonable predictive accuracy; second, using the results of this model, to develop a three-level framework for use in designing and delivering patient decision support interventions targeted at the information needs of patients at low, medium, and high
probability of completing CRC screening in a multi-ethnic, low-income population. Presented in this paper is the development of the model and the subsequent intervention design framework.
A
uthor Man
uscr
ipt
A
uthor Man
uscr
ipt
A
uthor Man
uscr
ipt
A
uthor Man
uscr
Methods
Study design
The data used in this analysis come from the CRC Adherence Study, which was a cluster-randomized trial. Participants were cluster-randomized to one of three study arms in which their primary care provider offered fecal occult blood test (FOBT) only, colonoscopy only, or a choice of either test. The purpose of the study was to estimate the effect of choice on CRC screening decision-making and behavior; thus, barriers inherent to the public hospital system were reduced or eliminated to the extent possible. A detailed description of the participants' recruitment has been reported in the literature.20 Participants were followed-up for CRC screening completion for 12 months after study enrollment. This analysis, conducted in 2013, used data collected at baseline and follow-up. The study was approved by the University of Washington Institutional Review Board.
Study participants
Tree clinics in the San Francisco Community Health Network (CHN) participated in the study. The CHN is the primary safety net within which the majority of people with low-income or inadequate or no insurance receive medical care; within the CHN, FOBT and colonoscopy are available to all city residents regardless of their insurance status. Eligible participants were patients at one of these clinics, aged 50– 79 years, at average risk for CRC, and not up-to-date with recommended screening. Participants were enrolled in the study between 2007-2008. Eight hundred and six (81%) of 997 study participants had complete data and were included in this analysis. Excluded participants were more likely to be male (54% vs. 45%) and less likely to be adherent (52% vs. 68%). Among the included participants, adherence to any CRC screening test did not differ across the study arms.
Part 1: Developing the model
Dependent variable—The outcome of interest was completion of any CRC screening test at 12 months. Fecal occult blood testing was complete when the FOBT kit was returned to the study office and, for positive tests, a follow-up colonoscopy was completed.
Colonoscopy was complete if it was documented as completed in the medical record. Research staff called study participants to verify non-completion; self-report of out-of-system screening was recorded as completion. The dependent variable was modeled using logistic regression.
Candidate variables—Prior to beginning construction of the prediction model, a pool of candidate variables was selected. These variables were either well represented in the literature as being associated with screening behavior or were among psychosocial characteristics that measured the Health Belief Model constructs or patient trust in primary care provider or trust in the medical profession in general.16,21–23 Prior to constructing the prediction models, the candidate variables were characterized according to the difficulty of collecting them: 1) Existing data: information likely to be in a patient medical record; 2) Simple measures: information not typically in a medical record, but conceptually simple to collect (e.g., primary language); or 3) Psychosocial measures: items measuring constructs of the Health Belief Model (HBM) and patient trust, which are more difficult to collect. Health
A
uthor Man
uscr
ipt
A
uthor Man
uscr
ipt
A
uthor Man
uscr
ipt
A
uthor Man
uscr
Belief Model constructs were measured using items previously developed by Janz and colleagues.16,24–26 Patient trust was assessed using two subscales of the Wake Forest Trust Scale: trust in primary care provider, which measures the level of trust a patient has for his or her personal doctor, and trust in doctors in general, which measures the level of trust a patient has in medical care providers as a group.27
Independent variables were all collected using facilitated surveys at baseline with the exception of patient trust, which was added to the baseline survey in 2008. Participants who enrolled prior to this time completed the trust items at a follow-up visit. A prior analysis revealed no meaningful differences in trust based on time of assessment.23 All candidate variables are described in detail in the appendix.
Variable selection and model construction—Variable selection was based on our previous research, a recent review of the literature, and an existing systematic review.28,29 Because of the purpose of the framework to result from the model (delivering patient education), the risks associated with misclassification (i.e., classifying someone as likely to complete screening when they are actually unlikely) are minimal. Therefore, the goal was to build a simple and practical model that could be feasibly used in a busy clinic setting to inform a targeting framework. Variables were selected iteratively in order to achieve a balance between parsimony, in terms of number and complexity of variables, and accuracy, in terms of ability to predict CRC screening behavior. Model variables were chosen based first on difficulty of collection (existing data, simple measures, psychosocial measures, described above) and second on evidence in the literature for association with CRC
screening behavior. Instead of relying on individual variable significance, which can result in over-fitting and poor prognostic performance in new data, whole models were built and assessed to find the final model. Ultimately, 15 models were assessed using different combinations of the candidate variables.
Model assessment—Cross-validation was used to test the performance of each of the 15 potential models using randomly subsampled training and validation datasets. Each model was built in the “training” sample and assessed in the “validation” sample. The area under the receiver operator curve (AUROC), or c-statistic, was calculated to assess predictive performance, and the Hosmer-Lemeshow (H-L) statistic for goodness of fit to assess calibration.30
In this report, three of the 15 potential models are presented for comparison, from which the final model was selected. The three models included in this report were selected to represent varying levels of model complexity. To fulfill the goal of a simple and practical model, the balance of model performance with number and complexity of the variables necessary to power the model was considered. The selected final model was the one that best balanced simplicity and practicality with performance.
Part 2: The intervention design framework
Generating the framework groups—Following the selection of the final model, a three-level intervention design framework was developed to indicate high, medium, or low probability of completing screening based on the individual probabilities of completing
A
uthor Man
uscr
ipt
A
uthor Man
uscr
ipt
A
uthor Man
uscr
ipt
A
uthor Man
uscr
screening.9,27,28 First, the individual probabilities of completing CRC screening were predicted from the final model in the whole study sample. Next, cut-points were defined in the previously defined training dataset by trichotomizing (equally dividing into three groups) the predicted probabilities of completing CRC screening, dividing the individuals included in the training dataset into three equally sized groups. These groups were the three levels of readiness to complete screening (Figure 1).
Evaluating the framework groups—To evaluate the framework, the cut points defined in the training dataset were applied to the validation dataset. The distribution of screening completion and socio-demographic and psychosocial variables were compared across the three groups in the two datasets, and to similar groups described in the literature.9,27 The cut points were revised iteratively to increase homogeneity of the comparative groups and similarity to the characteristics described in the literature (Figure 1).
Results
Study population
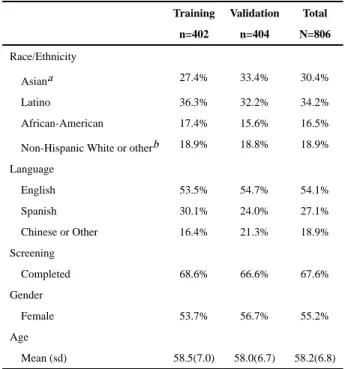
Eight hundred and six participants were included in this analysis. The mean age of participants was 58, and most were female (55%), self-reported as either Asian (33%) or Hispanic (32%), and spoke English (55%). About 68% completed screening within 12 months of study enrollment. For this analysis, participants who had no missing data and had completed the patient trust survey, added later in the study, were included. The randomly selected cross-validation samples were 402 in the training sample and 404 in the validation sample (Table 1). There were no differences in demographic characteristics across the subsamples. Because of the large number of outcomes, the sample size should be large enough to allow for construction of a valid model.29
Part 1: Developing the model
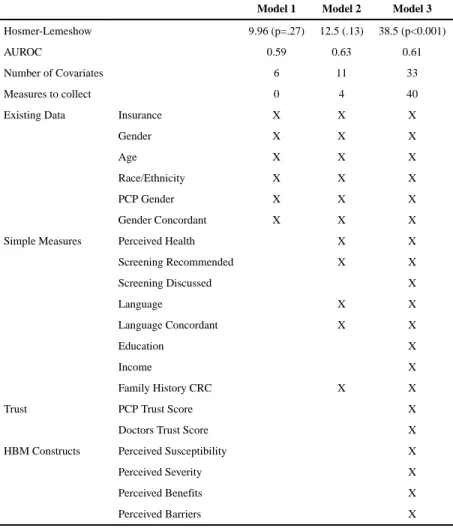
Three different models were constructed and tested using different numbers of covariates. All model performance statistics are in Table 2 and model covariates, coefficients, and standard errors are in Appendix Table 2.
Model 1: Existing data model—This model used covariates categorized as existing data. Included in the model were insurance status, patient gender, age, race/ethnicity, primary care provider (PCP) gender, and patient-PCP gender concordance. This model had an AUROC of 0.59 and was well calibrated (Hosmer-Lemeshow p=0.27). The sensitivity and specificity were 94.6% and 10.2%.
Model 2: Existing data and simple measures model—For the next model, several variables were added to Model 1. Self-reported health status, family history of CRC, language, PCP-patient language concordance, and past PCP recommendation of CRC screening were added to those included in Model 1. This model would require that four simple measures be collected: health status, family history of CRC, primary language, and PCP recommendation of screening. This model had an AUROC of 0.63, and was well calibrated (H-L p=0.13). The sensitivity and specificity were 91.0% and 17.3%.
A
uthor Man
uscr
ipt
A
uthor Man
uscr
ipt
A
uthor Man
uscr
ipt
A
uthor Man
uscr
Model 3: All covariates model—In this model, all candidate variables were included, adding to the previous models some additional simple measures, the two patient trust scores, and scores for constructs of the Health Belief Model. This model would require the
collection of the 40 items, including seven items to collect the simple measures, 10 to measure trust, and 23 to measure the Health Belief Model constructs. This model had an AUROC of 0.61, but was not well calibrated (H-L p<.001). The sensitivity and specificity were 88.9% and 21.9%.
Other models—Several other models not reported here were considered. These models included variables summarizing the Health Belief Model and patient trust in doctors in general. They had either poor performance, poor calibration, or required too many complex measures to be useful in a practical scenario.
Model selection: Model 2—The model that best balanced simplicity with accuracy was Model 2. While Model 1 does not require any data collection, the predictive ability of the model was determined to be too low to be useful. Model 3 did not improve on Model 2's predictive ability and required the collection of a larger number of more complex psychosocial measures (Table 2).
Part 2: The intervention design framework
The individual predicted probabilities in the training and validation samples had similar distributions. The means were similar (0.66 training; 0.68 validation) and both were left-skewed. Trichotomizing the training sample resulted in three equal groups of 134 individuals of low, medium, and high screening probability. Cut points in the predicted probabilities of screening completion were 0.62 (low), 0.74 (medium), and 1.0 (high). These cut points were then applied to the validation sample. Upon comparison of the distribution of screening completion rates and socio-demographic characteristics in the low, medium, and high screening probability groups in training and validation samples, few differences were found. In the validation sample, the low screening probability group had slightly more males (32% vs. 24%, p=.05) (Table 3 , Figure 2, Appendix 3).
Discussion
In this paper, three predictive models were developed and compared, a final model was selected, and the results of that final model were used to construct a useful framework for designing interventions to promote CRC screening. The three models had different levels of complexity, and the goal was to select the model that best balanced simplicity with accuracy. The selected final model contained mostly information that is likely to be in a patient medical record, supplemented by a few simple measures. The model's AUROC was 0.63, and it had adequate ability to discriminate between those who would become screened and those who would not.
Our previous research has shown that individuals' psychosocial characteristics, particularly trust in primary care provider, are predictive of CRC screening behavior.25 However, in the current study, these complex psychosocial characteristics did not improve the predictive capability of the model enough to justify the difficulty of the data collection. This result is
A
uthor Man
uscr
ipt
A
uthor Man
uscr
ipt
A
uthor Man
uscr
ipt
A
uthor Man
uscr
consistent with recent findings reported by Jerant, who found that an intervention targeted at psychosocial characteristics was no more effective than a generic intervention at promoting CRC screening completion.31 Their targeted intervention did, however, improve knowledge and self-efficacy, among other measures, which many argue are important to a high quality decision-making process.32,33 The simple psychosocial measures included in the final model in this report may be enough to achieve some of the benefit in terms of decision-making quality without undo data collection burden. The selected final model requires the collection of only four simple measures, fulfilling the goal of simplicity. Additionally, it has an adequate predictive ability, fulfilling the goal of reasonable predictive accuracy. We present this model as a possible equivalent but simpler alternative measurement of patient activation to the PAM, in the context of CRC screening intervention.
The Adherence Study data provides a unique platform to identify individual level characteristics that predict CRC screening in the absence of system-level barriers, which were largely removed as part of the study.20 Patients who were screened during the study period likely represent: 1) patients who would complete CRC screening, regardless of the presence or absence of system-level barriers, and 2) patients who want to complete CRC screening, but might not in the presence of system-level barriers. Previous research that has assessed why some people do not complete CRC screening has found system level barriers to be important.34,35 This may suggest that many more patients are interested in completing screening than actually do. The framework that was developed can be used to categorize individuals into low, medium, and high probability of going on to complete screening in the future for the purpose of targeting interventions to the information needs of these groups. Because screening behavior was assessed in the near absence of system level barriers likely increases the usefulness of the final model and subsequent framework. Notably, however, the proposed cut point for the low group was higher than those observed in other studies,9 and was numerically close to the cut point for the medium group. Because of the near absence of system level barriers, this may be an appropriate representation of patients who would be of low and medium likelihood to complete CRC screening in the presence of the existing health system.
The framework is designed to be both a model for the design of a targeted intervention and a mechanism for the delivery of such interventions. There has been extensive research considering effective and efficient methods of CRC screening promotion. Many studies have found that highly intensive interventions, usually including counseling of patients, have the greatest impact on increasing preventive health behaviors.12,13,36 Other studies, however, have shown that, while some populations require intensive interventions, others respond well to more modest interventions.10,11 Intensive interventions are often effective, but expensive and unsustainable. (Tu, Lewis PIP1) Patients who are unlikely, in their current mindset, to complete screening in the near future may not be receptive to intensive interventions. Patients who are highly likely to complete screening probably do not need an intensive intervention to convince them to complete CRC screening. Patients in the middle, however, may benefit the most from an intensive intervention. Interventions designed around the framework could combine more and less intensive interventions into one multi-staged intervention to provide the appropriate intervention intensity to patients based on how likely
A
uthor Man
uscr
ipt
A
uthor Man
uscr
ipt
A
uthor Man
uscr
ipt
A
uthor Man
uscr
it is that they will complete screening. The prediction model could then be used to identify which intervention each participant would receive.
This analysis has some limitations. First, this is a secondary analysis of data, and the data were not collected for the purpose of building a prediction model. Second, the original study had multiple arms and subjects in each of the arms may be different. However, the training and validation samples were randomly selected, which should equally distribute any differences. Third, the trust measures were not collected from all participants at baseline, and some difference could be possible based on time of collection. However, a previous analysis did not find differences, and, more importantly, the final model did not use these measures. Fourth, the racial/ethnic and socioeconomic composition of the study sample is more diverse than the national population, and the model and subsequent framework may not be useful in other populations. This is also a major strength of the study, as this population has significant CRC screening disparities and remains understudied. Fifth, because the methods used for variable selection were data driven, this analysis does not answer the question about whether certain demographic groups may be more or less likely to complete screening. However, the composition of the framework groups is reflective of some of the associative conclusions of the original study.20 Finally, screening behavior in this population was in response to an intervention and may differ from screening behavior in a usual care setting. However, it is likely a good representation of those who want to complete screening and would, subsequently, be responsive to an intervention.
Promoting CRC screening among vulnerable populations is an important public health initiative; however, these populations can be difficult to reach. The proposed model and subsequent framework described in the paper may be useful for designing and delivering targeted interventions to promote CRC screening in similar populations. Future evaluation is necessary to validate the framework groups. The use of these groups in a targeted
intervention should, additionally, be evaluated against the established, but lengthier, PAM instrument, and should be tested in different populations.
Acknowledgments
The parent study (Colon Cancer Screening Adherence Study) from which the data were extracted was funded by grant R01CA106773 from the National Cancer Institute at the National Institutes of Health, grant K24DK080941 from the National Institutes of Diabetes and Digestive and Kidney Diseases at the National Institutes of Health, and grant UL1 RR024131 from the National Center for Research Resources at the National Institutes of Health. Dr. Brenner was supported by an AHRQ NRSA Training Grant [previous: 5T32 HS 13853-9 (University of Washington School of Public Health, Department of Health Services)
References
1. American Cancer Society. Colon/rectum cancer detailed guide. Atlanta, GA: American Cancer Society; 2013. Available at: http://www.cancer.org/acs/groups/cid/documents/webcontent/003096-pdf.pdf
2. Hardcastle JD, Chamberlain JO, Robinson MH, et al. Randomised controlled trial of faecal-occult-blood screening for colorectal cancer. Lancet. 1996 Nov 30; 348(9040):1472–7. http://dx.doi.org/ 10.1016/S0140-6736(96)03386-7. [PubMed: 8942775]
3. Kronborg O, Fenger C, Olsen J, et al. Randomised study of screening for colorectal cancer with faecal-occult-blood test. 1996 Nov 30; 348(9040):1467–71.
A
uthor Man
uscr
ipt
A
uthor Man
uscr
ipt
A
uthor Man
uscr
ipt
A
uthor Man
uscr
4. Mandel JS, Church TR, Bond JH, et al. The effect of fecal occult-blood screening on the incidence of colorectal cancer. N Engl J Med. 2000 Nov; 343(22):1603–7. http://dx.doi.org/10.1056/ NEJM200011303432203. [PubMed: 11096167]
5. U.S. Preventive Services Task Force. Screening for colorectal cancer: U.S. Preventive Services Task Force recommendation statement. Ann Intern Med. 2008 Nov 4; 149(9):627–37. Epub 2008 Oct 6. http://dx.doi.org/10.7326/0003-4819-149-9-200811040-00243. [PubMed: 18838716]
6. MMWR. Vital Signs: Colorectal Cancer Screening, Incidence, and Mortality—United States, 2002– 2010. MMWR Morb Mortal Wkly Rep. 2011 Jul 8; 60(26):884–9. [PubMed: 21734636]
7. American Cancer Society. Cancer prevention & early detection facts & figures. Atlanta, GA: American Cancer Society; 2013. Available at: http://www.cancer.org/acs/groups/content/ @epidemiologysurveilance/documents/document/acspc-037535.pdf
8. American Cancer Society. Cancer facts and figures for Hispanics/Latinos: 2012–2014. Atlanta, GA: American Cancer Society; 2012.
9. Harewood G. Videotape-based decision aid for colon cancer screening. Ann Int Med. 2001 Oct 16; 135(8 Pt 1):634–5. http://dx.doi.org/10.7326/0003-4819-135-8_Part_1-200110160-00016. [PubMed: 11601937]
10. Lewis CL, Brenner AT, Griffith JM, et al. Two controlled trials to determine the effectiveness of a mailed intervention to increase colon cancer screening. N C Med J. 2012 Mar-Apr;73(2):93–8. [PubMed: 22860316]
11. Lewis CL, Brenner AT, Griffith JM, et al. The uptake and effect of a mailed multi-modal colon cancer screening intervention: a pilot controlled trial. Implement Sci. 2008 Jun.3:32–32. http:// dx.doi.org/10.1186/1748-5908-3-32. [PubMed: 18518990]
12. Miller KM, Brenner A, Griffith JM, et al. Promoting decision aid use in primary care using a staff member for delivery. Patient Educ Couns. 2012 Feb; 86(2):189–94. Epub 2011 Jun 15. http:// dx.doi.org/10.1016/j.pec.2011.04.033. [PubMed: 21680131]
13. Tu SP, Taylor V, Yasui Y, et al. Promoting culturally appropriate colorectal cancer screening through a health educator: a randomized controlled trial. Cancer. 2006 Sep 1; 107(5):959–66. http://dx.doi.org/10.1002/cncr.22091. [PubMed: 16865681]
14. Rimer BK, Kreuter MW. Advancing tailored health communication: a persuasion and message effects perspective. J Commun. 2006 Aug 4; 56(s1):S184–201. http://dx.doi.org/10.1111/j. 1460-2466.2006.00289.x.
15. Snell JL, Buck EL. Increasing cancer screening: a meta-analysis. Prev Med. 1996 Nov-Dec;25(6): 702–7. http://dx.doi.org/10.1006/pmed.1996.0109. [PubMed: 8936572]
16. Hibbard JH, Greene J. What the evidence shows about patient activation: better health outcomes and care experiences; fewer data on costs. Health Aff (Millwood). 2013 Feb; 32(2):207–14. http:// dx.doi.org/10.1377/hlthaf.2012.1061. [PubMed: 23381511]
17. Stone EG, Morton SC, Hulscher ME, et al. Interventions that increase use of adult immunication and cancer screening services: a meta-analysis. Ann Int Med. 2002 May 7.136:641–51. http:// dx.doi.org/10.7326/0003-4819-136-9-200205070-00006. [PubMed: 11992299]
18. Klabunde CN, Lanier D, Breslau ES, et al. Improving colorectal cancer screening in primary care practice: innovative strategies and future directions. J Gen Intern Med. 2007 Aug; 22(8):1195–205. Epub 2007 May 30. http://dx.doi.org/10.1007/s11606-007-0231-3. [PubMed: 17534688]
19. Lustria, MLa, Cortese, J., Noar, SM., et al. Computer-tailored health interventions delivered over the Web: review and analysis of key components. Patient Educ Couns. 2009 Feb; 74(2):156–73. Epub 2008 Oct 22. http://dx.doi.org/10.1016/j.pec.2008.08.023. [PubMed: 18947966]
20. Inadomi JM, Vijan S, Janz NK, et al. Adherence to colorectal cancer screening: a randomized clinical trial of competing strategies. Arch Intern Med. 2012 Apr 9; 172(7):575–82. http:// dx.doi.org/10.1001/archinternmed.2012.332. [PubMed: 22493463]
21. Hibbard JH, Stockard J, Mahoney ER, et al. Development of the Patient Activation Measure (PAM): conceptualizing and measuring activation in patients and consumers. Health Serv Res. 2004 Aug; 39(4 Pt 1):1005–26. http://dx.doi.org/10.1111/j.1475-6773.2004.00269.x. [PubMed: 15230939]
A
uthor Man
uscr
ipt
A
uthor Man
uscr
ipt
A
uthor Man
uscr
ipt
A
uthor Man
uscr
22. Shively MJ, Gardetto NJ, Kodiath MF, et al. Effect of patient activation on self-management in patients with heart failure. J Cardiovasc Nurs. 2013 Jan-Feb;28(1):20–34. http://dx.doi.org/ 10.1097/JCN.0b013e318239f9f9. [PubMed: 22343209]
23. Gupta, S., Brenner, AT., Ratanawongsa, N., et al. Patient-physician trust and colorectal cancer screening adherence in a minority population. Am J Prev Med. 2014. [In Press] http://dx.doi.org/ 10.1016/j.amepre.2014.04.020
24. Hibbard JH, Greene J, Tusler M. Improving the outcomes of disease management by tailoring care to the patient's level of activation. Am J Manag Care. 2009 Jun; 15(6):353–60. [PubMed: 19514801]
25. Janz NK, Lakhani I, Vijan S, et al. Determinants of colorectal cancer screening use, attempts, and non-use. Prev Med. 2007 May; 44(5):452–8. Epub 2006 Dec 28. http://dx.doi.org/10.1016/ j.ypmed.2006.04.004. [PubMed: 17196247]
26. Janz NK, Wren Pa, Schottenfeld D, et al. Colorectal cancer screening attitudes and behavior: a population-based study. Prev Med. 2003 Dec; 37(6 Pt 1):627–34. http://dx.doi.org/10.1016/ j.ypmed.2003.09.016. [PubMed: 14636796]
27. Dugan E, Trachtenberg F, Hall MA. Development of abbreviated measures to assess patient trust in a physician, a health insurer, and the medical profession. BMC Health Serv Res. 2005 Oct 3.5:64– 64. http://dx.doi.org/10.1186/1472-6963-5-64. [PubMed: 16202125]
28. Holden D, Harris R, Porterfeld DS, et al. Enhancing the use and quality of colorectal cancer screening. Evid Rep Technol Assess (Full Rep). 2010 Feb.(190):1–195. v.
29. Holden D, Jonas DE, Porterfeld DSDS, et al. Systematic Review: Enhancing Use and Quality of Colorectal Cancer Screening. Ann Int Med. 2010 May 18; 152(10):668–76. Epub 2010 Apr 13. http://dx.doi.org/10.7326/0003-4819-152-10-201005180-00239. [PubMed: 20388703] 30. Bouwmeester W, Zuithoff NPa, Mallett S, et al. Reporting and methods in clinical prediction
research: a systematic review. PLoS Medicine. 2012; 9(5):1–12. Epub 2012 May 22. http:// dx.doi.org/10.1371/journal.pmed.1001221.
31. Jerant A, Kravitz RL, Sohler N, et al. Sociopsychological tailoring to address colorectal cancer screening disparities: a randomized controlled trial. Ann Fam Med. 2014 May-Jun;12(3):204–14. http://dx.doi.org/10.1370/afm.1623. [PubMed: 24821891]
32. Braddock CH 3rd, Edwards KA, Hasenberg NM, et al. Informed decision making in outpatient practice: time to get back to basics. Jama. 1999 Dec 22–29; 282(24):2313–20. http://dx.doi.org/ 10.1001/jama.282.24.2313. [PubMed: 10612318]
33. Elwyn G, O'Connor A, Stacey D, et al. Developing a quality criteria framework for patient decision aids: online international Delphi consensus process. BMJ. 2006 Aug 26.333(7565):417. Epub 2006 Aug 14. http://dx.doi.org/10.1136/bmj.38926.629329.AE. [PubMed: 16908462]
34. Rawl SM, Menon U, Champion VL, et al. Do benefits and barriers differ by stage of adoption for colorectal cancer screening? Health Educ Res. 2005 Apr; 20(2):137–48. Epub 2004 Aug 16. http:// dx.doi.org/10.1093/her/cyg110. [PubMed: 15314036]
35. James AS, Campbell MK, Hudson MA. Perceived barriers and benefits to colon cancer screening among African Americans in North Carolina: how does perception relate to screening behavior? Cancer Epidemiol Biomarkers and Prev. 2002 Jun; 11(6):529–34.
36. Baker DW, Brown T, Buchanan DR, et al. Comparative Effectiveness of a Multifaceted
Intervention to Improve Adherence to Annual Colorectal Cancer Screening in Community Health Centers. JAMA Intern Med. 2014 Aug; 174(8):1235–41. http://dx.doi.org/10.1001/jamainternmed. 2014.2352. [PubMed: 24934845]
A
uthor Man
uscr
ipt
A
uthor Man
uscr
ipt
A
uthor Man
uscr
ipt
A
uthor Man
uscr
Figure 1.
Model and framework construction.
A
uthor Man
uscr
ipt
A
uthor Man
uscr
ipt
A
uthor Man
uscr
ipt
A
uthor Man
uscr
Figure 2.
Intervention Targeting Framework.
A
uthor Man
uscr
ipt
A
uthor Man
uscr
ipt
A
uthor Man
uscr
ipt
A
uthor Man
uscr
A
uthor Man
uscr
ipt
A
uthor Man
uscr
ipt
A
uthor Man
uscr
ipt
A
uthor Man
uscr
ipt
Table 1 Demographic Characteristics of the Sample
Training Validation Total n=402 n=404 N=806
Race/Ethnicity
Asiana 27.4% 33.4% 30.4% Latino 36.3% 32.2% 34.2% African-American 17.4% 15.6% 16.5% Non-Hispanic White or otherb 18.9% 18.8% 18.9% Language
English 53.5% 54.7% 54.1% Spanish 30.1% 24.0% 27.1% Chinese or Other 16.4% 21.3% 18.9% Screening
Completed 68.6% 66.6% 67.6% Gender
Female 53.7% 56.7% 55.2% Age
Mean (sd) 58.5(7.0) 58.0(6.7) 58.2(6.8) a
Predominantly Chinese b
Predominantly Caucasian
A
uthor Man
uscr
ipt
A
uthor Man
uscr
ipt
A
uthor Man
uscr
ipt
A
uthor Man
uscr
ipt
Table 2 Model Performance Statistics
Model 1 Model 2 Model 3
Hosmer-Lemeshow 9.96 (p=.27) 12.5 (.13) 38.5 (p<0.001) AUROC 0.59 0.63 0.61 Number of Covariates 6 11 33 Measures to collect 0 4 40 Existing Data Insurance X X X Gender X X X
Age X X X
Race/Ethnicity X X X PCP Gender X X X Gender Concordant X X X Simple Measures Perceived Health X X Screening Recommended X X Screening Discussed X Language X X Language Concordant X X Education X
Income X
A
uthor Man
uscr
ipt
A
uthor Man
uscr
ipt
A
uthor Man
uscr
ipt
A
uthor Man
uscr
ipt
T ab le 3 Inter vention Design Framew
ork Gr
oups
Lo
w Cut point: 62.1%
Medium Cut point: 73.3%
High Cut point: 100.0%
T raining V alidation T raining V alidation T raining V alidation Race/Ethnicity Asian* 5.97% 5.41% 20.9% 25.4% 55.2% 59.8% Latino 32.8% 38.7% 51.5% 42.5% 24.6% 18.9% African-American 38.8% 33.3% 9.0% 9.7% 4.5% 8.2%
Non-Hispanic White or other**
22.4% 22.5% 18.7% 22.4% 15.7% 13.2% Language English 79.1% 77.5% 47.8% 57.5% 33.6% 36.5% Spanish 20.9% 21.6% 47.8% 36.6% 21.6% 15.1%
Chinese or Other