ADAPTIVE IMMUNITY AND THE TUMOR IMMUNE MICROENVIRONMENT
Christof C. Smith
A dissertation submitted to the faculty at the University of North Carolina at Chapel Hill in partial fulfillment of the requirements for the degree of Doctorate of Philosophy in the
Department of Microbiology & Immunology in the UNC School of Medicine
Chapel Hill 2019
iii ABSTRACT
Christof C. Smith: Role of the adaptive immune system in the tumor immune microenvironment
(Under the direction of Jonathan S. Serody)
iv
v
TABLE OF CONTENTS
LIST OF FIGURES ...ix
LIST OF TABLES ...xi
CHAPTER 1: General introduction to tumor immunology... 1
1.1 Introduction to the immune system ... 1
1.2 The tumor immune microenvironment ... 2
1.3 Development of immunotherapies for cancer treatment ... 4
1.4 Molecular characterization of the tumor ... 6
1.5 Classical and non-classical tumor-specific antigens ... 8
1.6 Human endogenous retroviral derived cancer antigens ... 12
1.7 Computational prediction of tumor-specific antigens ... 15
1.8 Clinical translation of non-classical tumor-specific antigens ... 18
1.9 Therapeutic platforms for tumor antigen vaccination ... 22
1.10 Concluding remarks and contributions of this work ... 24
CHAPTER 2: Design and study of subtype-specific murine tumor models ... 26
2.1 Development of subtype specific mouse models of bladder cancer. ... 26
2.1.1 Introduction ... 26
vi
2.1.3 Results ... 37
2.1.4 Discussion ... 58
2.2 Immuno-PET imaging of tumor-infiltrating lymphocytes using Zirconium-89 radiolabeled anti-CD3 antibody in immune-competent mice bearing syngeneic tumors. ... 63
2.2.1 Introduction ... 63
2.2.2 Results ... 66
2.2.3 Discussion ... 79
2.2.4 Materials and methods ... 82
CHAPTER 3: Role of human endogenous retroviruses in the tumor immune microenvironment ... 88
3.1 Introduction ... 88
3.2 Results ... 90
3.3 Discussion ... 111
3.4 Methods ... 120
CHAPTER 4: Design and delivering of neoantigen-based therapeutic vaccines ... 126
4.1 Machine learning model for prediction of neoantigen immunogenicity ... 126
4.1.1 Introduction ... 126
4.1.2 Results and Discussion ... 128
4.1.3 Materials and methods ... 143
4.2 Neoantigen-delivering nanoparticles for therapeutic tumor vaccines ... 144
4.2.1 Introduction ... 144
4.2.2 Results and Discussion ... 146
vii
CHAPTER 5: Future Directions and Conclusion ... 154 APPENDIX 1: RNA-seq Analysis of the Tumor Microenvironment ... 160 APPENDIX 2: The Cancer Genome Atlas comprehensive molecular
viii
LIST OF FIGURES
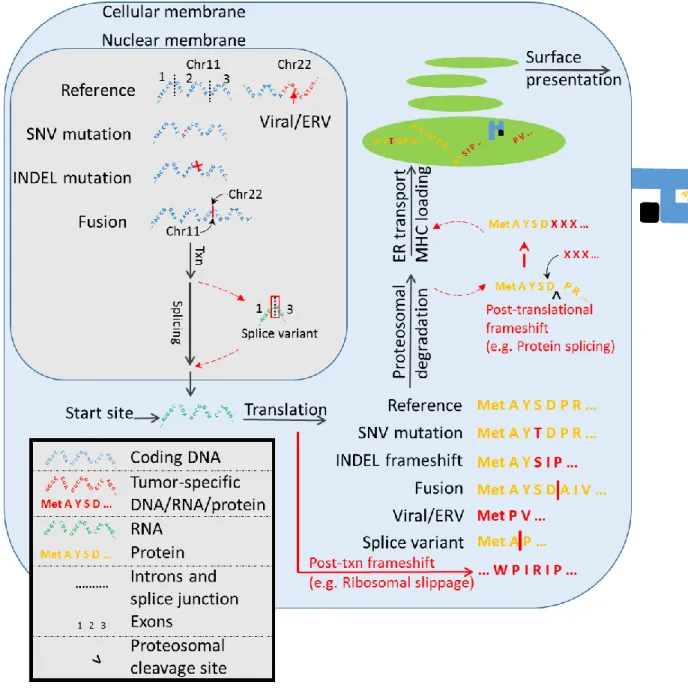
Figure 1.1: Summary of tumor-specific antigen production in the
tumor cell. ... 10
Figure 1.2: Summary of tumor-specific antigens ... 17
Figure 1.3: Average tumor specific antigen counts by cancer type. ... 21
Figure 1.4: Number of unique tumor specific antigens by cancer type. ... 22
Figure 2.1: Inactivation of Pten and Trp53 in Upk3a-expressing cells results in high-grade muscle-invasive bladder tumors... 39
Figure 2.2: Representative histology of UPPL tumors. ... 41
Figure 2.3: BBN and UPPL tumors recapitulate the human basal and luminal molecular subtypes of bladder cancer. ... 43
Figure 2.4: Immune characterization of UPPL1541 and BBN963 subtype-specific bladder models. ... 48
Figure 2.5: Anti–PD-1 treatment of BBN963 and UPPL1541 cell line–derived tumors. ... 52
Figure 2.6: Description and immune characterization of BBN963 mixed-response phenotype. ... 54
Figure 2.7: Neoantigen prediction and validation in BBN963, UPPL1541, and MB49. ... 57
Figure 2.8. Scatter dot plots from the ex-vivo biodistribution study of 89Zr-DFO-anti-CD3, 89Zr-DFO-IgG2b, and 89Zr-DFO-IgG in untreated C57BL/6J mice. ... 68
Figure 2.9. Micro-PET/CT images of 89Zr-DFO-anti-CD3 in C57BL/6J mice 72h post-injection (coronal view). ... 70
Figure 2.10: Scatter plots from the ex-vivo biodistribution study of 89Zr-DFO-anti-CD3 in C57BL/6J mice bearing BBN975 tumors. ... 72
Figure 2.11: Effects of DFO-anti-CD3 and unconjugated anti-CD3 treatment on total lymphocyte numbers and viability in the spleen of C57BL/6J mice. ... 74
ix
Figure 2.13: Representative gating (left) and immunological effects (right) of DFO-anti-CD3 on CD4+ T-cell phenotype distribution. ... 78 Figure 3.1: Human endogenous retrovirus expression and association in TCGA pan-cancer dataset. ... 92 Figure 3.2: Mechanism of hERV-mediated RIG-I–like pathway signaling in ccRCC. ... 97 Figure 3.3: hERVs associated with expression of BCR clonotypes are negatively prognostic in ccRCC. ... 100 Figure 3.4: Immune-related hERV signatures are prognostic for patient overall survival. ... 103 Figure 3.5: hERVs demonstrate evidence of targetable epitope expression in ccRCC. ... 106 Figure 3.6: hERV 4700 epitope–derived HLA-A*02:01 tetramers identify the presence of gag- and pol-specific T cells in ccRCC. ... 110 Figure 4.1: Summary of tumor antigen prediction and identification of peptide-intrinsic features. ... 129 Figure 4.2: Linear regression analysis between peptide-intrinsic features and tumor antigen immunogenicity. ... 131 Figure 4.3: Performance and validation of gradient boosting model
approach for predicting neoantigen/mHA immunogenicity. ... 136 Figure 4.4: Luciferase imaging of luc-P815 tumor burden in DBA/2
recipients. ... 139 Figure 4.5: Correlative analysis of predicted neoantigen immunogenicity in TCGA human dataset. ... 141 Figure 4.6: IFN-γ ELISpot in a co-culture assay of neoantigen-experiences T cells and B16F10 tumor cell. ... 147 Figure 4.7: Tumor growth curves for B16F10 bearing mice treated with neoantigen delivering nanoparticles or free neoantigenic peptide. ... 149 Figure 4.8: Experimental timeline for ndNP treatment study. ... 149 Figure 4.9: Heatmap of Luminex cytokine z-scores measured in day 10
x
LIST OF TABLES
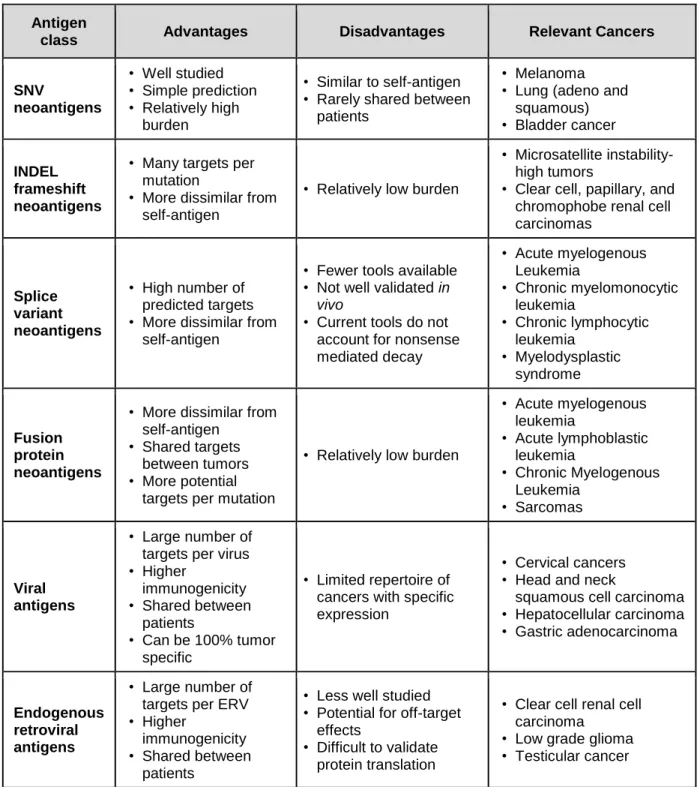
Table 1.1: Advantages and disadvantages of targeting tumor specific antigen classes, and relevant cancers. ... 11 Table 1.2: Tools for prediction of non-classical tumor-specific
antigens. ... 16 Table 2.1. Results from the ex-vivo biodistribution of 89Zr-DFO-anti-CD3, 89Zr-DFO-IgG2b, and 89Zr-DFO-IgG in C57BL/6J mice (n = 6 per group). ... 69 Table 2.2. Results from the ex-vivo biodistribution studies of 89Zr-DFO-anti-CD3 and 89Zr-DFO-IgG2b in C57BL/6J mice
1
CHAPTER 1: General introduction to tumor immunology 1.1 Introduction to the immune system
The immune system is the body’s host defense composed of barrier structures (e.g. skin, mucosal barrier), cells (leukocytes), and soluble factors (e.g. cytokines, chemokines, complement proteins, immunoglobulins) which work in a concerted effort to recognize and respond to foreign entities. Classically, immunity is divided into the innate and adaptive arms of the immune system. The former is an evolutionarily older defense system whose major functions include recruitment of immune cells through release of cytokines and chemokines, activation of the compliment cascade, removal of foreign targets or debris through phagocytosis, and activation of the adaptive immune system through antigen presentation. While an innate immune response can react rapidly against a broad set of targets, there is low target specificity with little evidence currently of immunological memory. In contrast, the adaptive immune system is
composed of T and B lymphocytes (including B-cell generated antibodies) that develop in response to specific immunological antigens. Development of a primary adaptive immune response takes 7-10 days in humans and mice, with formation of
2
immunity to promote anti-cancer immunological responses, which has laid the foundation for development of cancer immunotherapies within the past century.
1.2 The tumor immune microenvironment
The interaction between cancer and the immune system is dictated by the ability of the immune system to recognize non-self-antigens that arise during tumorigenesis. Recognition of tumor antigens and inflammatory signals can promote infiltration of immune cells, including sentinel antigen presenting cells (APC; e.g. dendritic cells [DC], macrophages/monocytes), neutrophils, natural killer [NK] cells, and T/B lymphocytes). In addition to infiltration, anti-tumor immune responses also necessitate an inflamed state, allowing for lymphocytes to carry out effector function. This combination of infiltration and inflammation has led to classification of tumors into several states: 1) Infiltrated-excluded “cold” tumors (characterized by exclusion of lymphocytes from the tumor core), 2) Infiltrated-inflamed “hot” tumors (characterized by infiltration of the tumor core by lymphocytes, with high expression of programmed cell death protein 1 [PD-1] and its corresponding ligands [PD-L1/PD-L2]), and 3) infiltrated tumors with inclusion of tertiary lymphoid structures (characterized by formation of lymphoid structures within the tumor secondary to enhanced inflammation, often associated with positive prognosis)1.
T cells are widely recognized as the most important immune cell population for performing anti-tumor immunity, including direct anti-tumor cytotoxicity in the case of CD8+ T cells and generation of pro-inflammatory cytokines and chemokines in the case
of CD4+ T cells. The T-cell receptor (TCR) is typically comprised of variable alpha and
3
unique variable region (comprised of a recombinant V [variable], D [diversity], and J [joining] region), while alpha chains undergo VJ recombination without an intervening D region. Pairing of recombined alpha and beta chains allows for specificity of binding to a particular antigen bound to a major histocompatibility complex (MHC) complex. Subsequently to formation of the TCR, thymic deletion occurs to TCRs incapable of binding to any antigen/MHC (positive selection) as well as those which bind too strongly to self-antigens (negative selection). T cell recognition of tumor antigens occurs
through TCR engagement with tumor-specific antigenic peptides presented on MHC, either on the surface of antigen presenting cells during T cell activation or directly on the tumor cell during T cell effector function. CD8+ T cells bind to class I MHC, while CD4+
bind to class II MHC, with CD8 and CD4 acting as TCR co-receptors that enhance binding affinity of the TCR to the MHC.
4
type I interferon [IFN], IL-12 for activation of CD8+ T cells), which are necessary for
continued survival, proliferation, and memory-formation of Signal 1/2 activated T cells. Subsequently to activation, T cells upregulate checkpoint molecules which can act as a “break” to downregulate effector function. The expression of the checkpoint molecules on tumor infiltrating T lymphocytes is a major indicator for inflammatory status. Perhaps the best characterized and biologically important of these markers is PD-1, a surface receptor expressed on multiple immune populations whose function is most clearly elucidated in T cells, where upregulation occurs secondary to T-cell
receptor (TCR) signaling. Subsequent binding of PD-1 to its ligands PD-L1 and PD-L2 results in downregulation of T cell effector function. This occurs through the PD-1 intracellular immunoreceptor tyrosine-based inhibitory motif (ITIM), which recruits binding of SHP-2 to suppress TCR signaling through the ZAP-70 domain. Within the tumor microenvironment, where PD-L1/L2 are frequently expressed by both tumor and immune cells, PD-1 expression on T lymphocytes is associated with an exhausted immune phenotype, whereby memory and effector T cells which have recognized tumor antigens have decreased functions characterized by decreased proliferation, decreased inflammatory cytokine and IL-2 production, increased apoptosis, and upregulation of other exhaustion markers such as LAG-3, CD244, and CD1602. As such, therapeutic
antibodies that act to prevent PD-1/PD-L1 interactions have become an essential aspect of cancer immunotherapy.
1.3 Development of immunotherapies for cancer treatment
5
“break” for T cell function, competing against the binding of T cell protein CD28 (a co-stimulatory receptor for T cell activation) to its ligands CD80/86 (expressed on activated APCs). As such, CTLA-4 is not frequently used as a marker for T cell exhaustion but can be similarly targeted as PD-1 to prevent immune checkpoint regulation. PD-1 and CTLA-4 were first characterized in the early 1990’s, primarily by Drs. James Allison and Tasuku Honjo, respectively. Since initial studies demonstrating the effects of these two checkpoint molecules, therapeutics aimed to block their pathways (known as checkpoint inhibitor therapies) have been developed for cancer immunotherapies. Currently, anti-PD-1 (aanti-PD-1) and/or anti-PD-L1 therapies are standard of care for a wide variety of cancer types, including melanoma, urothelial cancer, non-small cell lung cancer, renal cell carcinoma, Hodgkin lymphoma, gastric cancer, colorectal cancer, hepatocellular carcinoma, Merkel cell carcinoma, and all cancers with high microsatellite instability (MSI)3. aPD-1 therapy has revolutionized our ability to treat these cancers, providing
cure with long lasting immunological memory against tumor in a subset of patients that would have otherwise had incurable disease with conventional therapies. Despite these advances, responders to aPD-1 therapy comprise a minority of all treated patients in most tumor types. As such, a key goal in the field of immuno-oncology has been to elucidate factors which associate with checkpoint inhibitor response.
6
Subsequently, other cancers have been shown to contain similar molecular subtypes, including bladder cancer, which contains basal and luminal subtypes as the two major classifications5–7. However unlike breast cancer, a limited repertoire of in vivo tumor models exist in bladder cancer, with no molecular subtype specific models described until recently. Lack of animal models has encumbered capacity to study the differential effects of immunotherapies in subtype specific bladder cancers, making the
development of biologically faithful murine models of bladder cancer a vital goal. In Chapter 2, we will discuss our efforts in the design of molecular subtype-specific models of basal and luminal bladder cancer, with elucidation of tumor response/nonresponse in a basal-like bladder cancer model that demonstrates a mixed response phenotype to aPD-1 therapy (Chapter 2.1). We additionally describe the use of these subtype-specific models in the design of novel immuno-based PET/CT imaging modalities to study in vivo T cell infiltration (Chapter 2.2).
1.4 Molecular characterization of the tumor
In an attempt to identify the mechanism behind patient
responsiveness/nonresponsiveness to aPD-1 therapy, many investigators have applied next generation sequencing immunogenomic techniques (e.g. DNA/RNA-sequencing) to elucidate the molecular profiles associated with various patient outcomes. Below is a summary of several landmark papers which have applied immunogenomic techniques to examine biomarkers for aPD-1 response:
Hugo et al. 20168: Identification of an innately resistant tumor signature to PD-1
7
mesenchymal transition, cell adhesion, extracellular matrix remodeling, angiogenesis, and wound healing.
Riaz et al. 20179: Study of whole exome, whole transcriptome, and TCR repertoire
sequencing in aPD-1 +/- anti-CTLA-4 treated melanoma patients. In responders to therapy, neoantigen load was reduced relative to pre-treatment baseline, with evidence of clonal T cell expansion post-treatment. Responders also demonstrated higher gene levels corresponding to CD8+ T cells and NK cells, with significant decreases in macrophage signatures.
Auslander et al. 201810: Study of melanoma and neuroblastoma patient sample
derived RNA-seq data to build an immuno-predictive score (IMPRES) based upon pairwise ratios of immune checkpoint related genes. This study outperformed several previous papers, including the Hugo et al. IPRES signature.
Smith et al. 201811 and Panda et al. 201812: We have identified that the expression
of several specific human endogenous retroviruses in pre-treatment nephrectomy samples from clear cell renal cell carcinoma patients is associated with subsequent responsiveness to aPD-1 therapy. These studies are covered in Chapter 3 and Appendix IV, respectively.
From these above studies, it is clear that the use of immunogenomic techniques to probe the tumor immune microenvironment can provide molecular signatures
8
(memory T cells, B cells, M1 polarized macrophages, activated DCs), 2) exclusion of immunosuppressive populations (regulatory T cells [Tregs], myeloid derived suppresser
cells [MDSC], M2 polarized macrophages), 3) evidence of TCR clonal expansion, and 4) presence and presentation of targetable tumor antigens. This set of features underscores the importance of generating T cell responses against tumor-specific antigens (TSA) in order for patients to generate robust tumor immunity. With evidence that responsiveness to aPD-1 therapy is largely dependent upon T cell activation against TSAs, it has become widely hypothesized that vaccine therapies against TSAs could be an effective strategy to generate or boost existing anti-tumor immunity.
1.5 Classical and non-classical tumor-specific antigens
9
Despite advantages of SNV-neoantigens, their applicability as vaccine targets may be limited to cancers with high mutational burden. While metastatic melanoma (which contains the highest SNV burden of any cancer) has been the primary focus of current neoantigen clinical studies, other cancers with lower mutation rates may contain a limited repertoire of potential targets. As such, SNV-neoantigen vaccine development may be hindered in these cancers.
In response, many investigators including our group have begun to evaluate non-classical TSAs – here defined as high-specificity tumor antigens arising from non-SNV genomic sources. Genomic analysis of tumor-antigen burden has demonstrated expression of various classes of TSAs are not always co-correlated, suggesting non-classical TSAs may be targetable in certain cancers despite low SNV-neoantigen burden. This is exemplified by clear cell renal cell carcinoma (ccRCC), a checkpoint inhibitor sensitive cancer which contains a low SNV burden but high expression of frameshift-neoantigens16 and tumor-specific endogenous retroviral antigens11.
Additionally, leukemia and sarcoma (which contain among the lowest SNV burden of any cancers) express shared gene fusion mutations and splice variant transcripts, both of which can produce neoantigens. Among non-classical TSAs include those generated from 1) mutational frameshifts, 2) splice variants, 3) gene fusions, 4) viral antigens, 5) endogenous retroviral antigens, and other less well characterized classes such as HLA-somatic mutation derived antigens, minor histocompatibility mismatch antigens, and retrotransposons (Figure 1.1, Table 1.1).
10
11
Table 1.1: Advantages and disadvantages of targeting tumor specific antigen classes, and relevant cancers.
Antigen
class Advantages Disadvantages Relevant Cancers
SNV
neoantigens
• Well studied • Simple prediction • Relatively high
burden
• Similar to self-antigen • Rarely shared between
patients
• Melanoma • Lung (adeno and
squamous) • Bladder cancer
INDEL frameshift neoantigens
• Many targets per mutation
• More dissimilar from self-antigen
• Relatively low burden
• Microsatellite instability-high tumors
• Clear cell, papillary, and chromophobe renal cell carcinomas
Splice variant neoantigens
• High number of predicted targets • More dissimilar from
self-antigen
• Fewer tools available • Not well validated in
vivo
• Current tools do not account for nonsense mediated decay
• Acute myelogenous Leukemia
• Chronic myelomonocytic leukemia
• Chronic lymphocytic leukemia
• Myelodysplastic syndrome
Fusion protein neoantigens
• More dissimilar from self-antigen
• Shared targets between tumors • More potential
targets per mutation
• Relatively low burden
• Acute myelogenous leukemia
• Acute lymphoblastic leukemia
• Chronic Myelogenous Leukemia
• Sarcomas
Viral antigens
• Large number of targets per virus • Higher
immunogenicity • Shared between
patients
• Can be 100% tumor specific
• Limited repertoire of cancers with specific expression
• Cervical cancers • Head and neck
squamous cell carcinoma • Hepatocellular carcinoma • Gastric adenocarcinoma
Endogenous retroviral antigens
• Large number of targets per ERV • Higher
immunogenicity • Shared between
patients
• Less well studied • Potential for off-target
effects
• Difficult to validate protein translation
• Clear cell renal cell carcinoma
12
1.6 Human endogenous retroviral derived cancer antigens
Among the classes of non-classical TSAs listed above, a major focus of the work presented here addresses the role of human endogenous retroviruses (hERVs) in modulation of the tumor immune microenvironment (Chapter 3). hERVs are remnants of exogenous retroviruses which incorporated into the genome throughout evolution17.
hERVs impact pathogenesis and progression of cancers, including melanomas, lymphoma, leukemia, ovarian, prostate, urothelial, and renal carcinomas18–27. Expression of tumor-specific/enriched hERVS partly arise through epigenetic dysregulation of the cancer genome, resulting in expression of hERV-containing genomic regions otherwise not observed under physiological conditions28,29. These
tumor-specific/enriched hERVs can impact both the innate and adaptive immune system through distinct mechanisms. In the innate immune system, hERVs signal through innate sensors, most commonly the RIG-I-like pathway recognition of viral double stranded RNAs28,29. This results in downstream NF-κb-mediated inflammation,
with release of type I IFN which causes immune activation and increased tumor class I MHC expression. Additionally, hERV-derived protein antigens can induce B- and T-cell activation30–32. As such, it is speculated that tumor-specific hERV antigens could be applied for anti-tumor adoptive cellular therapies and therapeutic vaccines.
hERV-derived therapies are particularly relevant for several cancer types. In addition to INDEL-derived neoantigens, hERVs have been proposed as key driver of anti-tumor immunity in ccRCC11,12. In ccRCC, hERV expression is strongly prognostic
13
evidence suggests a potential role for hERVs in the modulation of low grade glioma (LGG) where SNV burden is among the lowest of any cancer11 and testicular cancer
(particularly those with KIT mutations) where global DNA hypomethylation is associated with high hERV expression33.
Several computational methods for hERV quantification currently exist, with the majority providing quantification of hERV-like or retrotransposon-like elements (partial or full-length) rather than full-length, intact hERVs at specific genomic coordinates. The most well-known tool is RepeatMasker, designed to identify interspersed repeats and low complexity sequences of any class, including simple and tandem repeats,
segmental duplications, and interspersed repeats (including hERV-like elements, long and short interspersed nuclear elements [LINE/SINE], long terminal repeats [LTR], and other classes)34. RepeatMasker used in its default state is not optimal for detection of
hERVs. However, nearly all hERV-specific databases (e.g. HERVd35, HESAS36,
EnHERV37) have been subsequently generated using RepeatMasker. A more recently
quantifier designed by our group aimed specifically for analysis of hERVs from RNA-seq data is hervQuant11, which quantifies full-length, intact hERV proviral sequences. The
hervQuant reference is derived from Vargiu et al. which compiled genomic coordinates for 3,173 full-length hERV proviruses38. As these above methods are quantifiers of
hERV/hERV-like element expression, they must be paired with downstream epitope prediction software (e.g. NetMHCpan39) for hERV-antigen prediction.
14
genomic look into the interaction between hERVs and the tumor-immune
microenvironment, demonstrating three of 66 hERVs (ERVH-5, ERVH48-1, ERVE-4) identified in a previous study from Mayer et al.40 to have tumor specific expression and
to correlate with expression of a cytotoxicity signature (GZMA and PRF1) in several cancers41. Based on this study, as well as several other translational studies showing
the presence of a hERV-specific T-cell response in ccRCC31,42, we (Smith et al.11) and
Panda et al.12 performed comprehensive analyses into the role of hERVs in ccRCC.
hervQuant analysis of TCGA pan-cancer dataset provided broad correlative descriptions for the role of hERVs upon patient outcome and immune features, demonstrating hERV expression to most strongly associate with patient clinical
outcomes in ccRCC and LGG11. Both studies demonstrated the association between
hERV expression in pre-treatment ccRCC nephrectomy samples with subsequent response to anti-PD-1 checkpoint blockade therapy, providing evidence for hERVs as a biomarker for immunotherapy response and potentially as a direct immunological tumor-specific target.
With substantial evidence in favor of a hERV-directed tumor-specific immune response, several studies have described the translational application of tumor-specific hERV targets. A 2016 study from Cherkasova et al. identified a CD8+ T cell (CTL) clone
from a patient with regressing ccRCC and found the clone to have tumor-specific cytotoxicity against tumor cells in vitro31. The CTL recognized an antigen from a
15
particular CTL clone is being studied in clinical trials for adoptive T-cell therapy in
metastatic ccRCC (NCT03354390). Our analysis additionally identified a second hERV (hERV 4700) with preferential expression in ccRCC compared to normal tissues,
evidence of translation, and presence of tumor infiltrating CTLs specific for gag and pol
derived antigens of the virus11. Notably, this provided the first description of a broad
genomic screening method for tumor-specific hERV antigens.
1.7 Computational prediction of tumor-specific antigens
Recent advancements in DNA and RNA sequencing have allowed for
development of genomic and computational methods of TSA prediction (Table 1.2). Methods for generating TSA therapies generally rely on a conserved set of steps: 1) Variant calling, 2) HLA-typing, 3) peptide enumeration, 4) HLA binding prediction, and 5) therapy generation (Figure 1.2). Variant calling is the identification of genomic regions with high tumor specificity. In the case of SNV, INDEL, and gene fusions neoantigens, variants are derived from mutations within the tumor exome. Alternatively, viral and endogenous retroviral (ERV) antigens are derived from RNA expression data, selected for viruses/ERVs with higher expression in the tumor compared to matched normal tissues. Splice variant neoantigens can be identified through a variety of techniques, discussed later in detail. Subsequently, tumor HLA type is derived using an HLA caller (e.g. POLYSOLVER43, OptiType44, PHLAT45, HLAScan46, HLAProfiler47), which relies
on DNA and/or RNA sequencing data, depending upon the software. Peptide
16
prediction software (e.g. NetMHCpan39), with binding typically accepted in the literature
as ≤ 500 nM15,48,49. Lastly, predicted TSAs are used to generate a therapeutic product,
either as a vaccine (i.e. DNA/RNA, peptide, or dendritic cell vaccine) or a cellular therapy product (i.e. adoptive T cell therapy). Below, we will discuss the relevant biology for each non-classical TSA class, with detailed descriptions of available tools.
SNV INDEL Splice
variant Fusion Viral hERV
INTEGRATE-neo Only calls
MHC I pVACtools pVAC-Seq: missense SNV pVAC-Seq pVACfuse: Works downstream of INTEGRATE-neo calls Neopepsee Missense;
MHC I only
MHC I only
MuPeXI Missense Yes
TSNAD Missense/
nonsense Yes
NeoantigenR MHC I only
NeoepitopePred Missense;
MHC I only MHC I only
Epidisco
Missense/ nonsense; MHC I only
Yes; MHC I only Yes; Only RNA-seq based; MHC I only
Antigen.garnish Missense Yes
Neoepiscope Missense/
nonsense Yes
Virdetect Quantifier
only
PathSeq Quantifier
only
BioBloom Tools Quantifier
only RepeatMasker Quantifier only; not hERV specific hervQuant Quantifier only
17
18
1.8 Clinical translation of non-classical tumor-specific antigens
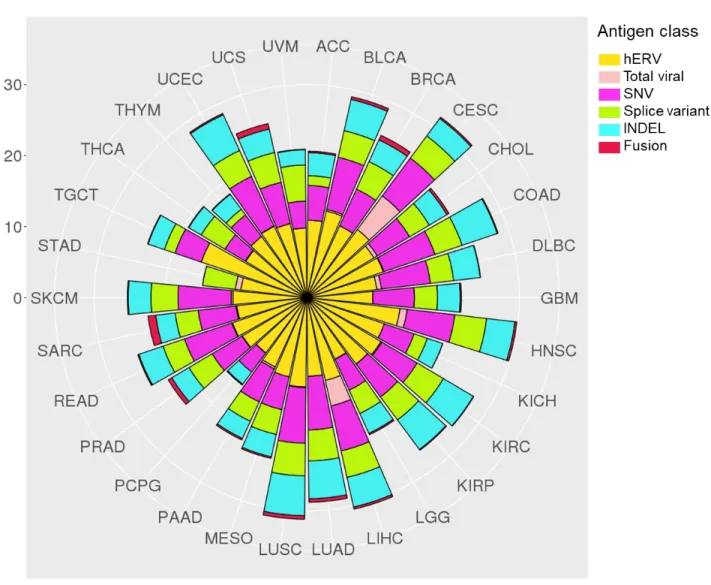
Recent studies (including several from our group) have provided estimates for antigenic burden of each TSA class among TCGA pan-cancer data, which we have compiled here (Figure 1.3, 1.4)11,50–53.
In addition to the clinical applicability of hERVs in ccRCC and LGG, testicular cancer (TGCT) contained substantially greater burden of hERV-derived TSAs than any other cancer type. This is in agreement with previous findings that TGCT was among the cancer types with the greatest hERV expression due to widespread
hypomethylation11,33.
Viral antigen burden was highest in cervical (CESC; HPV) and hepatocellular (LIHC; HBV) cancers, but also observed in subsets of head/neck squamous cell (HNSC; HPV) and stomach adenocarcinoma (STAD; EBV) tumors. Associated with these
findings, therapeutic cancer vaccines are currently in development for HPV-driven cervical cancer (VGX-310054), as well as EBV-driven nasopharyngeal cancers and
NK/T-cell lymphomas (MVA-EL55 and CMD-00356). Currently, no HBV therapeutic
vaccines have demonstrated convincing therapeutic efficacy.
INDEL- and SNV-neoantigen counts derived from a recent TCGA pan-cancer analysis demonstrated significant co-correlation among all cancer types (coefficient: 0.81, p < 0.0001)50. In agreement with Turajilic et al., notable outliers were clear cell
19
characterized by impaired DNA mismatch repair pathways, contain significantly greater INDEL burden compared to non-MSI-H tumors57,58. These data suggest that in RCC,
MSI-H tumors, and cancer types known to have high SNV-burden, INDEL-derived neoantigens should also be considered for vaccine selection.
Mean burden of fusion-derived neoantigens per sample was highest in sarcomas (SARC: 1.1, UCS: 0.78), with carcinoma fusion burden highest in breast and prostate cancer (BRCA: 0.70, PRAD: 0.58). SARC, BRCA, and PRAD all fall within the lower half of SNV-neoantigen number among all cancer types, making fusion-derived
neoantigens another potential avenue for vaccine development. While gene fusion data was not available for acute myeloid leukemia (LAML), gene fusion neoantigens have been a focus of study in leukemia (particularly AML, acute lymphocytic leukemia [ALL], and chronic myelogenous leukemia [CML]59).
Splice variant neoantigens demonstrated similar burden to INDEL-neoantigens, with significant co-correlation with INDEL- and SNV-neoantigen burden. A notably outlier is thyroid cancer (THCA), where average number of splice variant neoantigens per sample is higher than SNV-neoantigens. Mutations in spliceosome proteins (e.g. SF3B1, SRSF2, U2AF1/2) are common in myelodysplastic syndrome, acute
myelogenous leukemia (AML), chronic myelomonocytic leukemia (CMML), and chronic lymphocytic leukemia (CLL)60–64, resulting in the hypothesis that spliceosome mutations may cause expression of splice variant mRNA, leading to translation of neoantigens65–
67. As splice variant neoantigens have greater potential for dissimilarity from reference
20
21
22
Figure 1.4: Number of unique tumor specific antigens by cancer type. Plots represent number of unique identified epitopes by TCGA cancer type. SNV and INDEL epitopes are derived from Thorsson et al. (Immunity, 2018). Fusion epitopes are derived from Gao et al. (Cell Reports, 2018). Splice variant epitopes are derived from Jayasinghe et al. (Cell Reports, 2018). Viral epitopes are derived from Selitsky et al. (mSystems, 2018). hERV epitopes are derived from Smith et al. (JCI, 2018). All TSA classes represent number of predicted class I HLA binders (8-11mers, <500 nM) predicted from NetMHCPan. STAD INDEL and SNV calls were absent from Thorsson et al. ESCA, LAML, and OV were omitted from all reports.
1.9 Therapeutic platforms for tumor antigen vaccination
23
concerns, nanoparticle-based vaccine platforms have been proposed as an alternative vehicle strategy for tumor antigen vaccines.
Nanotherapeutics encompasses a class of delivery vehicles, including
nanoparticles, liposomes, dendrimers, and nano-discs. While nanotherapeutic delivery vehicles have been widely studied for vaccine platforms throughout the last several decades, neoantigen-based nano-vaccine platforms have arisen within the last several years68,69. The first description of a nanotherapeutic neoantigen vaccination platform
was from Kreiter et al., where mRNAs encoding for neoantigen epitope sequences were encompassed within a liposomal delivery system to generate tumor-specific T cell responses in several murine tumor models70. Built off of a previous report from Castle et al.71, the research group led by Ugur Sahin and Ozlem Tureci demonstrated the
efficacy of these neoantigen epitope encoding mRNAs to be derived from simultaneous activation of intra-cytoplasmic TLR7 (providing a DC activation and maturation signal) and mRNA translation within sentinel dendritic cells (DCs), which subsequently present these neoantigen epitopes alongside co-stimulatory receptor signaling ligands to
activation neoantigen-specific T cells (primarily CD4 T cells) that induced anti-tumor response14,72.
24
generate poly(lactic-co-glycolic acid (PLGA)-based antigen-capturing nanoparticles to improve the abscopal effect after B16F10 tumor irradiation75. Among the antigens
captured by the particles included several that were derived from proteins which contained neoantigenic epitopes, suggesting neoantigenic priming may be a potential mechanism behind the efficacy of this platform. Following these approaches, our work presented in Chapter 4.2 focuses on the design of a PLGA-based neoantigen peptide delivery platform.
1.10 Concluding remarks and contributions of this work
The studies presented in this document provide a multidisciplinary approach to address key understudied aspects of immuno-oncology, including aims to better
understand the mechanism of currently immunotherapies, and to discover and develop the next generation of immunotherapeutics to further advance our ability to cure
25
26
CHAPTER 2: Design and study of subtype-specific murine tumor models 2.1 Development of subtype specific mouse models of bladder cancer.
2.1.1 Introduction
In the United States, bladder cancer is the fifth most common malignancy with approximately 79,000 new cases and nearly 17,000 deaths expected in 201776. Bladder
cancer is comprised of both low-grade and high-grade tumors. Although low-grade tumors are almost uniformly noninvasive (Ta), high-grade tumors can become muscle-invasive and metastatic.
Multiple studies have now identified distinct RNA expression subtypes within both low- and high-grade bladder cancer5–7,77–82. Building upon the work of Hoglund and colleagues77, we along with others have recently described distinct subtypes of
high-grade muscle-invasive urothelial carcinoma, which we have termed luminal-like and basal-like, that have gene expression patterns that appear to be consistent with differentiation states of normal urothelium and reflect gene expression patterns and biology between breast and bladder cancer5–7,83.
27
immunosuppression84–89. Response to PD-1 axis inhibition in urothelial bladder cancer has been associated with a number of intrinsic tumor features such as tumor mutational burden and tumor molecular subtype, as well as tumor microenvironment features such as the presence of PD-L1–expressing tumor-infiltrating immune cells, CD8+ cytotoxic T cells in the tumor, and expression of effector T-cell genes by gene expression
profiling85.
Multiple immunocompetent mouse models of bladder cancer currently exist including the carcinogen-induced models: MB49 (DMBA-derived cell line) and BBN [N-butyl-N-(4-hydroxybutyl)nitrosamine]90,91 as well as numerous autochthonous,
genetically engineered murine (GEM) models92, some of which progress to
muscle-invasive bladder cancer and metastasis93–96.
We report here the generation of a novel GEM model of high-grade, muscle-invasive bladder cancer that faithfully recapitulates the luminal molecular subtype of bladder cancer: Upk3a-CreERT2; Trp53L/L; PtenL/L; Rosa26LSL-Luc (UPPL) mice. This model is characterized by papillary histology and decreased levels of immune infiltration relative to basal tumors derived from BBN-treated animals, a pattern that is similar to human disease7,77,83. We have generated cell line adoptive transfer models for
luminal-like UPPL tumors as well as for basal tumors derived from BBN-treated animals. Cell line–derived tumors from the UPPL model maintain luminal-like characteristics, such as high expression of Pparg and Gata3 gene signatures. Moreover, gene
28
biology in immunocompetent mice, these models can be used to interrogate subtype-specific responses to immune checkpoint inhibition and other immunotherapy strategies in vivo.
2.1.2 Materials and Methods
Mouse models and establishment of mouse bladder cancer cell lines
All animal studies were reviewed and approved by The University of North Carolina at Chapel Hill Institutional Animal Care and Use Committee. For the BBN carcinogen-induced mouse bladder cancer model, C57BL/6 mice (Charles River Laboratories) were continuously exposed to 0.05% N-butyl-N-(4-hydroxybutyl)
nitrosamine (BBN) in drinking water. Trp53 and Pten conditional knockout mice were obtained from The Jackson Laboratory (STOCK: 008462) and Terry Van Dyke (National Cancer Institute, Bethesda, MD; ref. 25)97, respectively, and crossed with
Upk3a-CreERT2 allele (The Jackson Laboratory STOCK: 015855) and the Rosa26LSL-Luciferase allele (The Jackson Laboratory, STOCK: 005125; UPPL model) or crossed with Krt5-CreERT2 allele (a gift from Brigid Hogan, Duke University, Durham, NC) and Rosa26LSL-tdTomato (The Jackson Laboratory, STOCK: 007914; KPPT model). In order to induce Cre recombination in the bladder of UPPL or KPPT mice, 5 mg of tamoxifen was given orally by gavage in both the UPPL and KPPT model. In the KPPT model, transurethral injection of 4-hydroxy-tamoxifen was also performed. Tumor development was regularly monitored by bladder ultrasonography.
29
or tumor size diameter of >7 mm as evaluated by bladder ultrasound. In our studies, all mice were sacrificed because of tumor size. The endpoint for allograft models was tumor volume >500 mm3, skin ulcer formation, or weight loss greater than 20% body
weight.
Generation of UPPL1541 and BBN963 cell lines
Once the bladder tumors became >7 mm in diameter, they were harvested for pathologic evaluation, in vitro analysis, and for establishing cell lines. Tumors were dissociated and digested with collagenase and dispase (Roche). The dissociated tumor cells were resuspended in growth media and plated to a plastic plate as described previously98. Cell lines were passaged more than 10 times before use. Mycoplasma
testing was performed monthly while cells were in culture.
MB49 cell lines were obtained from Molly Ingersol (Institut Pasteur, Paris, France). Mycoplasma testing was performed monthly while cells were in culture.
RNA/DNA extraction, library prep, and RNA sequencing or whole-exome sequencing
RNA was extracted from the primary tumors and the established cell lines using an RNeasy Kit (QIAGEN), and DNA was extracted from primary tumors, established cell lines, and tail clippings using a DNeasy Kit (Qiagen). Whole-exome and transcriptome library preparation was performed using Agilent SureSelect XT All Exon and Illumina TruSeq Stranded mRNA Library Preparation Kits, respectively. Libraries were
30
RNA sequencing analysis
Sequence reads were aligned to the murine genome (mm9), and gene expression was generated as reads per kilobase of exon model per million mapped reads per gene by using MapSplice and upper quartile normalized via RSEM (University of Kentucky Bioinformatics Labs, Lexington, KY; ref. 27)99.
RNA sequencing (RNA-seq) data were normalized for variations in read counts, log2 transformed, and median centered before analysis. When combining datasets, we adjusted for batch effects using the surrogate variable analysis R package (version 3.12.0; R Foundation). Subtype calls were made using the BASE47 classification algorithm based on the median-centered expression of Mus musculus homologs of genes found in the classifier7. Clustering was done using average linkage clustering
with a centered correlation similarity metric. Immune gene signature scores were derived as described previously83.
Gene data were grouped into immune gene signatures, which were murine orthologs of signatures previously identified through unsupervised clustering and gene expression profiling of sorted immune cells83,100,101. Gene data were matched to
predefined immune gene signature clusters via Entrez IDs. Each gene signature was calculated as the average value of all genes included in the signature. Differential
expression for each gene signature was analyzed between tumor models and treatment groups via ANOVA (one-way ANOVA), adjusted for multiple testing using an FDR of 0.05. To determine the prognostic value of each immune gene signature, linear
31
variable compared with tumor size. Heat map of the log10 transformed P value of gene signature correlations was displayed with color gradient calculated via:
−(𝑙𝑜𝑔10(𝑝 − 𝑣𝑎𝑙𝑢𝑒) − 𝑙𝑜𝑔10(0.05)) ∙ 𝑠𝑖𝑔𝑛 𝑜𝑓 𝑐𝑜𝑒𝑓𝑓𝑖𝑐𝑖𝑒𝑛𝑡
Gata3 and Pparg gene signatures
The PPARy gene signature was derived by determining the genes that are significantly upregulated (samr package FDR < 0.05) in UMUC9 cells treated with rosiglitazone, a PPARy agonist in the GSE47993 dataset83. The GATA3 gene signature
was pulled from the BIOCARTA curated gene signature set in MSigDB. Gene expression data have been deposited GSE112973.
PvClust
The significance of clustering nodes was determined using the pvclust R package (version 2.0-0, R Foundation; ref. 30)102. Significance of all nodes was
calculated with a correlation distance metric and average linkage clustering.
qPCR normalization for TCR/BCR repertoire profiling
Tumor RNA concentrations were determined using a Qubit RNA BR Assay Kit, 1:200 in dilution buffer. Using a Qiagen Quantitect Reverse Transcription Kit, cDNA was synthesized from 50 ng to 1 μg starting total RNA. RNA derived from column-purified T/B cells was included as a positive control, and DI H2O was included as a negative
32
Quantitative PCR was performed in triplicate with 0.5 μmol/L of each forward and reverse primers, 0.1 μmol/L TaqMan probe [T-cell receptor (TCR): FAM reporter with TAMRA quencher; B-cell receptor (BCR): VIC reporter with TAMRA quencher], cDNA (2.5 μL), and Bio-Rad SsoAdvanced Universal Probe Supermix (2×) and DI H2O for a
final volume of 10 μL per well. Cycling conditions for TCR and BCR were both set for 45 cycles of recommended TaqMan conditions for the QuantStudio 6 Flex system.
Purified T/B-cell cDNA was used for positive control and calibration curve, and the template-free cDNA synthesis reaction was used for negative control. The
calibration curve was determined using Ct values from purified T/B-cell cDNA, 10-fold
serially diluted in nuclease-free water ranging from 1:0 (cDNA: H2O, v/v) to 1:1 × 10¹².
For both T- and B-cell calibration curves, Ct values were detectable as dilute as 1:1 ×
105, with a coefficient of determination of >0.99 for the linear fit of log10(dilution) versus
Ct. Each sample's Ct value was read out as the ratio of T- or B-cell cDNA to total cDNA. 5′ RACE amplification of TCR/BCR sequences
Based on qPCR results, all tumor samples were normalized by T- or B-cell RNA starting template. Using a Clontech SMARTer RACE 5′/3′ Kit, cDNA was generated using the manufacturer's protocol. cDNA was diluted with tricene/EDTA buffer, and 5′ RACE was carried out using the manufacturer's protocol with 0.5 μmol/L custom
barcoded gene-specific reverse primer, using a Veriti thermocycler (Applied Biosystems Veriti 96-well) with the following cycling conditions:
30 cycles:
33
68°C, 30 seconds
72°C, 3 minutes
5′ RACE products were pooled, and clean-up/concentration were performed using a Zymogen Genomic DNA Clean & Concentrator. Pools of samples were eluted in 32 μL of nuclease-free water heated to 70°C. DNA concentration was measured using a Qubit DNA HS Assay Kit. Purity (A260/280nm and A260/230nm ratios) was determined using a ND-1000 spectrophotometer. Pooled DNA (1–5 μL) was visualized in a 1.5% agarose gel to confirm the presence of proper band sizes (TCR and BCR: 400–500 bp).
TCR/BCR repertoire profiling
For TCR/BCR repertoire studies, pooled TCR or BCR amplicons were size selected using a Sage Science Pippin Prep 1.5% agarose cassette (HTC1510). Bands were size selected at 450 to 650 bp. After size selection, samples were analyzed using either Agilent 2100 Bioanalyzer or Tapestation to ensure purity. Illumina MiSeq library preparation was performed using a KAPA Biosystems DNA Preparation Kit. Libraries were run at 6 pmol/L on an Illumina MiSeq using a 600-cycle kit (2 × 300 paired-end), with 15% PhiX spike-in.
Mouse allograft model and treatment by anti–PD-1 antibody
BBN963 and UPPL1541 cell lines were injected subcutaneously in C57BL/6J mice at 1 × 10⁷ and 1 × 10⁶ cells, respectively. Once tumors reached 200 mm3 in tumor
34
administered once a week at a dose of 10 mg/kg. The tumor size was measured by caliper weekly or twice weekly.
Flow cytometry
For tissue dissociation, tissues were homogenized in cold media using the GentleMACs Dissociator, and the samples were passed through a 70 μm cell strainer using a 5-mL syringe plunger. The samples were centrifuged for 7 minutes at 290 RCF, 4°C, decanting the supernatant. The remaining pellet was resuspended into 1 mL of ACK lysis buffer (150 mmol/L NH4Cl, 10 mmol/L, KHCO3, 0.1 nmol/L Na2EDTA in DPBS, pH 7.3) for 2 minutes at room temperature before quenching with 10 mL of cold media. The samples were centrifuged for 7 minutes at 290 RCF, 4°C, resuspended in 10 mL of cold media, and passed through a 40 μm cell strainer. Cell counting was performed by running a diluted aliquot of sample on a MACSQuant flow cytometer, counting lymphocytes as gated by forward scatter area versus side scatter area.
Samples were washed and resuspended in cold DPBS, normalized by count, and transferred onto a 96-well V-bottom plate at 2.5 × 10⁶ lymphocytes per well. Cells were
resuspended in FVS700 viability stain (BD, 1:1,000 dilution in 100 μL DPBS) for 40 minutes on ice. Wells not receiving viability staining were resuspended in DPBS. Cells were washed twice in staining buffer (0.02% NaN3, 2% BSA in DPBS), resuspended in 50 μL Fc block (1:50 dilution in staining buffer), and incubated on ice for 15 minutes. Antibody master mix was added to samples at 50 μL per sample with final antibody concentrations as indicated in Supplementary Table S1 (all mAbs from BD
35
Cells were incubated on ice in the dark for 45 minutes and washed twice with staining buffer. Cells were fixed in 2% paraformaldehyde overnight. The following morning, a minimum of 100,000 events were collected for each sample on a BD
LSRFortessa flow cytometer. FlowJo flow software Version 10 (Treestar) was used for analyses. Fluorescence Minus One controls were used to guide gating strategies.
Analysis and statistics
All flow cytometry, TCR/BCR sharing, and Shannon entropy statistics were calculated with Mann–Whitney U test.
For TCR/BCR amplicon sequencing analyses, raw .fastq files were demultiplexed by barcode sequences of the gene-specific primers. Sorted R1 and R2 files were
respectively merged. Sequencing quality was confirmed through the FastQC quality control tool. TCR and BCR amplicon data were analyzed via IMGT/HighV-QUEST. Data were converted into standard in-lab format, and downstream analysis was performed with custom scripts as well as the tcR R package.
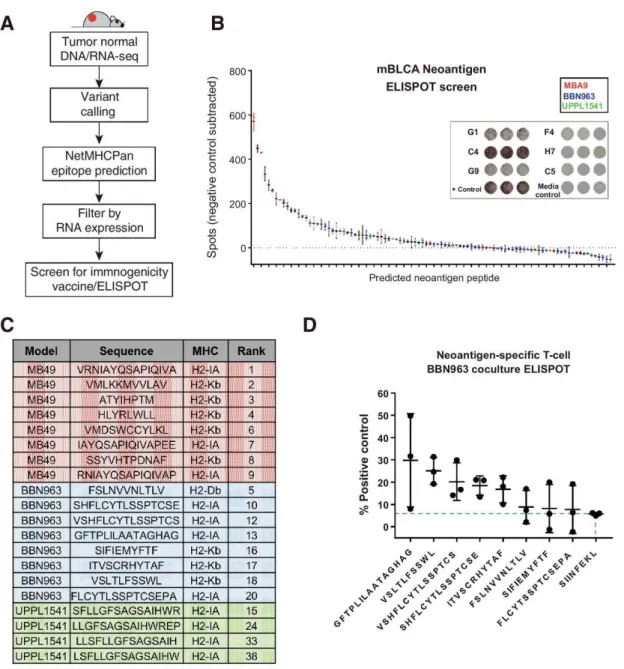
Neoantigen prediction
C57BL/6 mice were given a single subcutaneous flank injection of BBN963, UPPL1541, or MB49 cells. Tumor growth was monitored until tumors reached 100 mm3, at which point mice were humanely sacrificed with CO2 asphyxiation followed by cervical dislocation. Tumors were dissected for downstream DNA/RNA extraction as described above. Matched normal DNA was extracted from tail-clippings or liver from the mouse in which the cell lines were respectively derived. Library prep and
36
neoantigens was performed as described previously83. Predicted neoantigens were
filtered on expression in all replicates with >5× read support.
Vaccine/ELISPOT assay for neoantigen immunogenicity
Predicted neoantigen peptides were synthesized by New England Peptide, using custom peptide array technology. C57BL/6 mice were vaccinated with predicted
neoantigen peptides, given as a subcutaneous injection of a pool of 8 equimolar
peptides (5 nmol total peptide) and 50 μg poly(I:C) in PBS. A second identical injection was repeated 6 to 7 days after primary injection. Mice were humanely sacrificed with CO2 asphyxiation followed by cervical dislocation 5 to 6 days after second injection.
Spleens were harvested and prepared into a red blood cell lysed, single-cell
suspension. Splenocytes were plated in triplicate at 5 × 10⁵ cells per 100 μL media onto
an IFN-γ capture antibody-coated ELISPOT plate (BD Biosciences) for 48 hours, along with 1 nmol of a single peptide against which the respective mouse was vaccinated. IFN-γ expression was compared with splenocytes incubated with vehicle control.
Neoantigen-enriched T-cell coculture
C57BL/6 mice were vaccinated with either a pool of the top 8 predicted BBN963 neoantigens or irrelevant peptide (SIINFEKL) control, with a second identical booster given 7 days after primary vaccine. One week after secondary vaccination, spleens were harvested and prepared into a red blood cell lysed, single-cell suspension. T cells were isolated using Miltenyi murine Pan T Cell Isolation Kit II. Using previously
described methods103, T cells were expanded in the presence of bone marrow–derived
37
vaccinated against. Seven days following ex vivo expansion, 1 × 10⁵ T cells were
cocultured 10:1 with BBN963 cells onto an IFN-γ capture ELISPOT plate for 72 hours. Controls included T cell only, BBN963 only, and media only negative controls, as well as antigen-enriched T cells cocultured with respective peptide-pulsed UPPL1541 cells as positive control. Signal intensity was read out using an ELISPOT plate reader. T-cell/BBN963 coculture spot counts were subtracted from their respective T-cell only control, and then taken as a percentage of the counts from their respective peptide-pulsed target positive controls.
Supplemental material
All supplemental figures and tables cited in Chapter 2.1 are listed according to the original published manuscript, which can be found at
http://cancerres.aacrjournals.org/content/78/14/3954.figures-only.
2.1.3 Results
Inactivation of Pten and Trp53 in Uroplakin3a-expressing cells results in
muscle-invasive, high-grade urothelial carcinoma
Our previously published studies describing luminal-like and basal-like molecular subtypes of bladder cancer demonstrated that these subtypes reflect the gene
expression patterns of the differentiation states of the normal urothelium7. Basal-like
bladder tumors harbor gene expression patterns most similar to basal and intermediate cell layers of the bladder, whereas luminal tumors harbor gene expression patterns most similar to umbrella cells5,7. To determine whether different cells of origin account
38
grade, muscle-invasive bladder cancer, we conditionally inactivated Pten and Trp53 in Keratin5 (K5) or Uroplakin3a (Upk3a)-expressing basal/intermediate and
umbrella/intermediate cell layers, respectively, using previously reported
K5-CreERT2104 and Upk3a-CreERT2 (The Jackson Laboratory) transgenic mice. Dual
inactivation of Pten and Trp53 by surgical injection of adenoviral cre into the bladder has been previously shown to induce bladder cancer in mice96. Using standard animal
husbandry, we generated cohorts of Upk3a-CreERT2; Trp53L/L; Pte/L/L; Rosa26LSL-Luc mice (hereafter termed “UPPL”) as well as K5-CreERT2; Trp53L/L; PtenL/L; Rosa26LSL-tdTomato mice (hereafter called “KPPT”) that were backcrossed 10 times to a C57BL/6 background. Both UPPL and KPPT mice were gavaged with tamoxifen every other day for 3 doses starting at 6 to 8 weeks of age to induce CreERT2 activity. Serial in vivo luminescence (for UPPL mice) and ultrasound of the bladder were used to monitor for tumor development and growth. UPPL mice demonstrated gradually
39
Figure 2.1: Inactivation of Pten and Trp53 in Upk3a-expressing cells results in high-grade muscle-invasive bladder tumors. (A) Bioluminescent images of UPPL mice at indicated time points. (B) Quantification of luminescence over the region of the bladder. (C) Ultrasound images of bladder tumor formation. (D) Tumor-free survival as detected by ultrasound. (E) Gross images of the kidneys and bladder from a tumor-bearing UPPL mouse. (F) Tumor stage assessed histologically based on human TNM staging.
In contrast, KPPT mice administered tamoxifen by gavage died rapidly of
epithelial hyperplasia of the snout, paws, and papillary skin lesions (Supplementary Fig. S1A–S1C). This likely represents the inactivation of Pten and Trp53 (and pursuant epithelial overgrowth) in K5-expressing basal cells in multiple organs including the epidermis, trachea, and gastrointestinal tract. In an attempt to activate K5-CreERT2 solely in the K5-expressing basal cells of the bladder, we administered
40
attenuated phenotype to KPPT mice that had been gavaged with tamoxifen
(Supplementary Fig. S1B and S1C) and had a shortened survival. In contrast, KPPT mice injected with intravesical 4-OHT at 200 nmol/L had an extended survival but did not develop bladder tumors despite Cre-mediated recombination as evidenced by increased tdTomato signal over the region of the bladder by IVIS imaging
(Supplementary Fig. S1D). Moreover, histologic examination of the bladders of mice injected with intravesical 4-OHT at 2,000 or 200 nmol/L showed no significant histologic changes of the urothelium (Supplementary Fig. S1E).
Approximately 95% of UPPL mice developed tumors within 77 weeks (Figure 2.1D). Grossly, bladder tumors in UPPL mice appeared to be papillary in nature (Figure 2.1E), which is a feature documented to be enriched in the luminal-like molecular
subtype5,6. Histologically, the UPPL tumors were characterized as high grade by an
41
42
BBN and UPPL models are basal- and luminal-like models, respectively, of human
bladder cancer
Bladder tumors induced by the carcinogen N-Butyl-N-(4-hydroxybutyl) (BBN) have been previously documented to harbor a number of histologic features (e.g., squamous differentiation, Supplementary Fig. S2A–S2D) and gene expression patterns known to be found in basal-like bladder tumors79. We therefore established 11
independent BBN-induced bladder tumors by continuously administering 0.05% BBN in drinking water as described previously91. Given the papillary nature of UPPL tumors, we
hypothesized that they correspond to a luminal-like molecular subtype. We therefore performed global transcriptome profiling of 9 UPPL and 11 BBN mouse tumors using RNA-seq. We first performed molecular subtype classification using our previously published BASE47 (bladder cancer analysis of subtypes by gene expression; ref. 3)7
43
44
heatmap of MB49, BBN963, UPPL1541, and normal urothelium (KT) cell lines across the top 10% most differentially expressed genes across the samples. (E) Unsupervised clustering heatmap of MB49, BBN963, and UPPL1541 cell line–derived tumors across the top 10% most differentially expressed genes across the samples. (F) Box plots of Pparg and Gata3 gene signature scores from RNA-seq data of BBN963 and UPPL1541 cell line–derived tumors. (G) IPA analysis plots showing activated pathways in MB49 cell line–derived tumors relative to BBN963 and UPPL1541 cell line–derived tumors. (H) Flow cytometry plot for EpCAM expression in 3T3, MB49, UPPL1541, and BBN963 cell lines. (I) Western blot of whole-cell lysates from 3T3, MB49, MBT2, and BBN963 cell lines blotted for the indicated antibodies.
Currently, very few cell lines exist for modeling bladder cancer in
immunocompetent mice; therefore, we set out to generate additional cell lines that could be utilized in future studies. In particular, MB49 cells have long been the workhorse of syngeneic bladder cancer cell lines90 for studies requiring an immunocompetent host.
Given the long latency of tumor formation in the UPPL model, we established tumor cell lines from both UPPL and BBN tumors using the conditional reprogramming of cells (CRC) method described previously98. Specifically, transplantable cell lines were
established from BBN (BBN963) and UPPL (UPPL1541) tumors (Figure 2.3C) and have been confirmed to grow in C57BL/6 mice. In parallel, using the CRC method, we generated three primary cell lines derived from normal mouse urothelium of tamoxifen-treated K5-CreERT2; Rosa26LSL-tdTomato mice, hereafter called KT mice (KT1044, KT1975, and KT1970) as a normal reference for comparison. Interestingly, the vast majority of epithelial cells that grew in vitro from CRC culture of KT mouse bladders expressed tdTomato, suggesting they at some point had expressed K5 (Supplementary Fig. S3).
45
and KT1970). Unsupervised hierarchical clustering of the cell lines on differentially regulated genes across samples (Supplementary Table S2) demonstrated that MB49 cells had transcriptome profiles that differed significantly from the other cell lines
(Figure 2.3D) when tested by multiscale bootstrap resampling (P = 0.0, Supplementary Fig. S4A), whereas BBN963 and UPPL1541 cells had transcriptome profiles that more closely resembled normal urothelial (KT) cells. To ensure that we had not tainted our MB49 cells, we obtained MB49 cells from an independent source (Phil Abbosh, Fox Chase Cancer Center, Philadelphia, PA) and performed transcriptome profiling. We found that the transcript level (across all genes) is highly correlated when comparing “UNC MB49” with “FCCC MB49” (R = 0.94 respectively, Supplementary Fig. S4B), suggesting our MB49 cells were genuine. Intriguingly, hierarchical clustering of MB49 cells with 3T3 cells, our three primary mouse urothelial cell lines, BBN963 cells, and UPPL1541 cells demonstrated that the MB49 cells coclustered with 3T3 cells
46
tumors (Figure 2.3F), demonstrating that cell line–derived UPPL1541 tumors maintain molecular features of a luminal-like molecular subtype.
We next performed Ingenuity Pathway Analysis comparing MB49, UPPL1541, and BBN963 cell line–derived tumors. General pathways related to cancer were
enriched in BBN963 tumors relative to UPPL1541 tumors (Supplementary Fig. S5B). In contrast, pathways related to fibrosis and epithelial-to-mesenchymal transition (EMT) appeared to be highly upregulated in MB49 cell line–derived tumors compared with either the BBN963 or UPPL1541 tumors (Figure 2.3G). Based on these observations, we examined the expression of a set of epithelial markers in the mouse bladder cell lines. Assessment of EpCAM by flow cytometry demonstrated that a significant
proportion of BBN963 and UPPL1541 cells expressed cell surface EpCAM while MB49 cells had little to no EpCAM expression, similar to the mouse fibroblast line 3T3 (Figure 2.3H). In keeping with this finding, we also noted that MB49 cells did not express K5 or K14 in immunoblots of whole-cell lysates (Figure 2.3I), implying that MB49 cells have lost characteristic urothelial cytokeratin expression patterns potentially from undergoing EMT. Furthermore, we noted that MB49 cell line–derived tumors had relatively high and low expression of vimentin and Cdh1 (E-cadherin), respectively, consistent with MB49 cells being more mesenchymal than BBN963 and UPPL1541 cell line–derived tumors (Figure 2.3I; Supplementary Fig. S6). In aggregate, these findings suggest that MB49 cells and tumors more closely resemble fibroblasts than urothelial cells and highlight the potential benefit of our models.
47
Human basal-like and luminal-like bladder cancers demonstrate different patterns of immune infiltration and are also correlated with differential response to checkpoint inhibitor therapy83,85, suggesting subtype-specific differences in the tumor-immune
microenvironment. Immune gene signature expression derived from previously published studies were compared among 11 BBN and 9 UPPL models83,100,101,105.
Consistent with immune gene signature patterns observed in human tumors, BBN (basal-like) tumors demonstrated greater overall expression of immune gene signatures (Figure 2.4A; Supplementary Fig. S7A) than did UPPL (luminal-like) tumors, including those for T cells, B cells, dendritic cells, other innate immune cells, and
48
49
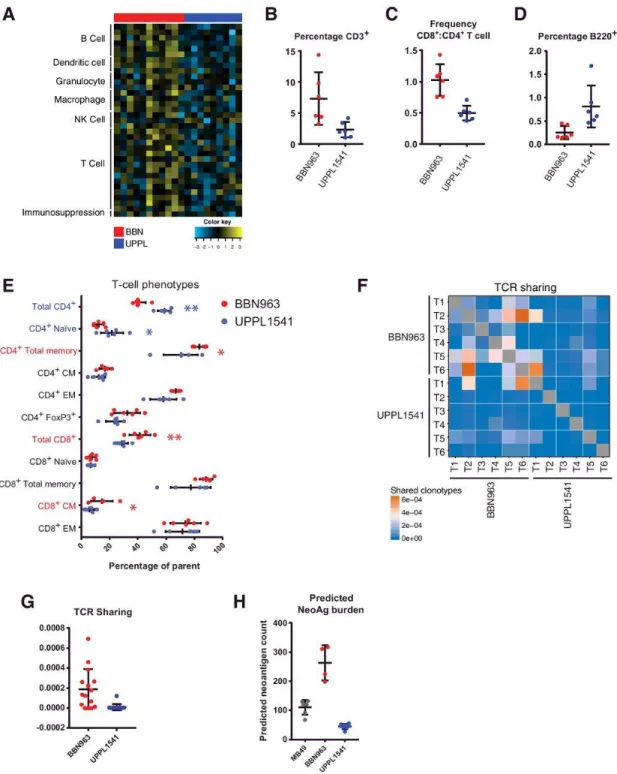
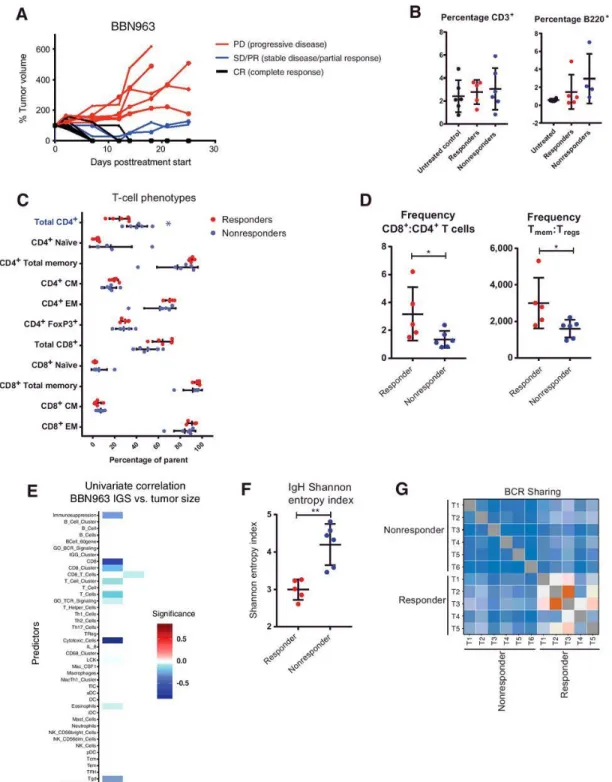
increased phenotypes highlighted with respective colors (Mann–Whitney U test, *, P < 0.05; **, P < 0.001). (F and G), Heatmap (F) and respective quantification (G) of T-cell receptor clonotype sharing within cell line–derived BBN963 and UPPL1541 tumors, derived from whole-tumor RNA-based T-cell receptor amplicon sequencing. H) Predicted neoantigen burden (class I and II, >500 nmol/L predicted binding affinity) in MB49, BBN963, and UPPL1541 cell line–derived tumors.
To further explain the observed immunologic differences between BBN and UPPL tumors, we performed flow cytometric analysis in cell line–derived BBN963 and UPPL1541 tumors. Comparing the frequency of tumor infiltrating lymphocytes (TIL) by flow cytometry from BBN963 and UPPL1541 tumors, we observed significantly greater frequencies of CD3+ T cells (Figure 2.4B), as well as increased ratio of CD8+ cytotoxic T cells to CD4+ helper T cells (Figure 2.4C) in BBN963. Somewhat surprisingly, the proportion of B cells was higher in UPPL tumors; however, the overall proportion of B cells in the lymphocytic infiltrate was low (Figure 2.4D). To further characterize the phenotype of the tumor-infiltrating T cells, expressions of CD44 and CD62L were used to identify naïve (CD44−, CD62L+), central memory (CM; CD44+, CD62L+), and effector memory (EM; CD44+, CD62L−) populations. Among CD4+ T cells, UPPL1541 tumors were enriched for naïve T cells, whereas the frequency of the total memory pool (CD44+) was significantly greater in BBN963 tumors (Figure 2.4E). Moreover, EM and CM frequencies both trended higher in BBN963. Among CD8+ T cells, the CM
frequency was significantly greater in BBN963. In addition, CD4+ FoxP3+ regulatory T cells trended toward higher frequency in BBN963. Thus, memory subpopulations of both CD8+ and CD4+ T cells had increased frequencies in the BBN tumors, suggesting the presence of an antigen driven T-cell response in BBN963.
50
animals (Figure 2.4F,G), suggesting that there may be greater convergent repertoire selection in BBN tumor-infiltrating T cells in the context of an antigen-driven response. To examine whether the increased immune infiltration and TCR repertoire sharing seen in BBN tumors were associated with the number of targetable tumor antigens, we
performed neoantigen prediction on BBN963 and UPPL1541 cells and not unexpectedly observed significantly higher neoantigen burden in BBN963 compared with UPPL1541 (Figure 2.4H; Supplementary Tables S4 and S5). This, in combination with the
increased TCR repertoire sharing, further supports the hypothesis that the immune infiltration seen in BBN tumors is driven by an antigen-specific immune response.
To investigate the functional significance of immune infiltrating T-cell
subpopulations, we performed univariable linear regression with frequency of T-cell phenotypic subpopulations as a continuous predictor variable and tumor mass as the response variable in untreated mice. In BBN963, the frequency of total and naïve CD8+ T cells was positively associated with tumor mass, and the frequency of CD4+ memory, CD4+ CM, total CD8+ memory, and CD8+ EM T cells were all inversely correlated with tumor mass (Supplementary Fig. S7B). In UPPL1541, no features were positively associated with tumor mass, whereas CD8+ total memory and specifically CD8+ CM T cells were both weakly inversely correlated with tumor mass. These associations are suggestive of tumor-infiltrating memory T cells being functional and capable of antitumor activity in both BBN and UPPL, with greater functional significance in BBN963.
51
The relative overexpression of immune gene signatures and evidence of an antigen driven T-cell response in BBN963 cell line–derived tumors are suggestive of possible greater responsiveness to immune checkpoint inhibitor therapy in BBN963. Accordingly, we observed dramatic decreases in mean tumor volume in BBN963
following anti–PD-1 therapy, while UPPL1541 tumors demonstrated only modest control of tumor growth (Figure 2.5A,B). Despite the mean tumor size being substantially controlled in BBN963 following anti–PD-1 therapy, the growth pattern of individual tumors demonstrated a mixed-response pattern (Figure 2.5C). There was
52