www.impactjournals.com/oncotarget/ Oncotarget, Vol. 7, No. 40
The ELK3-GATA3 axis orchestrates invasion and metastasis of
breast cancer cells in vitro and in vivo
Sun-Young Kong2,3,4, Kwang-Soo Kim1, Jiewan Kim1, Min Kyeong Kim2, Ki Hong Lee2,
Je-Yong Lee1, Nuri Oh1, Ji-In Park1, Ji-Hoon Park1, Sun-Hee Heo5, Sung Han Shim1,
Dong Ryul Lee1, Keun Pil Kim6, Kyung-Soon Park1
1Department of Biomedical Science, College of Life Science, CHA University, Seoul, Korea
2Department of System Cancer Science, Graduate School of Cancer Science and Policy, National Cancer Center, Seoul, Korea 3Translational Epidemiology Branch, Research Institute, National Cancer Center, Seoul, Korea
4Department of Laboratory Medicine, Center for Diagnostic Oncology, Hospital, National Cancer Center, Seoul, Korea 5Biomedical Research Center, Asan Institute for Science and Department of Pathology, Asan Medical Center, University of
Ulsan, College of Medicine, Ulsan, Korea
6Department of Life Science, Chung-Ang University, Seoul, Korea
Correspondence to: Kyung-Soon Park, email: kspark@cha.ac.kr
Keywords: ELK3, GATA3, metastasis, migration, invasion
Received: February 02, 2016 Accepted: August 13, 2016 Published: August 19, 2016
ABSTRACT
Triple-negative breast cancer is a highly aggressive tumor subtype that lacks effective therapeutic targets. Here, we show that ELK3 is overexpressed in a subset of breast cancers, in particular basal-like and normal-like/claudin-low cell lines. Suppression of ELK3 in MDA-MB-231 cells led to transdifferentiation from an invasive mesenchymal phenotype to a non-invasive epithelial phenotype both in vitro and
in vivo. Suppression of ELK3 resulted in extensive changes in genome expression
profiles. Among these, GATA3, a master suppressor of metastasis, was epigenetically activated. Also, suppression of GATA3 led to the restoration of migration and invasion. These results suggest that the ELK3-GATA3 axis is a major pathway that promotes metastasis of MDA-MB-231 cells.
INTRODUCTION
Up to 90% of deaths in patients with solid tumors can be attributed to metastasis [1]. The metastatic cascade is a complex process that culminates in tumor cell acquisition of genetic and epigenetic changes that enable them to survive the journey from the primary tumor site to the metastatic site. Aggressive tumor cells are predicted to display a high degree of cellular plasticity, meaning that they display both epithelial and mesenchymal
characteristics. Recent studies identified a set of
pleiotropic transcription factors (Snail, Slug, and ZEB1/2), which together form an intricate transcriptional circuit to induce epithelial-mesenchymal transition (EMT) [2, 3]. Although several transcription factors and extracellular
factors that control EMT and MET have been identified,
the underlying molecular mechanisms remain unclear. ELK3 is an ETS domain-containing protein capable of forming a ternary complex with DNA and Serum Response Factor. Although ELK3 functions as a transcriptional repressor, it can be transformed into
a transcriptional activator via RAS/ERK signaling [4]. Another interesting feature of ELK3 is that it contains a
leucine-rich nuclear export signal within the first helix
of the ETS DNA-binding domain, which is involved in the export of ELK3 from the nucleus to the cytoplasm in response to stress activated kinases, in particular JNK [5]. It is unclear whether ELK3 functions as a tumor promoter or as a tumor suppressor. Tumors that develop in mice lacking the ELK3 protein are small due to a lack of vascularization/oxygenation [6, 7]. Malignant progression of squamous cell carcinoma (SCC) requires ELK3 expression, and knockdown (KD) of ELK3 severely impairs tumor growth and inhibits progression from benign papillomas to SCC [8]. Conversely, ELK3 also functions as a tumor suppressor. The oncogenic microRNA, has-miR-155-5p, targets ELK3 and is implicated in the dynamics of the hypoxic response, which is a critical cellular process in cancer [9]. ELK3 strongly represses transcription of the proto-oncogene, c-fos, and overexpression of ELK3 inhibits the proliferation of pancreatic cancer cells [10]. Furthermore, expression
of caveolin-1, which accumulates in high amounts in metastatic lymph nodes during human lung tumorigenesis, is suppressed by ELK3 [11].
Breast cancer is the second leading cause of cancer-related death in women, and its incidence increases with
age. Breast tumors can be classified as distinct subtypes based on gene expression profiling and hierarchical
clustering analysis [12]. Basal triple-negative breast cancer (BTNBC), which lacks estrogen receptor (ER), progesterone receptor, and ErbB2 expression, has a poor outcome and high metastatic potential. The human breast cancer cell line, MDA-MB-231, recapitulates many of the biological and molecular features of BTNBC, and has been used extensively as a model cell line to study the molecular mechanisms underlying metastasis.
GATA3 is a zinc-finger transcription factor that
is involved in development and differentiation. Recent studies show that GATA3 is exclusively expressed in ER-positive, well differentiated, early stage breast cancers [13]. In addition, expression of GATA3 inhibits breast cancer metastasis by driving invasive cancer cells to undergo MET [14]. GATA3 nucleates a transcription repression program to inhibit the invasive potential of breast cancer cells in vitro and to suppresses metastasis in vivo; it does this by targeting a cohort of genes, including ZEB2, which is critically involved in EMT [15]. However, the tumor suppressor activity of GATA3 has been challenged by recent reports showing that GATA3 is similarly expressed in both primary and metastatic breast carcinoma [16, 17].
Previously, we reported that ELK3 is highly expressed in MDA-MB-231 cells, and that it plays a positive role in metastasis [18]. The aim of the present study was to increase our understanding of the mechanism underlying ELK3 activity during tumorigenesis and metastasis of BTNBC. We provide evidence that ELK3 is an upstream inhibitor of GATA3. The in vitro and in vivo results suggest that suppression of ELK3 reprograms metastatic mesenchymal MDA-MB-231 cells into a non-metastatic epithelial cancer cell type. Epigenetic activation of GATA3 in ELK3 KD cells, and restoration of migration and invasion ability upon suppression of GATA3 in ELK3 KD cells, suggests that the ELK3-GATA3 axis is a major pathway that activates metastasis of MDA-MB-231.
RESULTS
Suppression of ELK3 in vitro reprograms MDA-MB-231 cells to a less invasive phenotype
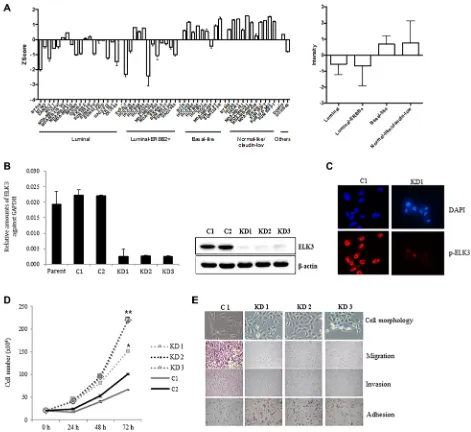
We first examined ELK3 expression profiles in a
cohort of 51 molecularly well-characterized human breast cancer cell lines [19]. The 51 cell lines were grouped into the following types: luminal, luminal-ERBB2+, basal-like, and normal-like (claudin-low). Of the genome
expression profiles obtained by microarray analysis
(all of which are deposited in the Gene Expression Omnibus data repository [GEO: GSE41313]), we compared that of ELK3 between the four breast cancer subgroups. Figure 1A shows that ELK3 expression in basal-like and normal-like/ claudin-low cell lines was higher than that in luminal and luminal-ERBB+ cell lines. Notably, MDA-MB-231 was the top-ranked cell line in terms of high ELK3 expression. Stable shRNA-mediated KD of ELK3 was established in three MDA-MB-231-GFP-Luc cell lines (KD1, KD2, and KD3) (Figure 1B). Immunostaining with a phospho-ELK3 antibody revealed that phospho-phospho-ELK3 localized in the nucleus of control MDA-MB-231 (C1) cells but
not in ELK3 KD cells (Figure 1C). The first feature we
noticed in ELK3 KD cells was a marked increase in the proliferation rate (Figure 1D). Since this suggested that the tumorigenicity of MDA-MB-231 cells was increased by suppression of ELK3, we next examined other parameters linked to breast cancer progression. The critical characteristics of metastatic cancers are mesenchymal cell morphology, high migration and invasive capacity, and loss of adhesion to the underlying basement membrane, which allows invasion into surrounding tissues or the circulatory system. Contrary to our expectations, the three selected ELK3 KD cell lines showed an epithelial phenotype (reduced migration and invasive capacity, and increased adhesion), whereas control cells (C1) retained all the metastatic features of invasive MDA-MB-231 cells (Figure 1E). These results suggest that ELK3 KD has epithelial characteristics and a less invasive phenotype. Microarray analysis revealed that stable suppression of ELK3 in MDA-MB-231 cells led to the downregulation and upregulation of 1,081 and 1,339 genes, respectively (fold change > 4, GSE83325). Taken together, these results suggest that suppressing ELK3 reprograms MDA-MB-231 cells such that they display less invasive, epithelial characteristics.
Suppression of ELK3 in vivo reprograms MDA-MB-231 cells to display a less invasive phenotype
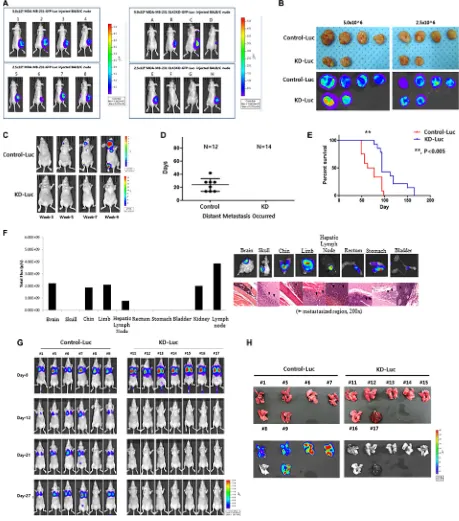
To analyze the tumorigenic and metastatic ability of ELK3 KD in vivo, we transplanted C1 and KD1 cells into the mammary fat pads of non-obese diabetic (NOD)/ SCID mice. As shown in Figure 2A, all eight mice injected with 5 × 10⁶ or 2.5 × 10⁶ C1 cells developed tumors at 3
weeks post-inoculation, whereas only four of eight mice injected with KD1 cells developed tumors (Figure 2A). After injection of 2.5 × 10⁶ or 5.0 × 10⁶ C1 or KD1 cells,
we observed that C1 tumors grew much faster than KD1
tumors (Figure S1). On the day of sacrifice, tumors were removed and measured: C1 tumors were significantly
larger than KD1 tumors (Figure 2B).
whereas none of the mice injected with ELK3 KD did so (Figure 2C and 2D). In the control group, experimental metastases were detected 24 (± 10) days (mean (SD)) after injection. The Kaplan-Meier survival curves for the C1 and KD1 groups revealed that KD1 mice survived longer than C1 mice (Figure 2E). Metastasized C1 cells were
[image:3.612.70.541.183.615.2]confirmed by hematoxylin and eosin (H&E) staining.
Figure 2F showed that C1 cells metastasized to various organs, including the brain, limbs, and stomach.
When C1 and KD1 cells were injected into the tail, C1 cells colonized the lungs in 5/6 mice (83%), whereas 0/7 mice injected with KD1 cells showed lung metastasis (Figure 2G). Lungs from each mouse were carefully dissected, and bioluminescence imaging was performed. Consistent with the earlier data, the lungs from 5/6 (83%) C1 mice showed bioluminescence, whereas 0/7 (0%) lungs from KD1 mice did not (Figure 2H).
Figure 1: ELK3 regulates migration and invasion of MDA-MB-231 cells in vitro. (A) ELK3 expression in 51 breast cancer cell lines (18 luminal, 12 luminal-ERBB2+, nine basal-like, 11 normal-like/claudin-low, and one other) was analyzed. Data were obtained from public Micro Array databases (GEO: GSE41313; [19]) (left panel), and the average for each group was calculated (right panel). (B)
MDA-MB-231 cells were transduced with a retrovirus expressing shRNA specific for ELK3, and three stable cell lines (KD1, KD2, and KD3)
Figure 2: Knockdown of ELK3 expression in MDA-MB-231 cells results in loss of metastatic ability in vivo. (A) Bioluminescence images of mice bearing tumors derived from subcutaneous injection of 2.5 × 10⁶ or 5.0 × 10⁶ Control-Luc or ELK3
KD-Luc cells. (B) Ex vivo bioluminescence images of tumors from all mice in each group. (C) Representative bioluminescence images showing progression of distant metastasis after cardiac injection of Control-Luc and ELK3 KD-Luc. Control-Luc (n = 12 mice; 1.0 × 10⁵
cells per mouse) and ELK3 KD-Luc (n = 14; 1.0 × 10⁵ cells per mouse) were injected into the left ventricle, and bioluminescence images
were taken weekly. (D) Graph demonstrating the total number of mice with distant metastases post-cardiac injection, and the day of metastatic tumor occurrence. (E) Kaplan-Meier survival curves for mice injected with Control-Luc (red line) or ELK3 KD-Luc (blue line) cells. Statistical differences were evaluated using the log-rank test. ** P < 0.005. (F) Quantified bioluminescence image data. Data are
derived from representative ex vivo bioluminescence images of metastasized organs (left panel). Ex vivo bioluminescence images of each organ isolated from the mice. Sections from each mouse organ were stained with hematoxylin and eosin (right panel). (G) Metastasis of Control-Luc and ELK3 KD-Luc cells was analyzed after tail vein injection. Control-Luc (n = 6 mice; 1.0 × 10⁶ cells per mouse) and
ELK3 KD-Luc (n = 7 mice; 1.0 × 10⁶ cells per mouse) cells were injected into the tail vein, and success was confirmed by monitoring
Suppression of ELK3 in MDA-MB-231 cells disrupts the TGF-ß signaling pathway
TGF-ß in the tumor microenvironment primes breast cancer cells to undergo EMT; metastasis to the lungs is particularly common [20–22]. Therefore, we postulated that TGF-ß signaling might not be functional in ELK3 KD cells. To test this, we examined the expression of TGF-ß receptors I and II (TGF-ß RI and RII), which are essential for transmission of the TGF-ß signal into cells. As expected, expression of TGF-ß RI and RII in ELK3 KD was less than 20% of that in control cells (Figure 3A). This suggests that many ELK3 KD cells are incapable of
transmitting TGF-β signals. Indeed, immunoblot analysis
of phospho-Smad2 expression, as well as immunostaining for nuclear localized Smad2 phosphorylation, revealed that Smad2 phosphorylation in ELK3 KD upon TGF-ß
treatment was not significantly higher than that in C1
(Figure 3B). When Smad2 is phosphorylated and localized to the nucleus, it acts as a transcriptional activator that induces expression of EMT-related genes. Consistent with the phosphorylation status of Smad2 in ELK3 KD cells upon TGF-ß treatment, we found that the expression of mesenchymal markers such as Vimentin, Slug, and Snail
in ELK3 KD cells in response to TGF-β was unchanged,
whereas it increased by more than 2-fold in control cells (Figure 3C). Taken together, these data suggest that the TGF-ß signaling pathway is non-functional in ELK3 KD cells, which would explain, at least in part, the mechanism by which suppression of ELK3 deprives MDA-MB-231 cells of their metastatic characteristics.
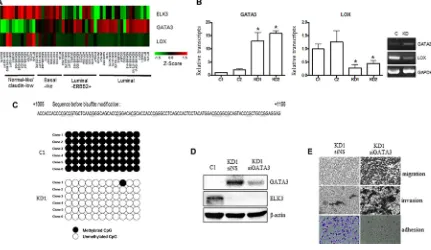
ELK3 indirectly and epigenetically suppresses GATA3 expression
Recent studies report that overexpression of GATA3 in MDA-MB-231 (GATA3 OE) cells reprograms them from a basal to a luminal phenotype, which is characterized by reduced tumorigenesis and metastasis [14, 23, 24]. GATA3 also inhibits TGF-ß-dependent transcriptional responses in MDA-MB-231 cells and promotes MET [25]. In addition, GATA3 inhibits metastasis of MDA-MB-231 cells by suppressing lysyl oxidase (LOX), a metastasis-promoting matrix remodeling protein, via methylation of the LOX promoter [23]. Since the features of ELK3 KD cells were similar to those of GATA3 OE cells, we hypothesized that ELK3 is an upstream regulator of the GATA3-LOX axis in MDA-MB-231 cells. Therefore, we examined expression of ELK3, GATA3, and LOX by constructing a heat map matrix using public microarray data derived from breast cancer cell lines [19]. As expected, the expression of ELK3 was inversely correlated with that of GATA3 and LOX (Figure 4A). Consistent with this, we found that GATA3 expression was low in MDA-MB-231 cells that expressed high levels of ELK3.
We next examined whether GATA3 is indeed overexpressed (and LOX suppressed) in ELK3 KD cells. As expected, expression of GATA3 in ELK3 KD cell lines was high (Figure 4B). However, transient siRNA-mediated suppression of ELK3 expression in MDA-MB-231 cells did not increase GATA3 expression (Figure S2). This indicates that transcription of GATA3 is not directly increased by ELK3. One possible mechanism underlying GATA3 activation in ELK3 KD cells is
epigenetic modification of the promoter. Indeed, bisulfite
sequencing revealed that 11 CpG sequences within the GATA3 promoter were completely demethylated in ELK3 KD cells (Figure 4C). We next examined whether the loss of metastatic features from ELK3 KD cells occurred via activation of GATA3. When overexpression of GATA3 in ELK3 KD cells was suppressed by siRNA
transfection, we observed a significant increase in the
migration and invasion of the cells in a Matrigel assay (Figure 4D and 4E). In addition, the increase in cell adhesion observed upon suppression of ELK3 was reversed by suppressing GATA3 (Figure 4E). Despite
the finding that the proliferation rate of ELK3 KD cells
was higher than that of control cells, changes in the pH of the medium occurred more slowly than in that of control cultures (Figure S3A). Consistent with this, the seahorse XF cell energy phenotype revealed that both the oxygen consumption rate (OCR) and the extracellular
acidification rate (ECAR) increased in ELK3 KD when
compared with control cells (Figure S3B). When GATA3 expression in ELK3 KD was suppressed by siRNA, both OCR and ECAR fell to levels observed in control cells (Figure S3C). Taken together, these data suggest that suppression of ELK3 results in epigenetic activation of the GATA3 promoter to induce GATA3 expression. Thus, overexpression of GATA3 in ELK3 KD cells is the main factor that drives the reprogramming of MDA-MB-231 cells to a non-invasive luminal phenotype.
DISCUSSION
Induction of tumor metastasis is accompanied by dynamic reprogramming of the epigenome, a process that involves changes in DNA methylation and histone
modification. After invading distant organs, metastasized
Figure 3: Knocking down ELK3 in MDA-MB-231 cells renders them unresponsive to TGF-ß. (A) Relative expression of TGFß1, TGFß2, TGFß3, TGFR1, and TGFR2 in C1 and KD1 cells. (B) Phosphorylation and nuclear accumulation of Smad2 in C1 and KD1 cells upon TGF-ß treatment were analyzed by immunoblotting and immunocytochemical staining, respectively. (C) Relative expression of Vimentin, Slug, and Snail (target genes of Smad2) in C1 and KD1 cells treated with TGF-ß. Error bars represent the standard error from three independent experiments, each performed using triplicate samples. *P < 0.05 and **P < 0.01 (Student’s t-test).
Figure 4: GATA3 orchestrates the phenotypic changes induced by suppression of ELK3 in MDA-MB-231 cells. (A)
Expression of ELK3, GATA3, and LOX, as shown on a heat map matrix derived from publicly available microarray data from 18 luminal, 12 luminal-ERBB2+, nine basal-like, 11 normal-like/claudin-low, and one other cell type [19]. (B) Relative expression of GATA3 and LOX in C1, C2, KD1, and KD2 cells. (C) Bisulfite sequencing analysis of the GATA3 promoter in C1 and KD1 cells. Each line reflects
an independent clone. The white and black circles represent unmethylated and methylated CpG dinucleotides, respectively. (D)
SiRNA-mediated suppression of GATA3 expression in KD1 cells. KD1 cells were transfected with a nonspecific siRNA (siNS) or with siRNA
[image:6.612.92.523.371.621.2]and Snail, in ELK3 KD cells were not transcriptionally activated by TGF-ß. ELK3 KD-derived tumors in the xenograft model were smaller than control tumors, despite that the proliferation rate of ELK3 KD cells was higher than that of control MDA-MB-231 in vitro. A possible mechanism underlying the discrepancy between in vitro proliferation and in vivo tumor formation is that ELK3 KD show reduced secretion of proteins that communicate with the microenvironment and drive tumor development.
Indeed, the secretome of ELK3 KD was significantly
different from that of control cells; for example, we noticed that the secretion of angiogenic factors such as VEGF by ELK3 KD was reduced by about ~50% (Figure S4A). In addition, the expression of CD31, a marker of microvessel
formation, was significantly lower in ELK3 KD tumors
compared to control tumor (Figure S4B, S4C). Thus, we speculate that alterations to the ELK3 KD secretome are related to the formation of smaller tumor masses in the xenograft experiments.
The extensive changes in gene expression profile
caused by suppression of ELK3 led us to identify GATA3 as a critical regulator of metastatic changes in ELK3 KD cells. We found that transfecting ELK3 KD cells with siGATA3 restored their migratory and invasive characteristics. Based on these results, we suggest that the ELK3-GATA3 axis is a central and crucial regulatory component of EMT/MET. ELK3 is thought to function as a transcriptional activator in MDA-MB-231 cells, which harbor a highly active RAS/ERK signaling pathway. Overexpression of GATA3 in ELK3 KD cells indicates that GATA3 is not a direct target for ELK3. Demethylation of the GATA3 promoter in ELK3 KD cells suggests that epigenetic factors that promote DNA demethylation are activated in MDA-MB-231 cells upon suppression of ELK3. Indeed, the DNA demethylase, TET1, suppression of which is essential for KRAS-mediated DNA hypermethylation and malignant transformation [29], was highly expressed in ELK3 KD cells, whereas expression of DNMT3A and DNMT3B was similar to that in control cells (Figure S5).
A recent study demonstrated that both OCR, an indicator of oxidative phosphorylation, and ECAR increase in low-invasive cancer cells [30]. Changes in the OCR and ECAR in ELK3 KD and siGATA3-transfected ELK3 KD cells imply that comprehensive metabolic reprogramming in MDA-MB-231 cells is accompanied by expression of ELK3 and GATA3.
Despite our finding that a non-functional TGF-ß
signaling pathway (resulting from suppression of TGF-ß R1/RII) in ELK3 KD cells might contribute to a less metastatic phenotype, transfection of siGATA3 did not rescue the TGF-ß response of ELK3 KD (Figure S6). Thus, it remains unclear whether TGF-ß R1/RII is epigenetically suppressed in ELK3 KD.
The findings described herein indicate that ELK3
may play a previously unrecognized and important role in breast cancer metastasis based on data suggesting
that its loss of function aids reprogramming of basal types of breast cancer cells to a less invasive, epithelial cell phenotype. Suppression of ELK3 in another basal type breast cancer cell line, Hs578T, also accompanied with GATA3 activation as well as reduced migration and invasive capacity in vitro (Figure S7). A recent report shows that ELK3 drives malignancy in SCCs [8], suggesting that the role of ELK3 as a promoter of metastasis is not likely to be limited to breast cancer. Further studies should focus on identifying genes directly targeted by ELK3 and on furthering our understanding of the metastatic mechanisms that it regulates. This may
facilitate identification of effective therapeutic targets.
MATERIALS AND METHODS
Cell culture and knockdown of ELK3 and GATA3
MDA-MB-231-GFP-Luc cells were purchased from Perkin Elmer (Boston, MA, USA) and cultured
in Dulbecco’s Modified Eagle’s Medium (DMEM)
supplemented with 10% fetal bovine serum (FBS) (Gibco BRL). ShRNA plasmids targeting human ELK3 (catalog no. RHS4531-EG2004) or human GATA3 (catalog no. RHS4531-EG2625) were purchased from Dharmacon. ELK3 KD breast cancer cell lines (KD1, KD2, and KD3) and two control (C) cell lines (C1 and C2) were established by infecting MDA-MB-231-GFP-Luc cells with a retrovirus generated from control or shRNA retroviral plasmids containing ELK3 (catalog no. RHS4531-EG2004). Retroviral shRNA targeting GATA3 (catalog no. RHS4531-EG2625) was transfected into ELK3 KD MDA-MB-231 cell lines.
Microarray analysis
Total RNA was extracted using TRIzol (Invitrogen), and biotinylated cRNA were prepared from 0.55 µg of total
RNA using the Illumina TotalPrep RNA Amplification
Kit (Ambion, Austin, TX), according to the manufacturer instructions. Following fragmentation, cRNA (1.5 µg) was hybridized to the Illumina HumanHT-12 v4 Expression BeadChip, according to the manufacturer’s instructions (Illumina). Arrays were then scanned with an Illumina Bead Array Reader Confocal Scanner, according to the manufacturer’s instructions. Array data processing and analysis were performed using Illumina BeadStudio v3.1.3 (Gene Expression Module v3.3.8). The microarray data is deposited in the Gene Expression Omnibus data repository (GEO: GSE83325).
upper well of a Transwell plate (Corning Inc, Corning, NY, USA). The lower portion of the well contained DMEM supplemented with 10% FBS as a chemoattractant. After incubation for 24 h, cells that migrated to the bottom chamber were removed from the underside of the
membrane, fixed in 4% paraformaldehyde (Santa Cruz),
and stained with crystal violet. For the invasion assays, cells (8 × 10⁴) were placed onto a Transwell membrane
coated with 50 ml of Matrigel (BD Biosciences) and then incubated for 36 h. Migrated cells were processed as described above.
RNA extraction and real-time RT-PCR
Total RNA was extracted using TRIzol (Invitrogen),
and 2–5 μg was reverse-transcribed using the
SuperScriptII™ First-Strand Synthesis System (Invitrogen), according to the manufacturer’s instructions. Real-time RT-PCR was performed using the resulting cDNAs and the Quantitect SYBR Green PCR kit (Qiagen). Expression of target genes was normalized against that of glyceraldehyde 3-phosphate dehydrogenase (GAPDH). The PCR primer pairs (sense and antisense) are listed in Table S1.
Western blot analysis
Cells were washed with PBS and lysed in tissue lysis buffer (20 mM Tris-base, pH 7.4, 137 mM NaCl, 2 mM EDTA, 1% Triton X-100, 25 mM
β-glycerophosphate, 2 mM sodium pyrophosphate,
10% glycerol, 1 mM sodium orthovanadate, 1 mM
benzamidine, and 1 mM phenylmethysulfonyl fluoride).
Total cell extracts were resolved by sodium dodecyl sulfate-polyacrylamide gel electrophoresis, transferred to Immobilon-P membranes (Millipore, Bedford, MA, USA; http://www.Millipore.com), and blotted with antibodies against ELK3 (sc-17860), Smad2 (sc-8332, Santa Cruz Biotechnology), phospho-Smad2 (#3101, Cell Signaling Technology), and GATA3 (sc-268, Santa Cruz Biotechnology). Immunoreactivity was detected by enhanced chemiluminescence (ECL; Amersham).
Xenograft mouse model
All animal experiments were approved by the Institutional Animal Care and Use Committee (IACUC) of National Cancer Center. Four-week-old BALB/c nude mice were purchased from Orient Bio. (Republic of Korea) and housed at the experimental animal facility at the National Cancer Center. A tumor xenograft model was established when the mice reached 5 weeks of age. Mice were randomly assigned to four different groups and injected with the following: control-Luc cells (2.5 × 10⁶ or
5.0 × 10⁶) or ELK3 KD-Luc cells (2.5 × 10⁶ or 5.0 × 10⁶).
Tumor size and the weight of the mice were measured
three times per week until the day of sacrifice. For IVIS
imaging, D-Luciferin (Perkin Elmer, USA) was injected (intraperitoneally) into mice using a 1 ml BD Syringe
Leuer-Lok Tip fitted with a 26G 1/2 BD PrecisionGlide
Needle (BD Korea, Republic of Korea). Mice were imaged 8 min later.
In vivo metastasis: cardiac injection model BALB/c nude mice (4 weeks old) were purchased from Orient Bio. For the metastasis model, mice received cells via cardiac injection through the left ventricle. Metastasis was monitored weekly by IVIS Lumina III
XR imaging. On the day of sacrifice, IVIS imaging was
performed before organs were harvested; samples were
then mounted in paraffin blocks. Total flux (p/s) within
each organ was measured using the IVIS Lumina III XR imaging system, and data were analyzed using Living Image 2.60.1 (PerkinElmer, USA) software. This study was reviewed and approved by the IACUC of National Cancer Center Research Institute (NCCRI), Goyang-si, Gyeonggi-do, Republic of Korea. NCCRI is an Association for Assessment and Accreditation of Laboratory Animal Care International (AAALAC International, no. 001392)-accredited facility and abides by the Institute of Laboratory Animal Resources (ILAR) guidelines.
In vivo metastasis: tail vein injection model BALB/c nude mice (4 weeks old) were obtained from Harlan laboratories (DooYeol Biotech, Republic of Korea) and divided into two groups: Control-Luc and ELK3 KD-Luc. Tail vein injection was performed 1 week after the mice reached 5 weeks of age. Cells were injected
into the tail vein using a 1 ml BD syringe fitted with a
31G Ultra-Fine II short needle (BD Korea, Republic of Korea). The success of the tail vein injection was evaluated immediately by IVIS Lumina III XR imaging, and metastasis was monitored weekly. Bodyweight
was measured twice a week until the day of sacrifice
(at 4 weeks post-tail vein injection). Samples were prepared as described above.
Histology
Organs containing metastatic deposits showing luciferase expression were harvested and stabilized in 10% Neutral Buffered Formalin (BBC biochemical, USA).
Sections of paraffin-embedded tissues were stained with
hematoxylin (Merck, USA) and eosin (Merck, USA) and examined under a ScanScope XT virtual digital
slide scanner (Aperio, USA) (magnification, ×200). The magnified slide was visualized using Imagescope software version 11.2.0.782 (Aperio, USA). Sections of
paraffin-embedded organs containing metastatic deposits were
examined by immunofluorescence using a Zeiss AxioImager
Bisulfite pyrosequencing
Bisulfate treatment and DNA cleanup were
performed using the EpiTect 96 Bisulfite Kit, according to the manufacturer’s instructions. Sodium bisulfite-modified genomic DNA from ELK3 KD or control cells was amplified by PCR using primers GATA3-F (5′-GTT GGG TGA GTT ATT ATT ATT T-3′) and GATA3-R (5′-ATT AAA AAA CAC ATC CAC CTC CT-3′). The
PCR products were then cloned into the T-vector (Takara) and sequenced.
Statistical analysis
All statistical analyses were performed using GraphPad Prism 5 (GraphPad Prism, La Jolla, CA, USA). Data were analyzed using Student’s t-test. Differences
were considered statistically significant at P < 0.05.
ACKNOWLEDGMENTS AND FUNDING
This work was supported by the Korea Science and Engineering Foundation of the Korean government (MOST) (2012M3A9C6050367), and by the Priority Research Centers Program through the National Research Foundation of Korea (NRF) funded by the Ministry of Education, Science, and Technology (2015R1A2A2A01003498, 2015M3A9C6028961). This work was also supported by a National Cancer Center Grant (NCC-1210101).CONFLICTS OF INTEREST
The authors have no potential conflicts of interest in
relation to this article.
REFERENCES
1. Valastyan S, Weinberg RA. Tumor metastasis: molecular insights and evolving paradigms. Cell. 2011; 147:275–292. 2. Yang J, Weinberg RA. Epithelial-mesenchymal transition: at
the crossroads of development and tumor metastasis. Dev Cell. 2008; 14:818–829.
3. Scheel C, Weinberg RA. Cancer stem cells and epithelial-mesenchymal transition: concepts and molecular links. Semin Cancer Biol. 2012; 22:396–403.
4. Giovane A, Pintzas A, Maira SM, Sobieszczuk P, Wasylyk B. Net, a new ets transcription factor that is activated by Ras. Genes Dev. 1994; 8:1502–1513.
5. Ducret C, Maira SM, Dierich A, Wasylyk B. The net repressor is regulated by nuclear export in response to anisomycin, UV, and heat shock. Mol Cell Biol. 1999; 19:7076–7087.
6. Ayadi A, Zheng H, Sobieszczuk P, Buchwalter G, Moerman P, Alitalo K, Wasylyk B. Net-targeted mutant
mice develop a vascular phenotype and up-regulate egr-1. EMBO J. 2001; 20:5139–5152.
7. Zheng H, Wasylyk C, Ayadi A, Abecassis J, Schalken JA, Rogatsch H, Wernert N, Maira SM, Multon MC, Wasylyk B. The transcription factor Net regulates the angiogenic switch. Genes Dev. 2003; 17:2283–2297.
8. Yang H, Schramek D, Adam RC, Keyes BE, Wang P, Zheng D, Fuchs E. ETS family transcriptional regulators drive chromatin dynamics and malignancy in squamous cell carcinomas. 2015; Elife 4:e10870
9. Robertson ED, Wasylyk C, Ye T, Jung AC, Wasylyk B. The oncogenic MicroRNA Hsa-miR-155–5p targets the transcription factor ELK3 and links it to the hypoxia response. PLoS One. 2014; 9:e113050.
10. Li B, Ni P, Zhu Q, Cao H, Xu H, Zhang S, Au C, Zhang Y. Growth inhibitory effect of the ternary complex factor Net on human pancreatic carcinoma cell lines. Tohoku J Exp Med. 2008; 216:139–147.
11. Sloan KA, Marquez HA, Li J, Cao Y, Hinds A, O’Hara CJ, Kathuria S, Ramirez MI, Wiliams MC, Kathuria H. Increased PEA3/E1AF and decreased Net/Elk-3, both ETS proteins, characterize human NSCLC progression and regulate caveolin-1 transcription in Calu-1 and NCI-H23 NSCLC cell lines. Carcinogenesis. 2009; 30:1433–1442.
12. Reis-Filho JS, Pusztai L. Gene expression profiling in breast cancer: classification, prognostication, and prediction.
Lancet. 2011; 378:1812–1823.
13. Mehra R, Varambally S, Ding L, Shen R, Sabel MS, Ghosh D,
Chinnaiyan AM, Kleer CG. Identification of GATA3 as a
breast cancer prognostic marker by global gene expression meta-analysis. Cancer Res. 2005; 65:11259–11264.
14. Yan W, Cao QJ, Arenas RB, Bentley B, Shao R. GATA3 inhibits breast cancer metastasis through the reversal of epithelial-mesenchymal transition. J Biol Chem. 2010; 285:14042–14051.
15. Si W, Huang W, Zheng Y, Yang Y, Liu X, Shan L, Zhou X, Wang Y, Su D, Gao J, Yan R, Han X, Li W et al. Dysfunction of the Reciprocal Feedback Loop between GATA3- and ZEB2-Nucleated Repression Programs Contributes to Breast Cancer Metastasis. Cancer Cell. 2015; 27:822–836. 16. Calvo J, Sanchez-Cid L, Munoz M, Lozano JJ, Thomson TM,
Fernandez PL. Infrequent loss of luminal differentiation in ductal breast cancer metastasis. PLoS One. 2013; 8:e78097. 17. Cimino-Mathews A, Subhawong AP, Illei PB, Sharma R,
Halushka MK, Vang R, Fetting JH, Park BH, Argani P. GATA3 expression in breast carcinoma: utility in triple-negative, sarcomatoi d, and metastatic carcinomas. Hum Pathol. 2013; 44:1341–1349.
18. Heo SH, Lee JY, Yang KM, Park KS. ELK3 Expression Correlates With Cell Migration, Invasion, and Membrane Type 1-Matrix Metalloproteinase Expression in MDA-MB-231 Breast Cancer Cells. Gene Expr. 2015; 16:197–203. 19. Riaz M, van Jaarsveld MT, Hollestelle A, Prager-van der
of 51 human breast cancer cell lines reveals subtype and
driver mutation-specific miRNAs. Breast Cancer Res. 2013;
15:R33.
20. Massague J. TGFbeta in Cancer. Cell. 2008; 134:215–230.
21. Wakefield LM, Roberts AB. TGF-beta signaling: positive
and negative effects on tumorigenesis. Curr Opin Genet Dev. 2002; 12:22–29.
22. Padua D, Zhang XH, Wang Q, Nadal C, Gerald WL, Gomis RR, Massague J. TGFbeta primes breast tumors for lung metastasis seeding through angiopoietin-like 4. Cell. 2008; 133:66–77.
23. Chu IM, Michalowski AM, Hoenerhoff M, Szauter KM, Luger D, Sato M, Flanders K, Oshima A, Csiszar K, Green JE. GATA3 inhibits lysyl oxidase-mediated metastases of human basal triple-negative breast cancer cells. Oncogene. 2012; 31:2017–2027.
24. Dydensborg AB, Rose AA, Wilson BJ, Grote D, Paquet M, Giguere V, Siegel PM, Bouchard M. GATA3 inhibits breast cancer growth and pulmonary breast cancer metastasis. Oncogene. 2009; 28:2634–2642.
25. Chu IM, Lai WC, Aprelikova O, El Touny LH, Kouros-Mehr H, Green JE. Expression of GATA3 in MDA-MB-231 triple-negative breast cancer cells induces a growth inhibitory response to TGFss. PLoS One. 2013; 8:e61125.
26. Chaffer CL, Brennan JP, Slavin JL, Blick T, Thompson EW, Williams ED. Mesenchymal-to-epithelial transition facilitates
bladder cancer metastasis: role of fibroblast growth factor
receptor-2. Cancer Res. 2006; 66:11271–11278.
27. Tsai JH, Donaher JL, Murphy DA, Chau S, Yang J. Spatiotemporal regulation of epithelial-mesenchymal transition is essential for squamous cell carcinoma metastasis. Cancer Cell. 2012; 22:725–736.
28. Yu M, Bardia A, Wittner BS, Stott SL, Smas ME, Ting DT, Isakoff SJ, Ciciliano JC, Wells MN, Shah AM, Concannon KF, Donaldson MC, Sequist LV et al. Circulating breast tumor cells exhibit dynamic changes in epithelial and mesenchymal composition. Science. 2013; 339:580–584. 29. Wu BK, Brenner C. Suppression of TET1-dependent
DNA demethylation is essential for KRAS-mediated transformation. Cell Rep. 2014; 9:1827–1840.
30. Yang L, Moss T, Mangala LS, Marini J, Zhao H, Wahlig S, Armaiz-Pena G, Jiang D, Achreja A, Win J, Roopaimoole R, Rodriguez-Aguaya C, Mercado-Uribe I et al. Metabolic shifts toward glutamine regulate tumor growth, invasion and bioenergetics in ovarian cancer. Mol Syst Biol. 2014; 10:728. 31. Humphries MJ. Cell adhesion assays. Mol Biotechnol.