www.impactjournals.com/oncotarget/ Oncotarget, Vol. 7, No. 44
Receptor tyrosine kinase amplified gastric cancer: Clinicopathologic
characteristics and proposed screening algorithm
Cheol Keun Park1, Ji Soo Park2, Hyo Song Kim2, Sun Young Rha2, Woo Jin Hyung3, Jae-Ho Cheong3, Sung Hoon Noh3, Sang Kil Lee4, Yong Chan Lee4, Yong-min Huh5, Hyunki Kim1
1Department of Pathology, Yonsei University College of Medicine, Seoul, Republic of Korea
2Division of Medical Oncology, Yonsei Cancer Center, Department of Internal Medicine, Yonsei University College of Medicine, Seoul, Republic of Korea
3Department of Surgery, Yonsei University College of Medicine, Seoul, Republic of Korea
4Division of Gastroenterology, Department of Internal Medicine, Yonsei University College of Medicine, Seoul, Republic of Korea
5YUMS-KRIBB Medical Convergence Research Institute, Department of Radiology, Yonsei University College of Medicine, Seoul, Republic of Korea
Correspondence to: Hyunki Kim, email: kimhyunki@yuhs.ac
Keywords: gastric cancer, receptor tyrosine kinase, amplification, screening algorithm
Received: June 17, 2016 Accepted: September 17, 2016 Published: September 27, 2016
ABSTRACT
Although targeted therapy for receptor tyrosine kinases (RTKs) of advanced gastric cancers (AGCs) has been in the spotlight, guidelines for the identification of RTK-amplified gastric cancers (RA-GCs) have not been established. In this study, we investigate clinicopathologic characteristics of RA-GCs and propose a screening algorithm for their identification. We performed immunohistochemistry (IHC) for MLH1, MSH2, PMS2, MSH6, key RTKs (EGFR, HER2, MET), and p53, in situ hybridization for Epstein-Barr virus encoding RNA, and silver in situ hybridization (SISH) for EGFR, HER2, and MET using tissue microarrays of 993 AGCs. On IHC, 157 (15.8%) 61, (6.15%), and 85 (8.56%) out of 993 cases scored 2+ or 3+ for EGFR, HER2, and MET, respectively. On SISH, 31.2% (49/157), 80.3% (49/61), and 30.6% (26/85) of 2+ or 3+ cases on IHC showed amplification of the corresponding genes. Of the 993 cases, 104 were classified as RA-GCs. RA-GC status correlated with older age (P < 0.001), differentiated histology (P = 0.001), intestinal or mixed type by Lauren classification (P < 0.001), lymphovascular invasion (P = 0.026), and mutant-pattern of p53 (P < 0.001). The cases were divided into four subgroups using two classification systems, putative molecular
classification and histologic-molecular classification, based on Lauren classification,
IHC, and SISH results. The histologic-molecular classification showed higher sensitivity for identification of RA-GCs and predicted patient prognosis better than the putative
molecular classification. In conclusion, RA-GCs show unique clinicopathologic features.
The proposed algorithm based on histologic-molecular classification can be applied to select candidates for genetic examination and targeted therapy.
INTRODUCTION
Gastric cancer (GC) is one of the most common cancers in the world, especially in East Asian countries such as Korea and Japan [1]. Surgery with pre- or postoperative chemotherapy has been performed as a treatment option for advanced gastric cancers (AGCs). However, the majority of patients show poor prognosis
and there are unmet clinical needs for this dismal disease [2, 3]. In this regard, targeted therapy that interferes with molecules associated with oncogenesis or disease progression represents a promising solution. In human patients with epidermal growth factor receptor 2 (HER2)-overexpressing gastric cancer, combination treatment with trastuzumab, anti-HER2 antibody, and chemotherapy with cisplatin and fluoropyrimidine-based regimens resulted
in longer overall survival than chemotherapy alone [4]. Since this study, several clinical trials that targeted other receptor tyrosine kinases (RTKs) have been performed [5–8]. However, the majority of trials encountered difficult situations due to the rarity of the candidate population. Cases showing amplification of RTK genes only account for a small proportion of total GCs: 5-10% with epidermal growth factor receptor (EGFR), 6-17% with HER2, and 6-12% with MET gene amplification [9–14].
According to The Cancer Genome Atlas (TCGA) research, GCs can be divided into four molecular subgroups: Epstein-Barr virus (EBV) positive, microsatellite instability (MSI), genome stable (GS), and chromosomal instability (CIN) [14]. Interestingly, the majority of GCs that overexpress RTKs belong to the CIN group, and GCs in the CIN group show unique characteristics of a higher rate of p53 mutation and mutual exclusiveness in the amplification of RTK genes [14]. With increasing interest in targeted therapy for GCs, it has become more important to identify cases showing amplification of the target genes associated with the specific therapy. Furthermore, considering the rarity of the candidate patients, it is mandatory to develop an adequate and robust platform that is clinically practicable. However, to our best knowledge, algorithms or guidelines to identify RTK-amplified gastric cancers (RA-GCs) and the CIN subgroup have not been established. In this study, we performed comparative analyses using immunohistochemistry (IHC) and in situ hybridization, which are clinically feasible assay platforms in terms of speed and cost effectiveness, to investigate clinicopathologic characteristics of RA-GCs. On the basis of these results, we propose a screening algorithm for the identification of RA-GCs.
RESULTS
Immunohistochemical profile of AGCs
Expression of mismatch repair (MMR) gene related proteins was evaluated in 990 cases. MMR-deficient GCs were found in 114 cases (11.5%). Simultaneous loss of expression of MLH1 and PMS2 was observed in 101 cases and co-loss of MSH2 and MSH6 was observed in 13 cases.
All 993 cases were evaluated for expression of EGFR, HER2, MET, and p53. The number of cases scored as 0, 1+, 2+, and 3+ respectively was 524 (52.8%), 312 (31.4%), 119 (12.0%), and 38 (3.8%) for EGFR (Figure 1A to 1D); 846 (85.4%), 86 (8.7%), 29 (2.9%), and 32 (3.2%) for HER2 (Figure 1E to 1H); and 726 (73.1%), 182 (18.3%), 67 (6.7%), and 18 (1.8%) for MET (Figure 1I to 1L). Thus, 157 (15.8%), 61 (6.1%), and 85 (8.5%) cases were classified as positive for EGFR, HER2, and MET, respectively. In p53 IHC, 371 (37.4%) and 622 (62.6%) cases were classified as wild-pattern and mutant-pattern, respectively.
Clinicopathologic characteristics according EGFR, HER2 and MET IHC results are summarized in Table 1. EGFR positivity and HER2 positivity were more frequent in older patients (P = 0.003, and 0.013, respectively) and MET expression showed a similar tendency (P= 0.069). Positivity for each of the three RTKs was significant in AGCs with differentiated histology (P < 0.001 for EGFR and HER2; P = 0.032 for MET) and intestinal or mixed type by Lauren classification (P < 0.001 for all). Additionally, EGFR positivity was associated with male sex (P = 0.036), lower third location (P = 0.004), EBV encoding RNA in situ hybridization (EBER-ISH) negativity (P = 0.001), and MMR deficiency (P < 0.001). HER2 positivity was frequently observed in cases with p53 mutant-pattern (P = 0.009). MET positivity was associated with larger tumor size (> 5 cm, P = 0.041), presence of lymphovascular invasion (LVI, P = 0.025), lymph node metastasis (LNM, P = 0.030), and MMR deficiency (P < 0.001).
RTK gene amplification and EBV profile of AGCs
Among 2+ or 3+ cases for each RTK on IHC, 31.2% (49/157 cases), 80.3% (49/61 cases), and 30.6% (26/85 cases) were revealed the amplifications of EGFR, HER2, and MET gene, respectively (Figure 1M to 1Q) on silver
in situ hybridization (SISH). Co-amplification of RTK genes were observed in eighteen cases with following combinations: 7 cases with co-amplification of EGFR
and HER2, 6 cases with co-amplification of EGFR and
MET, 4 cases with co-amplification of HER2 and MET, and one case with co-amplification of all three RTK genes. Evaluation of EBER-ISH was available in 971 out of 993 cases and 61 (6.3%) cases were EBV-positive.
Clinicopathologic characteristics of RA-GCs Of 993 cases, 104 (10.5%) were identified as GCs, including 18 cases showing co-amplification. RA-GCs showed unique clinicopathologic characteristics (Table 2); they were associated with older age (P < 0.001), differentiated histology (P = 0.001), intestinal or mixed type by Lauren classification (P < 0.001), presence of LVI (P = 0.026), and p53 mutant-pattern (P < 0.001). Among the 104 RA-GCs, 18 co-amplified AGCs showed no significant differences in clinicopathologic features compared to 86 RA-GCs without co-amplification (Supplementary Table S1).
Sensitivity for identifying RA-GCs according to classification system
We divided all AGC cases into four subgroups based on two classification systems: putative molecular
the putative molecular classification, the 993 AGCs were composed of the following subgroups: 61 (6.1%) EBV-positive GCs, 114 (11.5%) MMR-deficient GCs, 253 (25.5%) putative GS (pGS) GCs, and 565 (56.9%) putative CIN (pCIN) GCs. The histologic-molecular classification divided the AGCs into the following four subgroups: 61 (6.1%) EBV-positive GCs, 114 (11.5%) MMR-deficient GCs, 143 (14.4%) diffuse-putative GS (D-pGS) GCs, and 675 (68.0%) intestinal-putative CIN (I-pCIN) GCs.
Next, we compared putative molecular classification
[image:3.612.71.547.188.665.2]and histologic-molecular classification to investigate which system was superior for screening out RA-GCs. A correlation between RTK IHC positivity and I-pCIN group of histologic-molecular classification was significant (P < 0.001; Table 3). However, pCIN group of putative molecular classification was not. Both pCIN and I-pCIN groups correlated well with RTK amplification (P = 0.007 and < 0.001, respectively, Table 3). I-pCIN group showed higher sensitivity (87.5%) for identifying RA-GCs than
pCIN group of putative molecular classification (74.0%) (Table 3). Therefore, when mining RTK amplified cases, the histologic-molecular classification was superior to
putativemolecular classification in this study. However, both pCIN and I-pCIN groups showed low specificity to find EGFR, HER2, or MET amplified-GCs (45.1% and 34.3%, respectively, Table 3).
Survival analysis
[image:4.612.64.551.73.579.2]Survival analysis was available for 979 of 993 patients. Kaplan-Meier survival curves showed no significant differences in recurrence-free survival (RFS) and overall survival (OS) depending on RTK expression (Supplementary Figure S1A and S1B for EGFR IHC,
Table 1: Clinicopathologic characteristics of advanced gastric cancers according to the expression status of EGFR, HER2, and MET
Category Variables No. of
cases(n = 993) EGFR HER2 c-MET
Positive
(%) Negative (%) P-value Positive (%) Negative (%) P-value Positive (%) Negative (%) P-value
(n = 157) (n = 836) (n = 61) (n = 932) (n = 85) (n = 908)
Age (years) 58.5 ± 10.7 55.7 ± 12.8 0.003 60.0 ± 10.7 55.9 ± 12.6 0.013 58.5 ± 10.7 55.9 ± 12.7 0.069 Sex Male 647 114 (72.6) 533 (63.8) 0.036 46 (75.4) 601 (64.5) 0.096 61 (71.8) 586 (64.5) 0.192
Female 346 43 (27.4) 303 (36.2) 15 (24.6) 331 (35.5) 24 (28.2) 332 (35.5) Location Lower third 552 104 (66.2) 448 (53.6) 0.004 38 (62.3) 514 (55.2) 0.291 55 (64.7) 497 (54.7) 0.087
Upper and
mid-third 441 53 (33.8) 388 (46.4) 23 (37.7) 418 (44.8) 30 (35.3) 411 (45.3) Size ≤ 5 cm 495 70 (44.6) 425 (50.8) 0.164 31 (50.8) 464 (49.8) 0.896 33 (38.8) 462 (50.9) 0.041
> 5 cm 498 87 (55.4) 411 (49.2) 30 (49.2) 468 (50.2) 52 (61.2) 446 (49.1) Differentiation Differentiated 281 70 (44.6) 211 (25.2) < 0.001 30 (49.2) 251 (26.9) < 0.001 33 (38.8) 248 (27.3) 0.032
Undifferentiated 712 87 (55.4) 625 (74.8) 31 (50.8) 681 (73.1) 52 (61.2) 660 (72.7) Lauren
classification Intestinal or mixed 518 125 (79.6) 393 (47.0) < 0.001 47 (77.0) 471 (50.5) < 0.001 73 (85.9) 445 (49.0) < 0.001 Diffuse 475 32 (20.4) 443 (53.0) 14 (23.0) 461 (49.5) 12 (14.1) 463 (51.0) LVI Absent 704 102 (65.0) 602 (72.0) 0.085 40 (65.6) 664 (71.2) 0.383 51 (60.0) 653 (71.9) 0.025
Present 289 55 (35.0) 234 (28.0) 21 (34.4) 268 (28.8) 34 (40.0) 255 (28.1) LNM Absent 275 44 (28.0) 231 (27.6) 0.919 15 (24.6) 260 (27.9) 0.576 15 (17.6) 260 (28.6) 0.030
Present 718 113 (72.0) 605 (72.4) 46 (75.4) 672 (72.1) 70 (82.4) 648 (71.4) Pathologic T
stage T2 163 26 (16.6) 137 (16.4) 0.012 9 (14.8) 154 (16.5) 0.385 11 (12.9) 152 (16.7) 0.208 T3 358 72 (45.9) 286 (34.2) 27 (44.3) 331 (35.5) 38 (44.7) 320 (35.2) T4 472 59 (37.6) 413 (49.4) 25 (41.0) 447 (48.0) 36 (42.4) 436 (48.0)
p53 IHC Wild-type pattern 371 63 (40.1) 308 (36.8) 0.472 13 (21.3) 358 (38.4) 0.009 30 (35.3) 341 (37.6) 0.726
Mutant pattern 622 94 (59.9) 528 (63.2) 48 (78.7) 574 (61.6) 55 (64.7) 567 (62.4) EBER-ISH * Negative 910 150 (99.3) 760 (92.7) 0.001 60 (98.4) 850 (93.4) 0.170 78 (94.0) 832 (93.7) 0.919
Positive 61 1 (0.7) 60 (7.3) 1 (1.6) 60 (6.6) 5 (6.0) 56 (6.3) MMR protein
IHC** MMR-proficient 876 112 (71.8) 764 (91.6) < 0.001 56 (91.8) 820 (88.3) 0.402 63 (75.0) 813 (89.7) < 0.001 MMR-deficient 114 44 (28.2) 70 (8.4) 5 (8.2) 109 (11.7) 21 (52.0) 93 (10.3) Overall stage II 95 16 (10.2) 79 (9.4) 0.690 5 (8.2) 90 (9.7) 0.931 6 (7.1) 89 (9.8) 0.094
III 307 44 (28.0) 263 (31.5) 19 (31.1) 288 (30.9) 19 (22.4) 288 (31.7) IV 591 97 (61.8) 494 (59.1) 37 (60.7) 554 (59.4) 60 (70.6) 531 (58.5)
LVI: lymphovascular invasion; LNM: lymph node metastasis; IHC: immunohistochemistry; EBER-ISH: Epstein-Barr virus encoding RNA in situ hybridization; MMR protein: mismatch repair gene related protein
C and D for HER2 IHC, and E and F for MET IHC). In addition, the RFS and OS of patients with AGC showing any RTK positivity on IHC did not differ from
[image:5.612.66.555.74.609.2]the remaining groups (Supplementary Figure S1G and S1H). The prognosis of patients with AGC showing amplification of any of the three RTK genes also did
Table 2: Clinicopathologic characteristics of advanced gastric cancers according to gene amplification status of three receptor tyrosine kinases (RTKs)
Category Variables No. of cases
(n = 993) RTK gene amplification* P-value Positive (%) Negative (%)
(n = 104) (n = 889)
Age (years) 60.3 ± 9.7 55.6 ± 12.7 < 0.001
Sex Male 647 76 (73.1) 571 (64.2) 0.073
Female 346 28 (26.9) 319 (35.8)
Location Lower third 552 66 (63.5) 486 (54.7) 0.088 Upper and mid-third 441 38 (36.5) 403 (45.3)
Size ≤ 5 cm 495 52 (50.0) 443 (49.8) 0.974
> 5 cm 498 52 (50.0) 446 (50.2)
Histology Differentiated 281 44 (42.3) 237 (26.7) 0.001 Undifferentiated 712 60 (57.7) 652 (73.3)
Lauren classification Intestinal or mixed 538 90 (86.5) 448 (50.4) < 0.001
Diffuse 455 14 (13.5) 441 (49.6)
LVI Absent 704 64 (61.5) 640 (72.0) 0.026
Present 289 40 (38.5) 249 (28.0)
LNM Absent 275 26 (25.0) 249 (28.0) 0.516
Present 718 78 (75.0) 640 (72.0)
Pathologic T stage T2 163 19 (18.3) 144 (16.2) 0.140
T3 358 45 (43.3) 313 (35.2)
T4 472 40 (38.5) 432 (48.6)
p53 IHC Wild-type pattern 371 22 (21.2) 349 (39.3) < 0.001 Mutant pattern 622 82 (78.8) 540 (60.7)
EBER-ISH** Negative 910 100 (98.0) 810 (93.2) 0.057
Positive 61 2 (2.0) 59 (6.8)
MMR protein
IHC*** MMR-proficient 876 96 (93.2) 780 (87.9) 0.113 MMR-deficient 114 7 (6.8) 107 (12.1)
Overall stage II 95 13 (12.5) 82 (9.2) 0.210
III 307 25 (24.0) 282 (31.7)
IV 591 66 (63.5) 525 (59.1)
LVI: lymphovascular invasion; LNM: lymph node metastasis; IHC: immunohistochemistry; EBV-ISH Epstein-Barr virus encoding RNA in situ hybridization; MMR protein: mismatch repair gene related protein
* Defined as amplification of any of EGFR, HER2 or MET in SISH ** Evaluated in 971 cases
not vary significantly according to amplification status (Supplementary Figure S2A and S2B for EGFR, C and D for HER2, and E and F for MET). In addition, there were no significant differences in RFS and OS between RA-GCs and non-RA-RA-GCs (Supplementary Figure S3A and S3B) and no significant findings were observed in survival analysis after the separation of RTK co-amplified cases (Supplementary Figure S3C and S3D).
In the putative molecular classification, EBV-positive and MMR-deficient subgroups showed longer RFS whereas pGS and pCIN subgroups showed relatively shorter RFS (P = 0.001); however, there was no significant difference in RFS between pGS and pCIN subgroups (P = 0.511, Figure 2A). In contrast, for histologic-molecular classification, in addition to significant differences observed in comparison of entire subgroups (P = 0.001), the I-pCIN subgroup showed a trend toward longer RFS than the D-pGS subgroup (P = 0.069; Figure 2B). In multivariate analysis, D-pGS and I-pCIN subgroups of histologic-molecular classification were worse prognostic factors for RFS (p=0.012, HR 2.07 and p=0.014, HR 1.93, respectively) and OS (p=0.001, HR 2.27 and p=0.002 HR 2.1, respectively) (Table 4).
Overall survival was different among subgroups for both classification systems (P = 0.001 for all; Figure 2C and 2D). However, in multivariate analysis, individual subgroups of putative molecular classification did not
have a prognostic impact on patient survival except for the pGS subgroup whereas the D-pGS and I-pCIN subgroups of histologic-molecular classification were revealed as unfavorable prognostic factors for patient survival (Table 4).
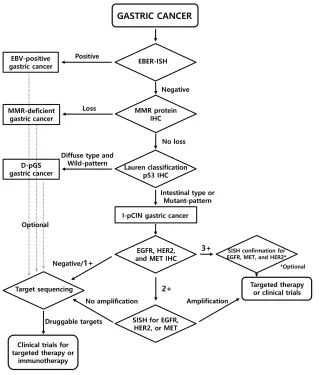
Proposed screening algorithm
On comparison of the two classification systems for IHC, histologic-molecular classification showed higher sensitivity for identifying RA-GCs than putative molecular classification. When considering the significant correlation between RTK IHC positivity and RTK gene amplification (Spearman’s correlation coefficient = 0.576, P < 0.001), it is expected that histologic-molecular classification would identify more RA-GCs than putative molecular classification. Moreover, histologic-molecular classification can predict patient prognosis much better than putative molecular classification. On the basis of these findings, we proposed a screening algorithm for the identification of RA-GCs (Figure 3).
DISCUSSION
Several studies investigating target genes such as
[image:6.612.57.560.62.300.2]EGFR, MET, and fibroblast growth factor receptor (FGFR) have been conducted since the application of trastuzumab in the treatment of HER2-positive gastric cancer patients
Table 3: RTK expression and amplification status according to classification systems Classification
system Subgroup cases(n = 993)No. of RTK IHC RTK SISH Positive
(%) Negative (%) P-value Amplified (%) Not amplified (%) P-value (n = 230) (n = 763) (n = 104) (n = 889)
Putative
molecular EBV-postive 61 5 (2.2) 58 (7.3) 0.003† 2 (1.9) 59 (6.6) 0.009†
MMR-deficient 114 51 (22.2) 63 (8.3) 7 (6.7) 107 (12.0)
pGS 253 47 (20.4) 206 (27.0) 0.208†† 18 (17.3) 235 (26.4) 0.007†† pCIN 565 127 (55.2)* 438 (57.4)** 77 (74.0)* 488 (54.9)**
Histoligic-molecular EBV-postive 61 5 (2.2) 58 (7.3) 0.003† 2 (1.9) 59 (6.6) 0.009†
MMR-deficient 114 51 (22.2) 63 (8.3) 7 (6.7) 107 (12.0)
D-pGS 143 11 (4.8) 132 (17.3) < 0.001†† 4 (3.8) 139 (15.6) < 0.001†† I-pCIN 675 163 (70.9)* 512 (67.1)** 91 (87.5)* 584 (65.7)**
MMR: mismatch repair gene related; pGS: putative genome stable; pCIN: putative chromosome instability; D-pGS: diffuse-putative genome stable; I-pCIN: intestinal-putative chromosome instability
†P-value for the comparison of EBV positive + MMR deficient vs. pGS + pCIN or vs. D-pGS + I-pCIN ††P-value for the comparison of pGS vs. pCIN or D-pGS vs. I-pCIN
*Sensitivity of pCIN and I-pCIN subgroup for the detection of RTK IHC positive case or RTK amplified case.
[11, 15–17]. Based on these studies, several targeted agents that interfere with RTKs have been developed and applied in clinical trials [18–20]. For clinical application and success of clinical trials, it is crucial to select candidates expected to show a response to the targeted agents, in particular, robustly and cost-effectively. The TCGA study [14], which was based on comprehensive molecular analysis, and a study by Cristescu et al. [21], which used transcriptome analysis, categorized GCs into molecular subtypes. RA-GCs were enriched in a subgroup of both of studies: CIN group in the TCGA study and microsatellite stable (MSS)/TP53-positive group in Cristescu et al. [14, 21]. Therefore, these classification approaches can be used to select RTK-amplified candidates. However, several hurdles including quality control, turn-around time, and cost issues can hamper the use of genome- or
transcriptome-wide classification in daily clinical practice. To overcome these obstacles, we sought to develop a screening algorithm based on IHC and EBER-ISH methods that are robust, widely used in most pathology labs, and that also can be applied to formalin-fixed, paraffin-embedded materials. In this IHC-based screening strategy, the availability of reliable and robust antibodies is critical. However, we failed to identify reliable antibodies for HER3 and FGFR2, which are other frequently amplified RTKs in GCs. The amplification of these RTKs can be accessed using fluorescence in situ hybridization [22–25], which can be time-consuming and expensive. In this respect, we evaluated the clinicopathologic characteristics of RA-GCs for three RTKs, EGFR, HER, and MET, and sought to develop a screening algorithm for the detection of a subgroup enriched with RA-GCs.
Figure 2: Comparison of recurrence-free survival and overall survival according to the group classification method.
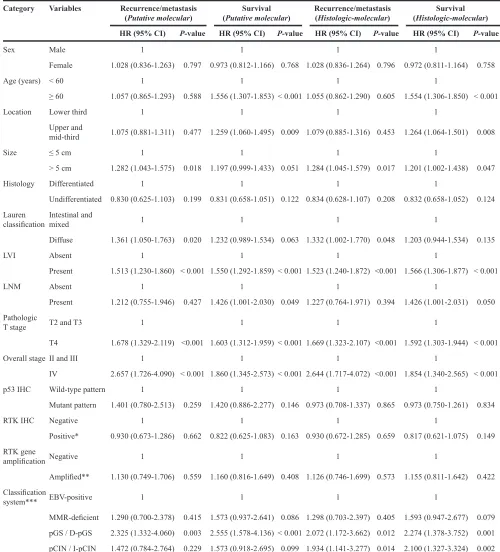
Table 4: Multivariate analysis of the impact of clinicopathologic factors on recurrence/metastasis and survival
Category Variables Recurrence/metastasis
(Putative molecular) (Putative molecular)Survival Recurrence/metastasis(Histologic-molecular) (Histologic-molecular)Survival HR (95% CI) P-value HR (95% CI) P-value HR (95% CI) P-value HR (95% CI) P-value
Sex Male 1 1 1 1
Female 1.028 (0.836-1.263) 0.797 0.973 (0.812-1.166) 0.768 1.028 (0.836-1.264) 0.796 0.972 (0.811-1.164) 0.758
Age (years) < 60 1 1 1 1
≥ 60 1.057 (0.865-1.293) 0.588 1.556 (1.307-1.853) < 0.001 1.055 (0.862-1.290) 0.605 1.554 (1.306-1.850) < 0.001
Location Lower third 1 1 1 1
Upper and
mid-third 1.075 (0.881-1.311) 0.477 1.259 (1.060-1.495) 0.009 1.079 (0.885-1.316) 0.453 1.264 (1.064-1.501) 0.008
Size ≤ 5 cm 1 1 1 1
> 5 cm 1.282 (1.043-1.575) 0.018 1.197 (0.999-1.433) 0.051 1.284 (1.045-1.579) 0.017 1.201 (1.002-1.438) 0.047
Histology Differentiated 1 1 1 1
Undifferentiated 0.830 (0.625-1.103) 0.199 0.831 (0.658-1.051) 0.122 0.834 (0.628-1.107) 0.208 0.832 (0.658-1.052) 0.124 Lauren
classification Intestinal and mixed 1 1 1 1
Diffuse 1.361 (1.050-1.763) 0.020 1.232 (0.989-1.534) 0.063 1.332 (1.002-1.770) 0.048 1.203 (0.944-1.534) 0.135
LVI Absent 1 1 1 1
Present 1.513 (1.230-1.860) < 0.001 1.550 (1.292-1.859) < 0.001 1.523 (1.240-1.872) <0.001 1.566 (1.306-1.877) < 0.001
LNM Absent 1 1 1 1
Present 1.212 (0.755-1.946) 0.427 1.426 (1.001-2.030) 0.049 1.227 (0.764-1.971) 0.394 1.426 (1.001-2.031) 0.050
Pathologic
T stage T2 and T3 1 1 1 1
T4 1.678 (1.329-2.119) <0.001 1.603 (1.312-1.959) < 0.001 1.669 (1.323-2.107) <0.001 1.592 (1.303-1.944) < 0.001
Overall stage II and III 1 1 1 1
IV 2.657 (1.726-4.090) < 0.001 1.860 (1.345-2.573) < 0.001 2.644 (1.717-4.072) <0.001 1.854 (1.340-2.565) < 0.001
p53 IHC Wild-type pattern 1 1 1 1
Mutant pattern 1.401 (0.780-2.513) 0.259 1.420 (0.886-2.277) 0.146 0.973 (0.708-1.337) 0.865 0.973 (0.750-1.261) 0.834
RTK IHC Negative 1 1 1 1
Positive* 0.930 (0.673-1.286) 0.662 0.822 (0.625-1.083) 0.163 0.930 (0.672-1.285) 0.659 0.817 (0.621-1.075) 0.149
RTK gene
amplification Negative 1 1 1 1
Amplified** 1.130 (0.749-1.706) 0.559 1.160 (0.816-1.649) 0.408 1.126 (0.746-1.699) 0.573 1.155 (0.811-1.642) 0.422
Classification
system*** EBV-positive 1 1 1 1
MMR-deficient 1.290 (0.700-2.378) 0.415 1.573 (0.937-2.641) 0.086 1.298 (0.703-2.397) 0.405 1.593 (0.947-2.677) 0.079 pGS / D-pGS 2.325 (1.332-4.060) 0.003 2.555 (1.578-4.136) < 0.001 2.072 (1.172-3.662) 0.012 2.274 (1.378-3.752) 0.001 pCIN / I-pCIN 1.472 (0.784-2.764) 0.229 1.573 (0.918-2.695) 0.099 1.934 (1.141-3.277) 0.014 2.100 (1.327-3.324) 0.002
HR: hazard ratio; CI: confidence interval; LVI: lymphovascular invasion; LNM: lymph node metastasis; RTK: receptor tyrosine kinase; MMR: mismatch repair gene related; pGS: putative genome stable; pCIN: putative chromosome instability; D-pGS: diffuse-putative genome stable; I-pCIN: intestinal-putative chromosome instability
* Defined as 2+ or 3+ for any of EGFR, HER2, or MET by IHC. ** Defined as amplification of any of EGFR, HER2, or MET by SISH.
RA-GCs were associated with intestinal or mixed type by Lauren classification, negativity in EBER-ISH, and MMR-proficient and p53 mutant-pattern in IHC; these features are concordant with the findings of a previous genome-wide study [14]. From these findings, we established a histologic-molecular classification system using Lauren classification and the results of IHC and in situ hybridization. This classification system showed high sensitivity for detecting RA-GCs. Interestingly, overall survival of the subgroups based on histologic-molecular classification were similar to those of MSI, MSS/TP53-positive, and MSS/TP53-negative groups classified by Cristescu et al. [21], except for the EBV-positive subgroup of our study and the MSS/EMT group of the report by Cristescu et al. [21].
Although several studies have reported that overexpression or amplification of RTKs is associated with a poor prognosis [11, 15, 16], we could not find any association with prognosis for EGFR, HER2, and MET overexpression/positivity or amplification and did not observe any difference between RA-GCs and non-RA-GCs in this study. The effects of RTK status on
patient prognosis are presumed to vary depending on the proportion of EBV-positive or D-pGS patients in the study population. Because we found a negative correlation between EGFR positivity and EBV-positive GCs and a tendency of negative correlation between HER2 positivity and EBV positivity (Table 1), the favorable prognosis of EBV-positive GCs might have confounding effects on the survival analysis of GCs with EGFR and HER2 overexpression. That is, if the proportion of EBV-positive GCs increases in one study population, the EGFR or HER2-overexpressing/positive group might be interpreted as showing a worse prognosis. Inversely, as there is a negative relationship between RTK amplification and the D-pGS subgroup (Table 3), if the proportion of the D-pGS group increases, patients with RTK-amplified GC might show a more favorable prognosis. Thus, in the prognostic evaluation of RA-GCs, the influence of EBV-positive and D-pGS subgroups should be considered.
[image:9.612.149.468.330.705.2]Most RA-GCs belonged to the I-pCIN subgroup in histologic-molecular classification. However, there were 13 cases that belonged to other subgroups: two EBV-positive GCs, seven MMR-deficient GCs, and four
D-pGS GCs. These 13 cases consisted of five EGFR -amplified and seven HER2-amplified GCs, and one case with co-amplification of EGFR and MET. The presence of these 13 RA-GCs could be a key limitation of our screening algorithm. Although these patients also could be candidates for RTK-targeted therapy, we believe that our classification approach is still valuable. A recent clinical trial using programmed death 1 blockade, pembrolizumab improved outcomes of MMR-deficient colon cancer patients [26]. EBV-positive GCs have shown frequent amplification of the programmed death ligand 1 (PDL-1) gene and overexpression of PDL-1 in tumor cells [14, 27]. Therefore, we speculate that patients with EBV-positive and MMR-deficient GC might be candidates for immunotherapy using immune checkpoint modulators such as pembrolizumab.
In addition to the presence of EGFR- and HER2 -amplified cases in non I-pCIN subgroups, our classification system showed quite low specificity (32.9% for RTK IHC and 34.2% for RTK gene amplification). This may be due to the presence of other RTKs such as HER3, FGFR1, and FGFR2 and downstream molecules such as PIK3CA or PTEN of the RTK pathway [14]. For these RTKs or targetable molecules, an optional target sequencing strategy using next generation sequencing (NGS) could be considered (Figure 3).
Although HER2 3+ expression on IHC has been accepted as a sufficient indicator for trastuzumab-based chemotherapy, the treatment response and clinical outcomes can be affected by the level of HER2
amplification [28]. Therefore, we included SISH confirmation for HER2 3+ cases as an optional assay in the proposed screening algorithm, which may be informative for predicting response. For EGFR or MET, the concordance between 3+ expression on IHC and gene amplification and the copy number effect on the prediction of response in targeted therapy remain to be elucidated. Therefore, SISH confirmation for MET or
EGFR 3+ cases was included as an essential step in the algorithm. Cases with no overexpression or amplification of EGFR, HER2, and MET in IHC or SISH can be applied to target sequencing to find alterations in other RTKs or RTK-related genes. In this respect, the proposed screening algorithm can provide a stepwise approach for the identification of RTK gene amplification in a clinically feasible and cost-effective way by screening with IHC, validation of equivocal cases by IHC via in situ hybridization, and then target sequencing for negative cases.
Despite the advantages mentioned above, this study has several limitations. First, IHC and SISH of RTKs were performed using tissue microarrays (TMAs), raising the possibility of heterogeneity of RTKs in IHC and SISH [29]. An up to 30% rate of tumor heterogeneity on HER2 IHC has been reported in GCs [30, 31]. At the time of TMA construction, we selected the most representative
area of each case and used two relatively large cores (3 mm) to reduce the limitations related to tumor heterogeneity. Despite this effort, tumor heterogeneity might still influence our results for the three RTKs.
Second, genetic studies for TP53 mutation and MSI status were not performed, so there might be differences between IHC results of p53 and MMR proteins and the results of genetic studies. However, several studies have validated the high accordance rate between IHC and genetic study results for p53 and MMR proteins. In ovarian cancer, p53 IHC showed significant correlation with TP53 mutation status in cases showing complete loss of nuclear expression or strong and diffuse nuclear expression in more than 60% of tumor cells [32]. In colon cancer, the concordance rate between IHC of MMR proteins and PCR-based analysis has been reported to be as high as 98.6% [33–36]. Thus, according to the National Comprehensive Cancer Network guideline for colon cancer, IHC for MMR proteins has been introduced as an alternative method for detecting MSI-H-type colon cancer [37]. In GC, several studies have demonstrated high concordance between these two methods [21, 38, 39]. We also recently validated the high sensitivity and specificity of the IHC approach for MSI detection in GC [40]. Thus, we believe that IHC for p53 and MMR proteins can be a cost-effective modality for the prediction of genetic status in GC.
In conclusion, RA-GCs showed unique clinico pathologic characteristics: occurrence in older patients, differentiated histology, intestinal or mixed type by Lauren classification, presence of LVI, and p53 mutant-pattern.
Histologic-molecular classification based on histologic type, IHC, and EBER-ISH profiles showed 87.5% sensitivity for the identification of RA-GCs. According to the proposed screening algorithm based on histologic-molecular classification, RA-GCs can be identified in a cost-effective way. The positively screened cases might be candidates for clinical trials for the development of new targeted therapies; the negatively screened ones can be the candidates for the investigation of novel RTK genes through additional studies such as NGS.
MATERIALS AND METHODS
Case selection and tissue microarray construction
record review. RFS time was calculated from the date of curative resection to the date of the first locoregional or systemic recurrence, or death without any type of relapse. OS time was calculated from the date of curative resection to the date of the last follow-up or death from any cause.
Several pathologic factors, including tumor histology, tumor type by Lauren classification, LVI, perineural invasion, and pathologic TNM staging according to the 7th American Joint Committee on Cancer criteria were obtained from the slide review by two individual pathologists (C. K. Park and H. Kim). Tumor histology was classified as differentiated and undifferentiated based on Japanese gastric cancer treatment guidelines 2010 [41]. Two cores were extracted from a representative tumor area of each case for TMA construction as previously described [40, 42]. For the evaluation of gene amplification via SISH, separate TMAs were constructed for cases showing 2+ or 3+ EGFR, HER2 and MET expression on IHC.
Immunohistochemistry and evaluation
[image:11.612.57.561.543.699.2]Four-micrometer tissue sections from TMA recipient blocks were used for IHC. IHC was performed using the Ventana Discovery XT automated staining system (Ventana Medical Systems, Inc., Tucson, AZ, USA) with primary antibodies (Table 5) as previously described [40, 42].
Immunostained slides were evaluated by two individual pathologists (C. K. Park and H. Kim) and results were interpreted as follows: cases showing complete loss of MLH1/ PMS2 or MSH2/MSH6 in tumor cells were regarded as MMR-deficient and all other cases were considered MMR-proficient. For p53, cases were classified as p53 mutant-pattern (cases with complete loss of expression or strong nuclear expression in more than 50% of tumor cells) and p53 wild-pattern (all other cases). Expression of EGFR, HER2, and MET was scored according to Hofmann’s criteria [30]. Cases scored as 2+ or 3+ were considered positive.
In situ hybridization and evaluation
SISH was performed on cases scored as 2+ or 3+ in IHC for EGFR, HER2, and MET using the Ventana Benchmark XT (Ventana Medical Systems, Inc.) as previously described [12, 27]. In brief, INFORM EGFR, HER2, and MET DNA Probe (Ventana Medical Systems, Inc.) and INFORM Chromosome 7 and 17 Probe (Ventana Medical Systems, Inc.) were visualized on the same slides according to the manufacturer’s protocols. EBER-ISH was performed in all cases as previously described [42]. As previously described, cases showing diffuse strong positivity in the nuclei of all tumor cells were defined as EBER-ISH-positive [43].
SISH slides were reviewed by two individual pathologists (C. K. Park and H. Kim) and RTK gene signals were counted in at least 60 tumor cells per TMA core using a light microscope with ×40 objective. In some tumor cells, clusters of signals showing many copies of RTK genes were identified. According to the interpretation guide for Ventana INFORM HER2 DNA probe (Ventana Medical Systems, Inc.), small clusters were counted as 6 signals and large clusters as 12 signals. Gene-to-chromosome ratio and copy numbers per nuclei of each RTK gene were calculated. A gene-to-chromosome ratio greater than 2.0 was considered amplification. Cases showing amplification of any RTK genes in SISH were classified as RA-GCs.
Subgrouping of AGCs
All AGCs were divided into four subgroups using two classification systems. First, all cases were classified by putative molecular classification based on findings of the TCGA study [14]. Each subgroup was defined as follows: (1) EBV-positive: EBER-ISH positive; (2) MMR-deficient: EBER-ISH negative and MMR-deficient; (3) pGS: EBER-ISH negative, MMR-proficient and p53 wild-pattern: and (4) pCIN: EBER-ISH negative,
Table 5: Antibodies used for immunohistochemical staining
Antibody Source Clone Dilution
MLH1 Roche, Basel, Switzerland M1 Ready to use
MSH2 Roche, Basel, Switzerland G219-1129 Ready to use
MSH6 Cell Marque, Rocklin, CA, USA 44 1:100
PMS2 Cell Marque, Rocklin, CA, USA MRQ28 1:40
p53 Novocastra, Newcastle, UK DO7 1:300
MMR-proficient and p53 mutant-pattern. In addition, we classified all cases into another four subgroups based on Lauren classification, MMR proteins and p53 IHC results, and EBER-ISH result. These four subgroups were defined as follows: (1) EBV-positive: EBER-ISH positive; (2) MMR-deficient: EBER-EBER-ISH negative and MMR-deficient; (3) D-pGS: EBER-ISH negative, MMR-proficient, p53 wild-type pattern, and diffuse type by Lauren classification; and (4) I-pCIN (p53 mutant-pattern): EBER-ISH negative, MMR-proficient, and p53 mutant-pattern with regardless of histologic type by Lauren classification, and I-pCIN (p53 wild-pattern): EBER-ISH negative, MMR-proficient, p53 wild-pattern and intestinal or mixed type by Lauren classification. We designated this system histologic-molecular classification.
Statistical analysis
Statistical calculation was performed with SPSS version 21.0 (IBM, Chicago, IL, USA). Cross-table analysis (chi-square test) or Fisher’s exact test was used to evaluate the relationship between IHC/SISH results and variable clinicopathologic factors. For the comparison of patient age, the student’s t test was used. RFS and OS were estimated by the Kaplan-Meier method with log-rank test. Multivariate regression was analyzed using the Cox proportional hazards model. Significance statements refer to P-values of two-tailed tests < 0.05.
CONFLICTS OF INTEREST
The authors have no conflicts of interest to declare.
GRANT SUPPORT
This research was supported by the Basic Science Research Program through the National Research Foundation of Korea (NRF) and was funded by the Ministry of Science, ICT and Future Planning (Hyunki Kim; 2012R1A1A1004403) and the Bio & Medical Technology Development Program of the NRF funded by the Ministry of Science, ICT & Future Planning (Yong-min Huh; NRF-2015M3A9D7029878).
REFERENCES
1. Ferlay J, Soerjomataram I, Dikshit R, Eser S, Mathers C, Rebelo M, Parkin DM, Forman D, Bray F. Cancer incidence and mortality worldwide: sources, methods and major patterns in GLOBOCAN 2012. Int J Cancer. 2015; 136:E359-386.
2. Park SC, Chun HJ. Chemotherapy for advanced gastric cancer: review and update of current practices. Gut Liver. 2013; 7:385-393.
3. Price TJ, Shapiro JD, Segelov E, Karapetis CS, Pavlakis N, Van Cutsem E, Shah MA, Kang YK, Tebbutt NC.
Management of advanced gastric cancer. Expert Rev Gastroenterol Hepatol. 2012; 6:199-208; quiz 209.
4. Bang YJ, Van Cutsem E, Feyereislova A, Chung HC, Shen L, Sawaki A, Lordick F, Ohtsu A, Omuro Y, Satoh T, Aprile G, Kulikov E, Hill J, Lehle M, Ruschoff J, Kang YK. Trastuzumab in combination with chemotherapy versus chemotherapy alone for treatment of HER2-positive advanced gastric or gastro-oesophageal junction cancer (ToGA): a phase 3, open-label, randomised controlled trial. Lancet. 2010; 376:687-697.
5. Kataoka Y, Mukohara T, Tomioka H, Funakoshi Y, Kiyota N, Fujiwara Y, Yashiro M, Hirakawa K, Hirai M, Minami H. Foretinib (GSK1363089), a multi-kinase inhibitor of MET and VEGFRs, inhibits growth of gastric cancer cell lines by blocking inter-receptor tyrosine kinase networks. Invest New Drugs. 2012; 30:1352-1360.
6. Wong H, Yau T. Molecular targeted therapies in advanced gastric cancer: does tumor histology matter? Therap Adv Gastroenterol. 2013; 6:15-31.
7. Satoh T, Xu RH, Chung HC, Sun GP, Doi T, Xu JM, Tsuji A, Omuro Y, Li J, Wang JW, Miwa H, Qin SK, Chung IJ, Yeh KH, Feng JF, Mukaiyama A, Kobayashi M, Ohtsu A, Bang YJ. Lapatinib plus paclitaxel versus paclitaxel alone in the second-line treatment of HER2-amplified advanced gastric cancer in Asian populations: TyTAN--a randomized, phase III study. J Clin Oncol. 2014; 32:2039-2049. 8. Satoh T, Lee KH, Rha SY, Sasaki Y, Park SH, Komatsu
Y, Yasui H, Kim TY, Yamaguchi K, Fuse N, Yamada Y, Ura T, Kim SY, Munakata M, Saitoh S, Nishio K, Morita S, Yamamoto E, Zhang Q, Kim JM, Kim YH, Sakata Y. Randomized phase II trial of nimotuzumab plus irinotecan versus irinotecan alone as second-line therapy for patients with advanced gastric cancer. Gastric Cancer. 2015; 18:824-832.
9. Hedner C, Borg D, Nodin B, Karnevi E, Jirstrom K, Eberhard J. Expression and Prognostic Significance of Human Epidermal Growth Factor Receptors 1 and 3 in Gastric and Esophageal Adenocarcinoma. PLoS One. 2016; 11:e0148101. 10. Liu YJ, Shen D, Yin X, Gavine P, Zhang T, Su X, Zhan P,
Xu Y, Lv J, Qian J, Liu C, Sun Y, Qian Z, Zhang J, Gu Y, Ni X. HER2, MET and FGFR2 oncogenic driver alterations define distinct molecular segments for targeted therapies in gastric carcinoma. Br J Cancer. 2014; 110:1169-1178. 11. Ha SY, Lee J, Jang J, Hong JY, Do IG, Park SH, Park JO,
Choi MG, Sohn TS, Bae JM, Kim S, Kim M, Kim S, Park CK, Kang WK, Kim KM. HER2-positive gastric cancer with concomitant MET and/or EGFR overexpression: a distinct subset of patients for dual inhibition therapy. Int J Cancer. 2015; 136:1629-1635.
13. Kim JW, Im SA, Kim M, Cha Y, Lee KH, Keam B, Kim MA, Han SW, Oh DY, Kim TY, Kim WH, Bang YJ. The prognostic significance of HER2 positivity for advanced gastric cancer patients undergoing first-line modified FOLFOX-6 regimen. Anticancer Res. 2012; 32:1547-1553.
14. The Cancer Genome Atlas Research N. Comprehensive molecular characterization of gastric adenocarcinoma. Nature. 2014; 513:202-209.
15. Betts G, Valentine H, Pritchard S, Swindell R, Williams V, Morgan S, Griffiths EA, Welch I, West C, Womack C. FGFR2, HER2 and cMet in gastric adenocarcinoma: detection, prognostic significance and assessment of downstream pathway activation. Virchows Arch. 2014; 464:145-156.
16. Fuse N, Kuboki Y, Kuwata T, Nishina T, Kadowaki S, Shinozaki E, Machida N, Yuki S, Ooki A, Kajiura S, Kimura T, Yamanaka T, Shitara K, Nagatsuma AK, Yoshino T, Ochiai A, Ohtsu A. Prognostic impact of HER2, EGFR, and c-MET status on overall survival of advanced gastric cancer patients. Gastric Cancer. 2016; 19:183-191. 17. Das K, Gunasegaran B, Tan IB, Deng N, Lim KH, Tan
P. Mutually exclusive FGFR2, HER2, and KRAS gene amplifications in gastric cancer revealed by multicolour FISH. Cancer Lett. 2014; 353:167-175.
18. Zhu M, Tang R, Doshi S, Oliner KS, Dubey S, Jiang Y, Donehower RC, Iveson T, Loh EY, Zhang Y. Exposure-response analysis of rilotumumab in gastric cancer: the role of tumour MET expression. Br J Cancer. 2015; 112:429-437.
19. Waddell T, Chau I, Cunningham D, Gonzalez D, Okines AF, Okines C, Wotherspoon A, Saffery C, Middleton G, Wadsley J, Ferry D, Mansoor W, Crosby T, Coxon F, Smith D, Waters J, Iveson T, Falk S, Slater S, Peckitt C, Barbachano Y. Epirubicin, oxaliplatin, and capecitabine with or without panitumumab for patients with previously untreated advanced oesophagogastric cancer (REAL3): a randomised, open-label phase 3 trial. Lancet Oncol. 2013; 14:481-489.
20. Thiel A, Ristimaki A. Targeted therapy in gastric cancer. Apmis. 2015; 123:365-372.
21. Cristescu R, Lee J, Nebozhyn M, Kim KM, Ting JC, Wong SS, Liu J, Yue YG, Wang J, Yu K, Ye XS, Do IG, Liu S, Gong L, Fu J, Jin JG, Choi MG, Sohn TS, Lee JH, Bae JM, Kim ST, Park SH, Sohn I, Jung SH, Tan P, Chen R, Hardwick J, Kang WK, Ayers M, Hongyue D, Reinhard C, Loboda A, Kim S, Aggarwal A. Molecular analysis of gastric cancer identifies subtypes associated with distinct clinical outcomes. Nat Med. 2015; 21:449-456.
22. Kawamoto T, Ishige K, Thomas M, Yamashita-Kashima Y, Shu S, Ishikura N, Ariizumi S, Yamamoto M, Kurosaki K, Shoda J. Overexpression and gene amplification of EGFR, HER2, and HER3 in biliary tract carcinomas, and the possibility for therapy with the HER2-targeting antibody pertuzumab. J Gastroenterol. 2015; 50:467-479.
23. Weng WH, Chen YT, Yu KJ, Chang YH, Chuang CK, Pang ST. Genetic alterations of HER genes in chromophobe renal cell carcinoma. Oncol Lett. 2016; 11:2111-2116.
24. Shoji H, Yamada Y, Okita N, Takashima A, Honma Y, Iwasa S, Kato K, Hamaguchi T, Shimada Y. Amplification of FGFR2 Gene in Patients with Advanced Gastric Cancer Receiving Chemotherapy: Prevalence and Prognostic Significance. Anticancer Res. 2015; 35:5055-5061.
25. Ye P, Zhang M, Fan S, Zhang T, Fu H, Su X, Gavine PR, Liu Q, Yin X. Intra-Tumoral Heterogeneity of HER2, FGFR2, cMET and ATM in Gastric Cancer: Optimizing Personalized Healthcare through Innovative Pathological and Statistical Analysis. PLoS One. 2015; 10:e0143207. 26. Le DT, Uram JN, Wang H, Bartlett BR, Kemberling H, Eyring
AD, Skora AD, Luber BS, Azad NS, Laheru D, Biedrzycki B, Donehower RC, Zaheer A, Fisher GA, Crocenzi TS, Lee JJ, Duffy SM, Goldberg RM, de la Chapelle A, Koshiji M, Bhaijee F, Huebner T, Hruban RH, Wood LD, Cuka N, Pardoll DM, Papadopoulos N, Kinzler KW, Zhou S, Cornish TC, Taube JM, Anders RA, Eshleman JR, Vogelstein B, Diaz LA, Jr. PD-1 Blockade in Tumors with Mismatch-Repair Deficiency. N Engl J Med. 2015; 372:2509-2520.
27. Derks S, Liao X, Chiaravalli AM, Xu X, Camargo MC, Solcia E, Sessa F, Fleitas T, Freeman GJ, Rodig SJ, Rabkin CS, Bass AJ. Abundant PD-L1 expression in Epstein-Barr Virus-infected gastric cancers. Oncotarget. 2016; 7:32925-32. doi: 10.18632/oncotarget.9076.
28. Gomez-Martin C, Plaza JC, Pazo-Cid R, Salud A, Pons F, Fonseca P, Leon A, Alsina M, Visa L, Rivera F, Galan MC, Del Valle E, Vilardell F, Iglesias M, Fernandez S, Landolfi S, Cuatrecasas M, Mayorga M, Jose Paules M, Sanz-Moncasi P, Montagut C, Garralda E, Rojo F, Hidalgo M, Lopez-Rios F. Level of HER2 gene amplification predicts response and overall survival in HER2-positive advanced gastric cancer treated with trastuzumab. J Clin Oncol. 2013; 31:4445-4452.
29. Ruschoff J, Hanna W, Bilous M, Hofmann M, Osamura RY, Penault-Llorca F, van de Vijver M, Viale G. HER2 testing in gastric cancer: a practical approach. Mod Pathol. 2012; 25:637-650.
30. Hofmann M, Stoss O, Shi D, Buttner R, van de Vijver M, Kim W, Ochiai A, Ruschoff J, Henkel T. Assessment of a HER2 scoring system for gastric cancer: results from a validation study. Histopathology. 2008; 52:797-805. 31. Ruschoff J, Nagelmeier I, Baretton G, Dietel M, Hofler
H, Schildhaus HU, Buttner R, Schlake W, Stoss O, Kreipe HH. [Her2 testing in gastric cancer. What is different in comparison to breast cancer?]. Pathologe. 2010; 31:208-217.
33. Yuan L, Chi Y, Chen W, Chen X, Wei P, Sheng W, Zhou X, Shi D. Immunohistochemistry and microsatellite instability analysis in molecular subtyping of colorectal carcinoma based on mismatch repair competency. Int J Clin Exp Med. 2015; 8:20988-21000.
34. Chaves P, Cruz C, Lage P, Claro I, Cravo M, Leitao CN, Soares J. Immunohistochemical detection of mismatch repair gene proteins as a useful tool for the identification of colorectal carcinoma with the mutator phenotype. J Pathol. 2000; 191:355-360.
35. Lindor NM, Burgart LJ, Leontovich O, Goldberg RM, Cunningham JM, Sargent DJ, Walsh-Vockley C, Petersen GM, Walsh MD, Leggett BA, Young JP, Barker MA, Jass JR, Hopper J, Gallinger S, Bapat B, Redston M, Thibodeau SN. Immunohistochemistry versus microsatellite instability testing in phenotyping colorectal tumors. J Clin Oncol. 2002; 20:1043-1048.
36. Jourdan F, Sebbagh N, Comperat E, Mourra N, Flahault A, Olschwang S, Duval A, Hamelin R, Flejou JF. Tissue microarray technology: validation in colorectal carcinoma and analysis of p53, hMLH1, and hMSH2 immunohistochemical expression. Virchows Arch. 2003; 443:115-121.
37. Benson AB, 3rd, Venook AP, Bekaii-Saab T, Chan E, Chen YJ, Cooper HS, Engstrom PF, Enzinger PC, Fenton MJ, Fuchs CS, Grem JL, Hunt S, Kamel A, Leong LA, Lin E, Messersmith W, Mulcahy MF, Murphy JD, Nurkin S, Rohren E, Ryan DP, Saltz L, Sharma S, Shibata D, Skibber JM, Sofocleous CT, Stoffel EM, Stotsky-Himelfarb E, Willett CG, Gregory KM, Freedman-Cass DA. Colon cancer, version 3.2014. J Natl Compr Canc Netw. 2014; 12:1028-1059.
38. Beghelli S, de Manzoni G, Barbi S, Tomezzoli A, Roviello F, Di Gregorio C, Vindigni C, Bortesi L, Parisi A, Saragoni L, Scarpa A, Moore PS. Microsatellite instability in gastric cancer is associated with better prognosis in only stage II cancers. Surgery. 2006; 139:347-356.
39. Seo HM, Chang YS, Joo SH, Kim YW, Park YK, Hong SW, Lee SH. Clinicopathologic characteristics and outcomes of gastric cancers with the MSI-H phenotype. J Surg Oncol. 2009; 99:143-147.
40. Jung da H, Bae YS, Yoon SO, Lee YC, Kim H, Noh SH, Park H, Choi SH, Kim JH, Kim H. Poorly Differentiated Carcinoma Component in Submucosal Layer Should be Considered as an Additional Criterion for Curative Endoscopic Resection of Early Gastric Cancer. Ann Surg Oncol. 2015; 22:S772-777.
41. Japanese Gastric Cancer A. Japanese gastric cancer treatment guidelines 2010 (ver. 3). Gastric Cancer. 2011; 14:113-123.
42. Park JH, Kim EK, Kim YH, Kim JH, Bae YS, Lee YC, Cheong JH, Noh SH, Kim H. Epstein-Barr virus positivity, not mismatch repair-deficiency, is a favorable risk factor for lymph node metastasis in submucosa-invasive early gastric cancer. Gastric Cancer. 2015. doi:10.1007/ s10120-015-0565-1.