Copyright © 2003, American Society for Microbiology. All Rights Reserved.
Cell Wall Thickening Is a Common Feature of Vancomycin Resistance
in
Staphylococcus aureus
Longzhu Cui,
1Xiaoxue Ma,
1Katsuhiro Sato,
2Keiko Okuma,
1Fred C. Tenover,
3Elsa M. Mamizuka,
4Curtis G. Gemmell,
5Mi-Na Kim,
6Marie-Cecile Ploy,
7N. El Solh,
8Vivian Ferraz,
9and Keiichi Hiramatsu
1*
Department of Bacteriology1and Electron Microscopy Center,2Faculty of Medicine, Juntendo University, Bunkyo-ku, Tokyo
113-8421, Japan; Division of Health Care Quality Promotion, Centers for Disease Control and Prevention, Atlanta, Georgia3; School
of Pharmaceutical Sciences, University of Sa˜o Paulo, Sa˜o Paulo, Brazil4; Department of Bacteriology, Medical School, University
of Glasgow Royal Infirmary, Glasgow, United Kingdom5; Department of Clinical Pathology, University of Ulsan College of
Medicine and Asan Medical Center, Seoul, Korea6; Department de Bacteriology, Virology, Hygiene, CHU Dupuytren, 87042
Limoges,7and French National Reference Centre for Staphylococci, Unite of Staphylocoques, Institute Pasteur,
75724 Paris Cedex 15,8France; and Department of Clinical Microbiology and Infectious Diseases,
South African Institute for Medical Research and University of the Witwatersrand, Johannesburg, South Africa9
Received 17 May 2002/Returned for modification 21 June 2002/Accepted 10 October 2002
We have previously shown that a thickened cell wall is responsible for the vancomycin resistance of
vancomycin-resistant Staphylococcus aureus (VRSA) (equivalent to vancomycin-intermediate S. aureus and
glycopeptide-intermediateS. aureus) strain Mu50 (L. Cui, H. Murakami, K. Kuwahara-Arai, H. Hanaki, and
K. Hiramatsu, Antimicrob. Agents Chemother. 44:2276-2285, 2000). However, the mechanism of vancomycin resistance in other VRSA strains remained unclear. In this study, 16 clinical VRSA strains from seven countries were subjected to serial daily passage in drug-free medium. After 10 to 84 days of passage in the nonselective medium, passage-derived strains with decreased MICs of vancomycin (MIC, <4 mg/liter) were obtained. However, all of the passage-derived strains except one (15 of 16) still possessed subpopulations that were resistant to vancomycin as judged by population analysis, and vancomycin-resistant mutant strains were
selected from the passage-derived strains by one-step vancomycin selection with a frequency of 4.25ⴛ10ⴚ6to
1.64ⴛ10ⴚ3. The data indicated that vancomycin-resistant cells are frequently generated from the
passage-derived strains even after vancomycin selective pressure is lifted. Cell wall thicknesses and MICs of glycopep-tides (vancomycin and teicoplanin) and beta-lactams (imipenem and oxacillin) were determined for a total of 48 strains, including 15 sets of three strains: the clinical VRSA strain, the passage-derived strain, and the vancomycin-resistant mutant strain obtained from the passage-derived strain. No simple correlation between glycopeptide and beta-lactam MICs was seen, while significant correlations between MICs of vancomycin and
teicoplanin (rⴝ0.679;P< 0.001) and between MICs of imipenem and oxacillin (rⴝ0.787;P< 0.001) were
recognized. Moreover, all of the VRSA strains had significantly thickened cell walls, which became thinner with the loss of vancomycin resistance during drug-free passages and again became thick in the resistant mutant strains. The data showed that cell wall thickness had high correlation with the MICs of the two glycopeptides (correlation coefficients, 0.908 for vancomycin and 0.655 for teicoplanin) but not with those of the beta-lactam antibiotics tested. These results together with coupled changes of cell wall thickness and vancomycin MICs in 16 isogenic sets of strains indicate that thickening of the cell wall is a common phenotype of clinical VRSA
strains and may be a phenotypic determinant for vancomycin resistance inS. aureus.
Since the first isolation of vancomycin-resistant Staphylococ-cus aureus (VRSA) (MIC⫽ 8 g/ml) in Japan in 1997 (K. Hiramatsu, H. Hanaki, T. Ino, K. Yabuta, T. Oguri, and F. C. Tenover, Letter, J. Antimicrob. Chemother.40:135-136, 1997), several methicillin-resistant S. aureus (MRSA) strains with similar levels of vancomycin resistance have been isolated in other countries (3, 5, 7, 10, 18–21, 25, 26, 33; M. C. Ploy, C. Grelaud, C. Martin, L. de Lumley, and F. Denis, Letter, Lancet
351:1212, 1998). The term VRSA is based on the vancomycin breakpoint of the British Society for Chemotherapy, where a strain for which the MIC is 8 mg/liter is defined as resistant.
Since the same MIC is defined as indicating intermediate sus-ceptibility by the NCCLS, these VRSA strains are called van-comycin-intermediate S. aureus or glycopeptide-intermediate
S. aureusin the United States (31).
Mu50 and its putative precursor strain Mu3, designated het-ero-VRSA (16), have increased cell wall synthesis. When com-pared with vancomycin-susceptible control strains, they have enhanced incorporation of N-acetylglucosamine (GlcNAc) into the cell wall, an increased pool size of the cytoplasmic murein monomer precursor (UDP-N -acetylmuramyl-penta-peptide), an increased cell wall turnover rate as measured by the release of radiolabeled cell wall materials, and increased production of penicillin-binding proteins 2 and 2⬘(11, 12, 14, 17). In addition to these common features with hetero-VRSA strain Mu3, VRSA strain Mu50 displays about a twofold in-crease in cell wall thickness, slower release of cell wall
mate-* Corresponding author. Mailing address: Department of Bacteriol-ogy, Faculty of Medicine, Juntendo University, 2-1-1 Hongo, Bunkyo-ku, Tokyo 113-8421, Japan. Phone: (03)-5802-1041. Fax: (03)-5684-7830. E-mail: hiram@med.juntendo.ac.jp.
5
on May 15, 2020 by guest
http://jcm.asm.org/
rial, and an increased proportion of glutamine-nonamidated muropeptides in its cell wall (11, 12). Subsequent investigation on isogenic cells with different cell wall thickness prepared from single colony of Mu50 cell demonstrated that the thick-ening of the cell wall is the major contribution to the vanco-mycin resistance of Mu50 (6). Furthermore, factors such as increased synthesis of nonamidated muropeptides and result-ant reduced peptidoglycan cross-linking are additional contrib-utors to vancomycin resistance of Mu50 through their enhanc-ing of the affinity trappenhanc-ing of vancomycin (6). In the present study, a total of 16 clinical VRSA strains were examined to test whether increasing cell wall thickness is the common pheno-typic determinant of vancomycin resistance inS. aureus.
MATERIALS AND METHODS
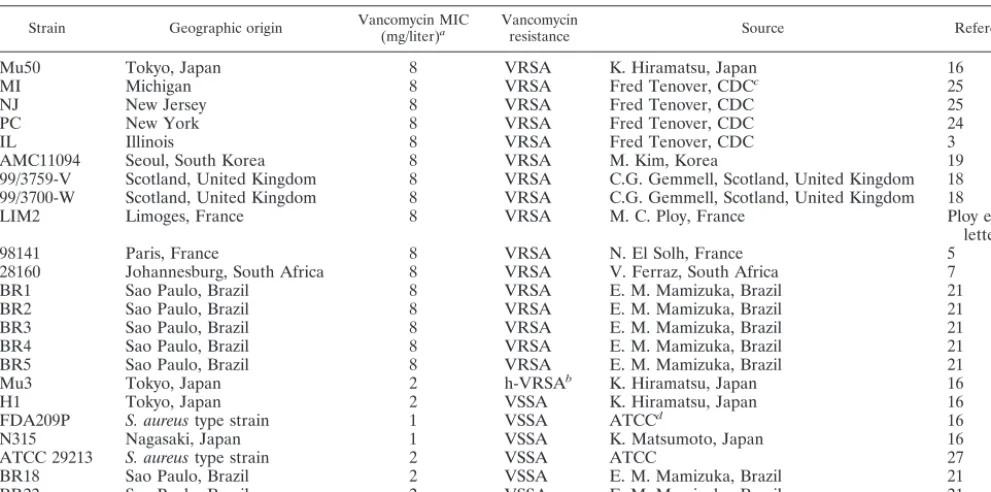
Bacterial strains.The sources and relevant characteristics of the bacterial strains used in this study are listed in Table 1. All of the strains used in this study have been stored at⫺80°C in brain heart infusion (BHI) broth containing 40% glycerol in multiple tubes as part of the Japanese Collection of Staphylococcus Cultures (JCSC) in the Department of Bacteriology, Juntendo University.
Obtaining of passage-derived strains with decreased vancomycin MICs.All potential VRSA strains received by the JCSC were plated on BHI agar contain-ing 4 mg of vancomycin per liter (inoculum size of 106CFU cells) and grown
overnight. A colony was picked and grown overnight in drug-free BHI medium. They were frozen at⫺80°C in BHI broth containing 40% glycerol in multiple tubes and used as the starting VRSA strains for serial drug-free culture. The culture was initiated by inoculating an ice shard of the frozen stock into BHI broth and incubating it overnight at 37°C with gentle shaking at 55 rpm. Passage was performed daily by inoculating 0.04 ml of overnight culture into 4 ml of fresh BHI broth (approximately 2.5⫻106CFU/ml). Portions of the cultures were
stored frozen on day 1, day 2, and subsequently every 5 days for later vancomycin MIC determination. Serial passage was continued until the vancomycin MIC for the culture had fallen to 2 or 3 mg/liter. The cultures were referred to as passage-derived strains with decreased MICs of vancomycin if the decreased
MIC stayed the same during subsequent nonselective passage of at least 10 days. Pulsed-field gel electrophoresis (PFGE) (see below) was performed with all of the parent and passage-derived strains to exclude possible cross-contamination of the culture.
PFGE.PFGE was carried out as described previously (35). Electrophoresis was performed for 22 h with a DRII contour-clamped homogenous electric field apparatus (Bio-Rad) with a pulse time of 5 to 40 s. The separated DNA frag-ments digested with the enzymeSmaI were photographed after being stained with ethidium bromide. The relatedness of the strains was judged by visual comparison of banding patterns of samples run together in the same gel accord-ing to previously described criteria. Strains were considered identical when their PFGE patterns contained the same number and sizes of fragments. Patterns varying by two or three bands were considered closely related, those with four to six band differences were considered possibly related, and those with seven or more differences were considered unrelated (28).
Susceptibility tests.The MIC determination was performed with BHI agar as described previously (16). To detect small changes in susceptibility, linear sets of antibiotic concentrations with increments of 1 mg/liter were used for determi-nation of the MICs of vancomycin, teicoplanin, and imipenem, whereas the orthodox twofold dilution system was used for oxacillin MIC determinations.
Analysis of the cell subpopulations resistant to vancomycin (population anal-ysis) was performed by spreading 0.1 ml of the starting cell suspension and its serial dilutions on BHI agar plates containing 1 to 12 mg of vancomycin/liter with 1-mg/liter increments and on plates containing 16 mg and 32 mg of vancomycin/ liter. The starting cell suspension was prepared by diluting the fresh bacterial culture in BHI broth to an optical density at 578 nm (OD578) of 0.3 by adding
fresh BHI broth. The plates were then incubated at 37°C for 48 h before the number of CFU was counted. The number of resistant cells contained in 0.1 ml of the starting cell suspension was calculated and plotted semilogarithmically.
Transmission electron microscopy.Preparation and examination ofS. aureus
cells by transmission electron microscopy was performed as described previously (6). Morphometric evaluation of cell wall thickness was performed by using photographic images at a final magnification of⫻30,000, and the cell wall thickness was measured as previously described (6). Thirty cells of each strain with nearly equatorial cut surfaces were measured for the evaluation of cell wall thickness, and results were expressed as means⫾standard deviations (SDs).
[image:2.603.45.541.81.327.2]One-step selection of vancomycin-resistant mutants from passage-derived TABLE 1. VRSA strains and control isolates used in this study
Strain Geographic origin Vancomycin MIC(mg/liter)a Vancomycinresistance Source Reference
Mu50 Tokyo, Japan 8 VRSA K. Hiramatsu, Japan 16
MI Michigan 8 VRSA Fred Tenover, CDCc 25
NJ New Jersey 8 VRSA Fred Tenover, CDC 25
PC New York 8 VRSA Fred Tenover, CDC 24
IL Illinois 8 VRSA Fred Tenover, CDC 3
AMC11094 Seoul, South Korea 8 VRSA M. Kim, Korea 19
99/3759-V Scotland, United Kingdom 8 VRSA C.G. Gemmell, Scotland, United Kingdom 18 99/3700-W Scotland, United Kingdom 8 VRSA C.G. Gemmell, Scotland, United Kingdom 18
LIM2 Limoges, France 8 VRSA M. C. Ploy, France Ploy et al.,
letter
98141 Paris, France 8 VRSA N. El Solh, France 5
28160 Johannesburg, South Africa 8 VRSA V. Ferraz, South Africa 7
BR1 Sao Paulo, Brazil 8 VRSA E. M. Mamizuka, Brazil 21
BR2 Sao Paulo, Brazil 8 VRSA E. M. Mamizuka, Brazil 21
BR3 Sao Paulo, Brazil 8 VRSA E. M. Mamizuka, Brazil 21
BR4 Sao Paulo, Brazil 8 VRSA E. M. Mamizuka, Brazil 21
BR5 Sao Paulo, Brazil 8 VRSA E. M. Mamizuka, Brazil 21
Mu3 Tokyo, Japan 2 h-VRSAb K. Hiramatsu, Japan 16
H1 Tokyo, Japan 2 VSSA K. Hiramatsu, Japan 16
FDA209P S. aureustype strain 1 VSSA ATCCd 16
N315 Nagasaki, Japan 1 VSSA K. Matsumoto, Japan 16
ATCC 29213 S. aureustype strain 2 VSSA ATCC 27
BR18 Sao Paulo, Brazil 2 VSSA E. M. Mamizuka, Brazil 21
BR22 Sao Paulo, Brazil 2 VSSA E. M. Mamizuka, Brazil 21
aMICs of vancomycin in original report. bh-VRSA, heterotype VRSA.
cCDC, Centers for Disease Control and Prevention, Atlanta, Ga. dATCC, American Type Culture Collection, Manassas, Va.
on May 15, 2020 by guest
http://jcm.asm.org/
strains.To test whether the passage-derived strains with decreased MICs of vancomycin obtained from each VRSA strain had the capacity to regenerate vancomycin-resistant mutants, a one-step vancomycin selection procedure was performed. Each passage-derived culture was adjusted to an OD578of 0.3 (about
108CFU/ml) by diluting it with fresh BHI broth. A 0.1-ml portion of the cell
suspension was spread onto a BHI agar plate containing 4 mg of vancomycin/ liter, and 10-fold serial dilutions were plated onto drug-free BHI agar plates to determine the size of the inoculum. The plates were incubated for 24 h at 37°C for enumeration of colonies. The frequency of emergence of VRSA was calcu-lated by dividing the number of CFU on the vancomycin-containing agar by the inoculum size. To confirm the vancomycin MIC for any colonies on the vanco-mycin-containing agar, a colony grown on the vancovanco-mycin-containing plate was picked after 24 h of incubation, inoculated in a prewarmed BHI broth, and cultivated for 3 to 4 h at 37°C. The resultant culture was referred to as a vancomycin-resistant mutant strain, designated with the suffix PR, and stocked at ⫺80°C for further study. At the same time, the culture was adjusted to an OD578
of 0.3 and subjected to MIC determination as described above.
Doubling time.The cultures were grown at 37°C in BHI broth with shaking at 25 rpm in an photorecording incubator (TN-261; ADVANTEC, Tokyo, Japan). The OD was monitored automatically every 2 min, and the cell populations were countered by spreading serial dilutions of cultures on BHI agar plates after sampling at least four times for each strain during the exponential growth phase. The doubling times in the exponential growth phase were calculated as follows: doubling time⫽[(t2⫺t1)⫻log 2]/[log OD600att2⫺log OD600att1], or
doubling time⫽[(t2⫺t1)⫻log 2]/[log population att2⫺log population att1], wheret1andt2are the times of measurement (22).
Statistical analysis of the data.The statistical significance of the data was evaluated by Student’sttest. Linear regression analysis of cell wall thickness and MICs of vancomycin, teicoplanin, imipenem, and oxacillin was performed by using StatView J4.5 (Abacus Concepts, Inc. Berkeley, Calif.).
RESULTS
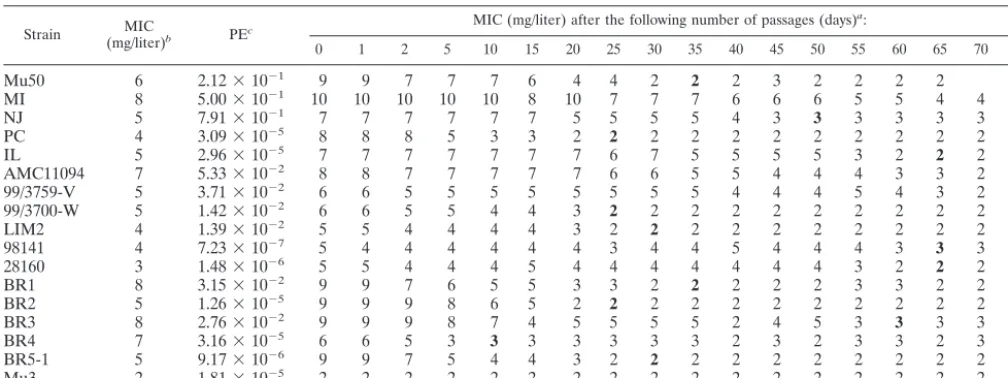
Gradual decrease of vancomycin MICs during drug-free
culture of VRSA strains.Table 2 shows the changes in
vanco-mycin MICs during drug-free culture of 16 VRSA strains. Before passaging, all the strains produced subclones capable of growth on a BHI agar plate containing 4 mg of vancomycin/ liter. The frequency of the resistant cells in the entire cell population is recorded for each strain as a plating efficiency value in Table 2. They ranged from 7.23⫻10⫺7to 7.91⫻10⫺1,
and the sizes of the cell subpopulations that were resistant to 4 mg of vancomycin/liter in some strains were roughly compa-rable to that of hetero-VRSA strain Mu3 (plating efficiency, 1.81⫻10⫺5).
The vancomycin MIC decreased gradually for all of the strains during drug-free passage, but the number of passages (days) required before it fell below the susceptibility break-point (4 mg/liter) varied from strain to strain and ranged from 5 to 84 days with a mean (SD) of 42.85 (24.38) days. When the culture maintained the same vancomycin MIC in the suscep-tible range for 10 days, it was considered a passage-derived strain with a decreased MIC of vancomycin and was designated with the suffix P with the number of days of passage.
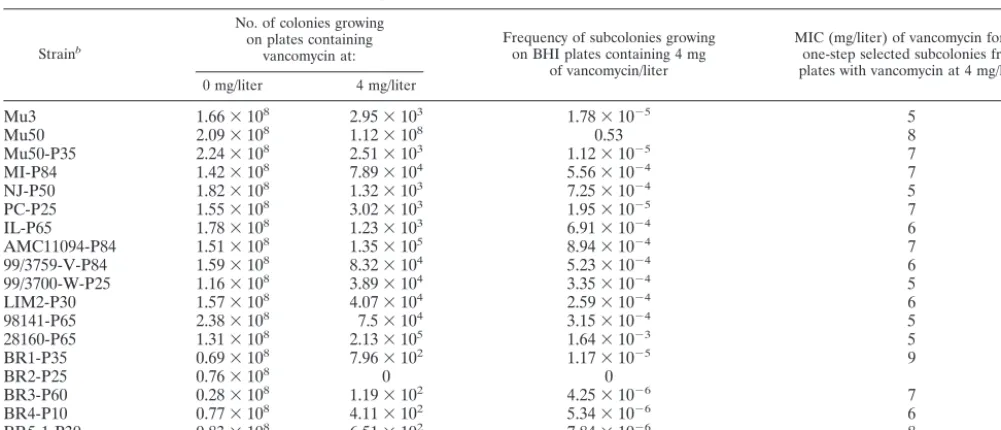
Population analysis of VRSA strains and their
passage-derived strains. Figure 1 illustrates population curves of 16
VRSA strains (as analyzed on the initiation of drug-free cul-ture) and those of the passage-derived strains with decreased MICs of vancomycin obtained after serial passage in drug-free medium. At the beginning, all strains contained a large pro-portion (more than 1 in 100 cells) of subpopulations growing in 4 mg of vancomycin/liter (Fig. 1). The sizes of the subpopula-tions decreased after drug-free passages; however, in all of the passage-derived strains except BR2-P25, the derivative of BR2, the resistant subpopulations were still present at frequencies ranging from 4.25 ⫻ 10⫺6 to 1.64 ⫻ 10⫺3 (Table 3). The
colonies formed on the agar plates containing 4 mg of vanco-mycin/liter were picked and tested for their vancomycin MICs. As shown in Table 3, all of these vancomycin-resistant colonies had vancomycin MICs of greater than 4 mg/liter, ranging from 5 to 9 mg/liter (MIC data obtained by using a series of drug concentrations with increments of 1 mg/liter). All passage-derived strains except BR2-P25 satisfied the criteria of hetero-VRSA, while BR-P25 was judged to be a vancomycin-suscep-tibleS. aureus(VSSA) strain (1, 16).
[image:3.603.43.547.81.270.2]PFGE of VRSA strains and their passage-derived strains.
TABLE 2. Gradual loss of vancomycin resistance among of VRSA strains during passage in drug-free BHI medium
Strain (mg/liter)MIC b PEc
MIC (mg/liter) after the following number of passages (days)a:
0 1 2 5 10 15 20 25 30 35 40 45 50 55 60 65 70 84
Mu50 6 2.12⫻10⫺1 9 9 7 7 7 6 4 4 2 2 2 3 2 2 2 2
MI 8 5.00⫻10⫺1 10 10 10 10 10 8 10 7 7 7 6 6 6 5 5 4 4 2
NJ 5 7.91⫻10⫺1 7 7 7 7 7 7 5 5 5 5 4 3 3 3 3 3 3
PC 4 3.09⫻10⫺5 8 8 8 5 3 3 2 2 2 2 2 2 2 2 2 2 2
IL 5 2.96⫻10⫺5 7 7 7 7 7 7 7 6 7 5 5 5 5 3 2 2 2
AMC11094 7 5.33⫻10⫺2 8 8 7 7 7 7 7 6 6 5 5 4 4 4 3 3 2 2
99/3759-V 5 3.71⫻10⫺2 6 6 5 5 5 5 5 5 5 5 4 4 4 5 4 3 2 2
99/3700-W 5 1.42⫻10⫺2 6 6 5 5 4 4 3 2 2 2 2 2 2 2 2 2 2
LIM2 4 1.39⫻10⫺2 5 5 4 4 4 4 3 2 2 2 2 2 2 2 2 2 2
98141 4 7.23⫻10⫺7 5 4 4 4 4 4 4 3 4 4 5 4 4 4 3 3 3
28160 3 1.48⫻10⫺6 5 5 4 4 4 5 4 4 4 4 4 4 4 3 2 2 2
BR1 8 3.15⫻10⫺2 9 9 7 6 5 5 3 3 2 2 2 2 2 3 3 2 2
BR2 5 1.26⫻10⫺5 9 9 9 8 6 5 2 2 2 2 2 2 2 2 2 2 2
BR3 8 2.76⫻10⫺2 9 9 9 8 7 4 5 5 5 5 2 4 5 3 3 3 3
BR4 7 3.16⫻10⫺5 6 6 5 3 3 3 3 3 3 3 2 3 2 3 3 2 3
BR5-1 5 9.17⫻10⫺6 9 9 7 5 4 4 3 2 2 2 2 2 2 2 2 2 2
Mu3 2 1.81⫻10⫺5 2 2 2 2 2 2 2 2 2 2 2 2 2 2 2 2 2
aBacteria were subjected to daily passage in drug-free BHI medium, and vancomycin MICs were determined every 5 days. The MICs of cultures that were regarded
as vancomycin-susceptible substrains are in boldface. These cultures were used for further studies.
bVancomycin MICs for strains when they were received by JCSC.
cPE, plating efficiency. The frequency of subpopulations resistant to 4 mg of vancomycin/liter was calculated by dividing the number of colonies grown on the
vancomycin-containing BHI agar (4 mg/liter) by the estimated number of cells in the inoculum.
on May 15, 2020 by guest
http://jcm.asm.org/
FIG. 1. Analysis of vancomycin-resistant subpopulations of VRSA strains and their passage-derived strains. The population curves of 16 VRSA strains and their passage-derived strains are compared with those of Mu50 and Mu3. All of the passage-derived strains except BR2-P25 retain subpopulations of cells capable of growth in 4 mg of vancomycin/liter despite their susceptible vancomycin MIC (2 or 3 mg/liter).
on May 15, 2020 by guest
http://jcm.asm.org/
Figure 2 shows the PFGE banding patterns of 16 VRSA strains and their passage-derived strains. Comparison of the PFGE patterns of the parent and passage-derived strains demonstrat-ed that 13 of the 16 pairs shardemonstrat-ed identical banding patterns.
Only NJ, AMC11094, and BR3 had a few band differences between the parent and passage-derived strains. However, since the PFGE patterns of the passage-derived strains were more similar to those of their parents than to those of any
TABLE 3. Frequencies of and vancomycin MICs for subcolonies of passage-derived substrains grown on agar plates containing vancomycin at 4 mg/litera
Strainb
No. of colonies growing on plates containing
vancomycin at:
Frequency of subcolonies growing on BHI plates containing 4 mg
of vancomycin/liter
MIC (mg/liter) of vancomycin for the one-step selected subcolonies from plates with vancomycin at 4 mg/liter
0 mg/liter 4 mg/liter
Mu3 1.66⫻108 2.95⫻103 1.78⫻10⫺5 5
Mu50 2.09⫻108 1.12⫻108 0.53 8
Mu50-P35 2.24⫻108 2.51⫻103 1.12⫻10⫺5 7
MI-P84 1.42⫻108 7.89⫻104 5.56⫻10⫺4 7
NJ-P50 1.82⫻108 1.32⫻103 7.25⫻10⫺4 5
PC-P25 1.55⫻108 3.02⫻103 1.95⫻10⫺5 7
IL-P65 1.78⫻108 1.23⫻103 6.91⫻10⫺4 6
AMC11094-P84 1.51⫻108 1.35⫻105 8.94⫻10⫺4 7
99/3759-V-P84 1.59⫻108 8.32⫻104 5.23⫻10⫺4 6
99/3700-W-P25 1.16⫻108 3.89⫻104 3.35⫻10⫺4 5
LIM2-P30 1.57⫻108 4.07⫻104 2.59⫻10⫺4 6
98141-P65 2.38⫻108 7.5⫻104 3.15⫻10⫺4 5
28160-P65 1.31⫻108 2.13⫻105 1.64⫻10⫺3 5
BR1-P35 0.69⫻108 7.96⫻102 1.17⫻10⫺5 9
BR2-P25 0.76⫻108 0 0
BR3-P60 0.28⫻108 1.19⫻102 4.25⫻10⫺6 7
BR4-P10 0.77⫻108 4.11⫻102 5.34⫻10⫺6 6
BR5-1-P30 0.83⫻108 6.51⫻102 7.84⫻10⫺6 8
aAll cultivations of substrains were spreaded on BHI plates containing vancomycin at 0 and 4 mg/liter and incubated at 37°C for 24 h, and the MICs for subcolonies
growing on vancomycin plates at 4 mg/liter were determined.
bThe numbers after the suffix P indicate the days of passage.
FIG. 2. PFGE banding patterns ofSmaI-digested chromosomal DNAs of VRSA strains and their passage-derived strains. All except three passage-derived strains (NJ-P50, AMC11094-P84, and BR3-P60) had PFGE patterns identical to those of the parent strains. Lanes MW, low-range PFGE marker (Bio-Rad Laboratories). The sizes of the fragments are in kilobases.
on May 15, 2020 by guest
http://jcm.asm.org/
[image:5.603.50.540.420.694.2]other strains, they were considered authentic derivative strains of NJ, AMC11094, and BR3, respectively (Fig. 2). All vanco-mycin-resistant mutant strains showed PFGE patterns identi-cal to those of the passage-derived strains from which they were derived.
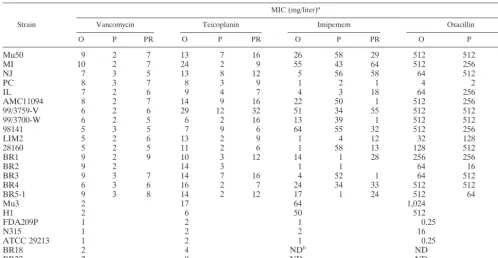
Beta-lactam and glycopeptide MICs for VRSA strains and
their derivatives. Table 4 shows the glycopeptide and
beta-lactam MICs for 16 VRSA strains and their passage-derived and vancomycin-resistant mutant strains. A decrease of vanco-mycin MICs was accompanied by a decrease of teicoplanin MICs in all cases except one; i.e., the passage-derived strains of strain 98141 (98141-P65) showed an increase in teicoplanin MIC from 7 to 9 mg/liter (Table 4). Moreover, the increased vancomycin MICs for vancomycin-resistant mutant strains were also accompanied by the increase in teicoplanin MICs except again for the mutant derived from strain 98141 (98141-P65). The passage-derived strains of five VRSA strains (Mu50-P35, NJ-P50, AMC11094-P84, 99/3759-V-P84, and BR3-P60) still had substantial teicoplanin resistance (MICs, 7 to 12 mg/ liter) even after the drop in vancomycin MICs.
Beta-lactam MICs were also significantly changed in some parent strains versus passage-derived strain combinations, but in a complex manner. With the decrease of vancomycin resis-tance, imipenem MICs increased in nine, decreased in six, and remained the same in one strain combination. Oxacillin MICs were also changed quite significantly in some strains: they increased in six, decreased in five, and remained the same in five strain combinations (Table 4). The MICs for vancomycin-resistant mutant strains obtained from passage-derived strains were also changed in a complex manner. When the pattern of MIC change for beta-lactam
antibiotics was observed by comparing the passage-derived strains and vancomycin-resistant mutant strains, we noticed that the pattern was quite deviant from the simple reversal of the pattern of MIC change observed between passage-derived strains and the original VRSA strains. No simple correlation was seen between glycopeptide and beta-lactam MICs, while a significant correlation was observed between the MICs of van-comycin and teicoplanin (r⫽0.679;P⬍0.001), and between the MICs of imipenem and oxacillin (r⫽0.787;P⬍0.001).
Cell wall thickness and vancomycin resistance.A total of 48
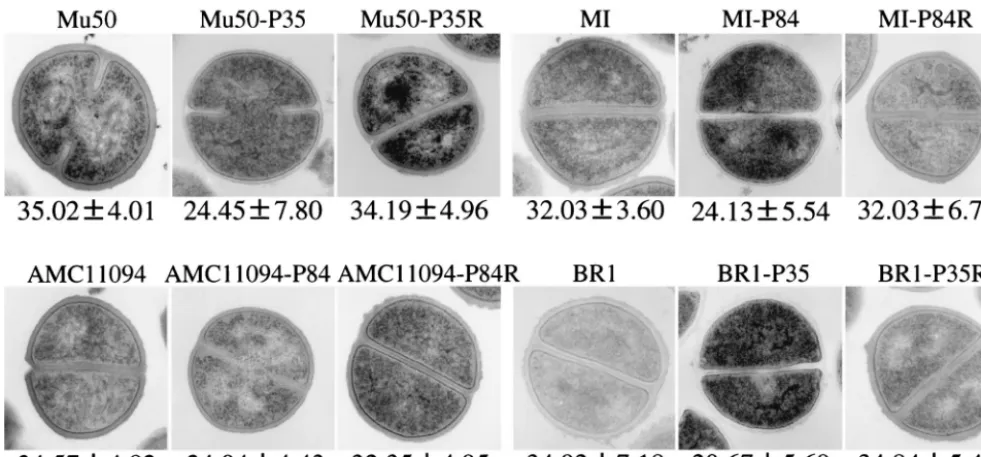
S. aureus strains, including 16VRSA clinical strains, the 16 passage-derived strains with decreased vancomycin MICs, 9 vancomycin-resistant mutant strains, and 7 control strains (6 VSSA strains and 1 hetero-VRSA strain, Mu3) were subjected to morphometric study using transmission electron micros-copy. Figure 3 shows transmission electron micrographs of representative strains. As is evident in Fig. 3, VRSA strains and vancomycin-resistant mutant strains had significantly thicker cell walls than their passage-derived strains.
Table 5 shows the results of cell wall thickness measurement for all VRSA strains and their derivative strains. The mean (SD) cell wall thicknesses of 16 VRSA strains, 16 passage-derived strains, 9 vancomycin-resistant mutant strains, and 7 control strains were 31.29 (2.62), 21.808 (1.40), 31.56 (20.5), and 23.99 (2.04) nm, respectively. The differences in the cell wall thickness between VRSA and passage-derived strains, vancomycin-resistant mutant strains and passage-derived strains, and VRSA and control strains were all statistically significant (P⬍ 0.001). The correlation between the MIC of each antibiotic and cell wall thickness is illustrated in Fig. 4. Cell wall thickness correlated very well with the MIC of
van-TABLE 4. Comparison of antibiotic susceptibilities among VRSA strains and their derivaties
Strain
MIC (mg/liter)a
Vancomycin Teicoplanin Imipemem Oxacillin
O P PR O P PR O P PR O P PR
Mu50 9 2 7 13 7 16 26 58 29 512 512 512
MI 10 2 7 24 2 9 55 43 64 512 256 512
NJ 7 3 5 13 8 12 5 56 58 64 512 512
PC 8 3 7 8 3 9 1 2 1 4 2 8
IL 7 2 6 9 4 7 4 3 18 64 256 512
AMC11094 8 2 7 14 9 16 22 50 1 512 256 1
99/3759-V 6 2 6 29 12 32 51 34 55 512 512 256
99/3700-W 6 2 5 6 2 16 13 39 1 512 512 32
98141 5 3 5 7 9 6 64 55 32 512 256 256
LIM2 5 2 6 13 2 9 1 4 12 32 128 128
28160 5 2 5 11 2 6 1 58 13 128 512 256
BR1 9 2 9 10 3 12 14 1 28 256 256 512
BR2 9 2 14 3 1 1 64 16
BR3 9 3 7 14 7 16 4 52 1 64 512 8
BR4 6 3 6 16 2 7 24 34 33 512 512 512
BR5-1 9 3 8 14 2 12 17 1 24 512 64 256
Mu3 2 17 64 1,024
H1 2 6 50 512
FDA209P 1 2 1 0.25
N315 1 2 2 16
ATCC 29213 1 2 1 0.25
BR18 2 4 NDb ND
BR22 2 9 ND ND
aO, P, and PR, parental strains, passage-derived strains, and vancomyin-resistant mutant strains, respectively. bND, not determined.
on May 15, 2020 by guest
http://jcm.asm.org/
[image:6.603.42.541.81.339.2]comycin (r ⫽0.908;P ⬍0.001) and also with MIC of teico-plainin (r ⫽ 0.655; P ⬍ 0.0001). There was no correlation between cell wall thickness and MICs of beta-lactam antibiot-ics (Fig. 4).
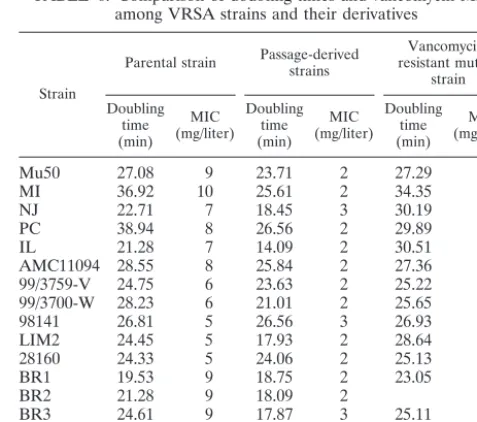
Doubling times of VRSA strains and their derivatives.Table
6 shows the result of measurement of the doubling time of each
S. aureusstrain during its exponential growth phase. All of the VRSA and vancomycin-resistant mutant strains had prolonged doubling times compared with their isogenic passage-derived strains.
DISCUSSION
VRSA strain Mu50 produces excessive amounts of pepti-doglycan to make the thickened cell wall (11, 13, 14, 17). By contrast, the heteroresistant strain Mu3 has moderately acti-vated cell wall synthesis, and its cell wall thickness is between those of Mu50 and vancomycin-susceptible control strains (6, 11). This indicated that thickening of the cell wall might be closely correlated with the increase of vancomycin MIC under the S. aureusgenetic background of the Mu3-Mu50 lineage (11, 12, 16). This study was performed to test whether the cell wall thickening is a common feature of VRSA strains isolated from other countries. The results demonstrated a significant statistical correlation between the cell wall thickness and van-comycin MICs in an analysis of a total of 48S. aureusstrains, including 16 sets of clinical VRSA strains and their derivative mutant strains (Fig. 4).
It seems likely that the thickening of the cell wall is closely associated with the mechanism of vancomycin resistance in the VRSA strains. As we and other researchers proposed previ-ously, trapping of vancomycin molecules in the cell wall pep-tidoglycan would be the essential contributor (14, 24). The thicker the cell wall, the more vancomycin molecules would be
trapped within the cell wall, thus allowing a decreased number of vancomycin molecules to reach the cytoplasmic membrane where the real functional targets of vancomycin are present (4, 14). Vancomycin binds to the stem peptide of the
membrane-TABLE 5. Comparison of cell wall thicknesses among VRSA strains and their derivatives
Strain
Mean cell wall thickness (nm⫾SD)a
Parental
strain Passage-derivedstrain Resistant mutantstrain
Mu50 35.02⫾4.01 24.45⫾7.80 34.19⫾4.96
MI 32.03⫾3.60 24.13⫾5.54 32.03⫾6.75
NJ 34.52⫾4.55 21.32⫾5.64 28.83⫾2.83
PC 32.42⫾3.82 22.07⫾6.55 31.85⫾7.47
IL 30.27⫾4.04 20.93⫾6.06 30.05⫾4.24
AMC11094 34.57⫾4.82 24.04⫾4.43 32.35⫾4.95
99/3759-V 27.27⫾3.44 21.13⫾7.81 NDb
99/3700-W 29.42⫾3.43 21.08⫾6.11 ND
98141 27.12⫾3.18 21.46⫾5.82 ND
LIM2 31.43⫾6.02 22.12⫾6.79 29.80⫾4.81
28160 27.65⫾3.45 20.62⫾5.47 ND
BR1 34.92⫾7.18 20.67⫾5.69 34.84⫾5.47
BR2 31.04⫾3.93 23.88⫾4.56
BR3 31.45⫾3.82 21.05⫾7.85 30.14⫾3.91
BR4 30.77⫾4.62 20.75⫾5.95 ND
BR5-1 31.72⫾3.85 20.55⫾6.34 ND
Mu3 26.53⫾4.80
H1 25.99⫾2.26
FDA209P 22.78⫾1.85
N315 21.46⫾2.25
ATCC 29213 21.08⫾1.76
BR18 24.26⫾3.96
BR22 24.57⫾3.08
aMorphometric evaluation of cell wall thickness was performed by using
photographs of transmission electron mycroscopy images obtained at a final magnification of of⫻30,000.
bND, not done.
FIG. 3. Transmission electron microscopy of representative VRSA strains, their passage-derived strains, and vancomycin-resistant mutant strains. Magnification,⫻30,000. The values given under each panel are the means and SDs of the cell wall thickness of the cells in nanometers. Note that the cell walls of passage-derived strains (with suffix P) were much thinner than those of the parent VRSA strains and vancomycin-resistant mutant strains (suffix PR).
on May 15, 2020 by guest
http://jcm.asm.org/
[image:7.603.47.538.70.298.2]anchored murein monomer (lipid II) at its Lys–D-Ala–D-Ala
residue and thus prevents the murein monomer from being incorporated into the nascent peptidoglycan chain (23, 32). Recently, we observed that the thickened cell wall not only traps a greater number of vancomycin molecules but also sig-nificantly reduces the time that vancomycin completely inhibits peptidoglycan synthesis (K. Hiramatsu, Abstr. 41st Intersci. Conf. Antimicrob. Agents Chemother., abstr. 1067, 2001). In view of their low-level vancomycin resistance (MIC of 8 mg/ liter) and the absence of van genes or any alteration in the terminal D-alanyl–D-alanine residues of peptidoglycan, it
would be reasonable to consider the cell wall thickening as the major contributor to the vancomycin resistance of S. aureus
clinical strains (6, 14, 15).
The prolonged doubling times observed in clinical as well as in vitro-derived S. aureus strains with increased vancomycin resistance attests to a great biological fitness cost imposed on the strains. Compared with vancomycin-susceptibleS. aureus
strains, Mu50 incorporates 2.3 times more glucose molecules into the cell wall peptidoglycan, where they constitute the aminosugar components of thickened cell wall (6). The in-creased murein biosynthesis by itself consumes ATPs and im-portant metabolites such as phosphoenolpyruvate, but the
[image:8.603.301.540.513.724.2]di-FIG. 4. Regression analysis between cell wall thickness and MICs of glycopeptide and beta-lactam antibiotics. Circles, VRSA strains; squares, passage-derived strains; triangles, vancomycin-resistant mutant strains; diamonds, other S. aureusstrains. A significant correlation was seen between vancomycin MIC and cell wall thickness, followed by that between teicoplanin MIC and cell wall thickness. No correlation was seen between beta-lactam antibiotic MICs and cell wall thickness.
TABLE 6. Comparison of doubling times and vancomycin MICs among VRSA strains and their derivatives
Strain
Parental strain Passage-derivedstrains resistant mutant Vancomycin-strain Doubling
time (min)
MIC (mg/liter)
Doubling time (min)
MIC (mg/liter)
Doubling time (min)
MIC (mg/liter)
Mu50 27.08 9 23.71 2 27.29 9
MI 36.92 10 25.61 2 34.35 7
NJ 22.71 7 18.45 3 30.19 5
PC 38.94 8 26.56 2 29.89 7
IL 21.28 7 14.09 2 30.51 6
AMC11094 28.55 8 25.84 2 27.36 6
99/3759-V 24.75 6 23.63 2 25.22 6
99/3700-W 28.23 6 21.01 2 25.65 5
98141 26.81 5 26.56 3 26.93 6
LIM2 24.45 5 17.93 2 28.64 6
28160 24.33 5 24.06 2 25.13 5
BR1 19.53 9 18.75 2 23.05 5
BR2 21.28 9 18.09 2
BR3 24.61 9 17.87 3 25.11 7
BR4 22.53 9 21.92 3 30.41 8
BR5-1 26.76 9 24.64 3 29.78 8
on May 15, 2020 by guest
http://jcm.asm.org/
version of glucose as the material for cell wall components would lead to further depletion of energy and the important metabolites by cutting short their production. Since the rates of growth and cell wall synthesis ofS. aureusare not correlated with each other (34), it is reasonable to assume that murein overproduction causes detrimental effects on the rapid growth of the cell due to its heavy burden on the supply of ATP and key metabolites essential for cell replication.
The prolonged doubling times of VRSA strains explain why they do not quickly prevail in health care facilities and their detection is mostly confined to patients with MRSA infection undergoing long-term vancomycin therapy (5, 9, 29, 30). They also account for why VRSA outbreaks like the case recently reported occur only rarely (20). It may be that VRSA gener-ated in the course of vancomycin treatment does not easily colonize the next patient who is not receiving vancomycin therapy (because of its inferior growth rate compared to other colonizing organisms). Four VRSA strains, including Mu50, have been shown to lose the vancomycin resistance phenotype during drug-free in vitro passage (2). We showed that this is a common feature for all the 16 VRSA clinical strains, though the time required before the loss of the resistance phenotype varied greatly (10 to 84 days) from strain to strain (Table 2). Because of its slow growth, VRSA seems to be replaced by vancomycin-susceptible mutants with higher growth rates that spontaneously emerge during drug-free passage.
Another significant observation in this study was that the apparently susceptible cultures obtained after the drug-free passages of VRSA strains still maintained vancomycin-resis-tant subpopulations. Thus, the passage-derived strains with decreased MICs of vancomycin are best explained by the mechanism of heterogeneous resistance (1, 16). Moreover, they were shown to produce VRSA mutants with a high fre-quency of 1 in 103to 1 in 106when selected with vancomycin
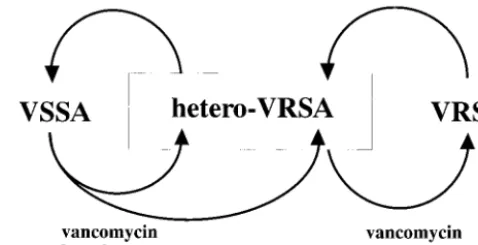
(Table 3). This is consistent with the view that hetero-VRSA is the precedent strain of VRSA (16). If we review the pheno-typic sequence of events in clinical settings, emergence of VRSA would be the result of vancomycin selection exerted upon a hetero-VRSA strain in the hospital, and the strain would return to hetero-VRSA status when vancomycin is not used for a while and its selective pressure lifted (Fig. 5). On the other hand, as indicated in Fig. 5, some hetero-VRSA strains, as represented by Mu3, are extremely stable and can be dis-seminated across wards and even across hospitals (16). There-fore, the emergence of VRSA is supported by dissemination of easily reselected hetero-VRSA strains upon exposure to van-comycin.
Beta-lactam antibiotics are suspected to play a role in the dissemination of hetero-VRSA, as indicated in Fig. 5. In Ja-pan, hetero-VRSA strains were found quite frequently in clin-ical isolates in the late 1980s before the introduction of van-comycin (vanvan-comycin was introduced in 1991, and teicoplanin was introduced in 1998). This indicates that the conversion of VSSA to hetero-VRSA can be achieved in association with hetero- to homoconversion of methicillin resistance caused by beta-lactam selection (15, 27). Imipenem frequently selects from hetero-MRSA strains highly methicillin-resistant mutants that have elevated teicoplanin resistance (MIC, 8 mg/l) and heteroresistance to vancomycin (15). Finan et al. recently also described the hetero- to homoconversion of oxacillin
resis-tance of S. aureus and Staphylococcus epidermidisstrains ac-companied by a decrease in the susceptibility to vancomycin (8). This suggests that the use of beta-lactam antibiotics for MRSA infection is a risk factor for the emergence of hetero-VRSA, although the precise genetic mechanism remains to be clarified.
ACKNOWLEDGMENTS
This work was supported by a Grant-in-Aid for Scientific Research on Priority Areas (13226114) from The Ministry of Education, Science, Sports, Culture and Technology of Japan and the Core University System Exchange Programme under the Japan Society for the Promo-tion of Science, coordinated by the University of Tokyo Graduate School of Medicine and Mahidol University. The study was also partly supported by a Grant for International Health Cooperation Research (11C-4) from the Ministry of Health and Welfare and by the Research for the Future program of the Japan Society for the Promotion of Science.
REFERENCES
1. Aritaka, N., H. Hanaki, L. Cui, and K. Hiramatsu.2001. Combination effect of vancomycin and beta-lactams against aStaphylococcus aureusstrain, Mu3, with heterogeneous resistance to vancomycin. Antimicrob. Agents Che-mother.45:1292–1294.
2. Boyle-Vavra, S., S. K. Berke, J. C. Lee, and R. S. Daum.2000. Reversion of the glycopeptide resistance phenotype inStaphylococcus aureusclinical iso-lates. Antimicrob. Agents Chemother.44:272–277.
3. Boyle-Vavra, S., H. Labischinski, C. C. Ebert, K. Ehlert, and R. S. Daum. 2001. A spectrum of changes occurs in peptidoglycan composition of glyco-peptide-intermediate clinicalStaphylococcus aureus isolates. Antimicrob. Agents Chemother.45:280–287.
4. Breukink, E., I. Wiedemann, C. van Kraaij, O. Kuipers, H. Sahl, and B. de Kruijff.1999. Use of the cell wall precursor lipid II by a pore-forming peptide antibiotic. Science286:2361–2364.
5. Chesneau, O., A. Morvan, and N. E. Solh.2000. Retrospective screening for heterogeneous vancomycin resistance in diverse Staphylococcus aureus
clones disseminated in French hospitals. J. Antimicrob. Chemother.45:887– 890.
6. Cui, L., H. Murakami, K. Kuwahara-Arai, H. Hanaki, and K. Hiramatsu. 2000. Contribution of a thickened cell wall and its glutamine nonamidated component to the vancomycin resistance expressed byStaphylococcus aureus
[image:9.603.303.542.72.194.2]Mu50. Antimicrob. Agents Chemother.44:2276–2285.
FIG. 5. Proposed cycle of vancomycin resistance expression in the MRSA population. Hetero-VRSA strains prevail in the hospital, and some of these strains become VRSA as a result of prolonged exposure of the strains to vancomycin. Once vancomycin pressure is lifted, VRSA gradually goes back to hetero-VRSA status, from which, how-ever, VRSA is regenerated at a high frequency of 1 in 103to 1 in 106.
Some in vitro-selected hetero-VRSA strains are unstable (K. Hira-matsu, unpublished observation) and return to VSSA status within 2 weeks in drug-free culture. However, some hetero-VRSA clinical strains, represented by Mu3, are extremely stable, and constitute a great risk factor for the emergence of VRSA and vancomycin thera-peutic failure once they are allowed to prevail in the hospital. Both beta-lactam and vancomycin serve as selective pressure in the gener-ation of hetero-VRSA from VSSA (17).
on May 15, 2020 by guest
http://jcm.asm.org/
7. Ferraz, V., A. Duse, M. Kassel, A. Black, T. Ito, and K. Hiramatsu.2000. Vancomycin-resistantStaphylococcus aureusoccurs in South Africa. S. Afr. Med. J.90:1113.
8. Finan, J., A. Rosato, T. Dickinson, D. Ko, and G. Archer.2002. Conversion of oxacillin-resistant staphylococci from heterotypic to homotypic resistance expression. Antimicrob. Agents Chemother.46:24–30.
9. Fridkin, S. K.2001. Vancomycin-intermediate and -resistantStaphylococcus aureus: what the infectious disease specialist needs to know. Clin. Infect. Dis. 32:108–115.
10. Hageman, J., D. Pegues, C. Jepson, R. Bell, M. Guinan, K. Ward, M. Cohen, J. Hindler, F. Tenover, S. McAllister, M. Kellum, and S. Fridkin.2001. Vancomycin-intermediate Staphylococcus aureus in a home health-care pa-tient. Emerg. Infect. Dis.7:1023–1025.
11. Hanaki, H., K. Kuwahara-Arai, S. Boyle-Vavra, R. S. Daum, H. Labischin-ski, and K. Hiramatsu.1998. Activated cell-wall synthesis is associated with vancomycin resistance in methicillin-resistantStaphylococcus aureusclinical strains Mu3 and Mu50. J. Antimicrob. Chemother.42:199–209.
12. Hanaki, H., H. Labischinski, Y. Inaba, N. Kondo, H. Murakami, and K. Hiramatsu.1998. Increase in glutamine-non-amidated muropeptides in the peptidoglycan of vancomycin-resistantStaphylococcus aureusstrain Mu50. J. Antimicrob. Chemother.42:315–320.
13. Hiramatsu, K.1998. The emergence ofStaphylococcus aureuswith reduced susceptibility to vancomycin in Japan. Am. J. Med.104:7S–10S.
14. Hiramatsu, K.1998. Vancomycin resistance inStaplylococci. Drug Resist. 1:135–150.
15. Hiramatsu, K.2001. Vancomycin-resistantStaphylococcus aureus: a new model of antibiotic resistance. Lancet Infect. Dis.1:147–155.
16. Hiramatsu, K., N. Aritaka, H. Hanaki, S. Kawasaki, Y. Hosoda, S. Hori, Y. Fukuchi, and I. Kobayashi.1997. Dissemination in Japanese hospitals of strains ofStaphylococcus aureusheterogeneously resistant to vancomycin. Lancet350:1670–1673.
17. Hiramatsu, K., T. Ito, and H. Hanaki.1999. Mechanisms of methicillin and vancomycin resistance inStaphylococcus aureus, p. 211–242.InW. R. G. Finch and R. J. Williams (ed.), Bailliere’s clinical infectious diseases, vol. 5. Bailliere Tindall, London, United Kingdom.
18. Hood, J., G. F. S. Edwards, B. Cosgrove, E. Curran, D. Morrison, and C. G. Gemmell.2000. Vancomycin-intermediateStaphylococcus aureusat a Scot-tish hospital. J. Infect.40:A11.
19. Kim, M. N., C. H. Pai, J. H. Woo, J. S. Ryu, and K. Hiramatsu.2000. Vancomycin-intermediateStaphylococcusaureus in Korea. J. Clin. Micro-biol.38:3879–3881.
20. Oliveira, G. A., A. M. Aquila, R. A. Masiero, C. Levy, S. G. Gomes, L. Cui, K. Hiramatsu, and E. M. Mamizuka.2001. Isolation in Brazil of nosocomial
Staphylococcus aureuswith reduced susceptibility to vancomycin. Infect. Control Hosp. Epidemiol.22:443–448.
21. Paton, R., T. Snell, F. Emmanuel, and R. Miles.2001. Glycopeptide
resis-tance in an epidemic strain of methicillin-resistantStaphylococcus aureus. J. Antimicrob. Chemother.48:941–942.
22. Prescott, L., J. Harley, and D. Klein.1990. Microbial growth, p. 110–114.In
K. Kane (ed.), Microbiology. Wm. C. Brown Publisher, Dubuque, Iowa. 23. Reynolds, P., and E. Somner.1990. Comparison of the target sites and
mechanisms of action of glycopeptide and lipoglycodepsipeptide antibiotics. Drugs Exp. Clin. Res.16:385–389.
24. Sieradzki, K., M. G. Pinho, and A. Tomasz.1999. Inactivated pbp4 in highly glycopeptide-resistant laboratory mutants ofStaphylococcus aureus. J. Biol. Chem.274:18942–18946.
25. Sieradzki, K., R. B. Roberts, S. W. Haber, and A. Tomasz.1999. The devel-opment of vancomycin resistance in a patient with methicillin-resistant
Staphylococcus aureusinfection. N. Engl. J. Med.340:517–523.
26. Smith, T. L., M. L. Pearson, K. R. Wilcox, C. Cruz, M. V. Lancaster, B. Robinson-Dunn, F. C. Tenover, M. J. Zervos, J. D. Band, E. White, and W. R. Jarvis.1999. Emergence of vancomycin resistance inStaphylococcus aureus. Glycopeptide-intermediateStaphylococcus aureus. N. Engl. J. Med.340:493– 501.
27. Tanaka, T., K. Okuzumi, A. Iwamoto, and K. Hiramatsu.1995. A retrospec-tive study of methicillin-resistant Staphylococcus aureus clinical strains in Tokyo University Hospital. J. Infect. Chemother.1:40–49.
28. Tenover, F., R. Arbeit, R. Goering, P. Mickelsen, B. Murray, D. Persing, and B. Swaminathan.1995. Interpreting chromosomal DNA restriction patterns produced by pulsed-field gel electrophoresis: criteria for bacterial strain typing. J. Clin. Microbiol.33:2233–2239.
29. Tenover, F. C.1999. Implications of vancomycin-resistantStaphylococcus aureus. J. Hosp. Infect.43(Suppl.):S3–S7.
30. Tenover, F. C., J. W. Biddle, and M. V. Lancaster.2001. Increasing resistance to vancomycin and other glycopeptides inStaphylococcus aureus. Emerg. Infect. Dis.7:327–332.
31. Tenover, F. C., M. V. Lancaster, B. C. Hill, C. D. Steward, S. A. Stocker, G. A. Hancock, C. M. O’Hara, S. K. McAllister, N. C. Clark, and K. Hira-matsu.1998. Characterization of staphylococci with reduced susceptibilities to vancomycin and other glycopeptides. J. Clin. Microbiol.36:1020–1027. 32. Walsh, C.1999. Deconstructing vancomycin. Science284:442–443. 33. Wong, S. S., T. K. Ng, W. C. Yam, D. N. Tsang, P. C. Woo, S. K. Fung, and
K. Y. Yuen.2000. Bacteremia due toStaphylococcus aureuswith reduced susceptibility to vancomycin. Diagn. Microbiol. Infect. Dis.36:261–268. 34. Wong, W., A. Chatterjee, and F. Young.1978. Regulation of bacterial cell
walls: correlation between autolytic activity and cell wall turnover in Staph-ylococcus aureus. J. Bacteriol.134:555–561.
35. Yoshida, T., N. Kondo, Y. A. Hanifah, and K. Hiramatsu.1997. Combined use of ribotyping, PFGE typing and IS431 typing in the discrimination of nosocomial strains of methicillin-resistantStaphylococcus aureus. Microbiol. Immunol.41:687–695.