Copyright © 1999, American Society for Microbiology. All Rights Reserved.
Quantitative Analysis of Epstein-Barr Virus Load by Using
a Real-Time PCR Assay
HIROSHI KIMURA,1* MAKOTO MORITA,1YUMI YABUTA,1KIYOTAKA KUZUSHIMA,2 KOJI KATO,3SEIJI KOJIMA,3TAKAHARU MATSUYAMA,3
ANDTSUNEO MORISHIMA1
Department of Pediatrics, Nagoya University School of Medicine,1Laboratory of Viral Oncology, Research Institute, Aichi Cancer Center,2and Division of Hematology/Oncology, Children’s
Medical Center, Japanese Red Cross Nagoya First Hospital,3Nagoya, Japan Received 2 July 1998/Returned for modification 20 August 1998/Accepted 13 October 1998
To measure the virus load in patients with symptomatic Epstein-Barr virus (EBV) infections, we used a real-time PCR assay to quantify the amount of EBV DNA in blood. The real-real-time PCR assay could detect from 2 to over 107copies of EBV DNA with a wide linear range. We estimated the virus load in peripheral blood
mono-nuclear cells (PBMNC) from patients with symptomatic EBV infections. The mean EBV-DNA copy number in the PBMNC was 103.7 copies/mg of DNA in patients with EBV-related lymphoproliferative disorders, 104.1
copies/mg of DNA in patients with chronic active EBV infections, and 102.2copies/mg of DNA in patients with
infectious mononucleosis. These numbers were significantly larger than those in either posttransplant patients or immunocompetent control patients without EBV-related diseases. In a patient with infectious mononucle-osis, the virus load decreased as the symptoms resolved. The copy number of EBV DNA in PBMNC from symp-tomatic EBV infections was correlated with the EBV-positive cell number determined by the in situ hybrid-ization assay (r 5 0.842; P < 0.0001). These results indicate that the real-time PCR assay is useful for diagnosing symptomatic EBV infection and for monitoring the virus load.
Epstein-Barr virus (EBV) is the causative agent of infectious mononucleosis (IM) and EBV-related malignancies such as Burkitt’s lymphoma and nasopharyngeal carcinoma. During the primary infection, EBV infects and immortalizes B-lym-phocytes, which proliferate in the peripheral blood and lymph nodes. After the emergence of EBV-specific immunity, the number of EBV-infected B cells is regulated mainly by cyto-toxic T-lymphocytes (CTL) and remains at 1 to 105 B-lympho-cytes (25). In a limited number of individuals, the host immu-nity is unable to regulate the EBV-infected cells, and chronic active EBV infection (CAEBV) occurs (13, 24, 31). In immu-nocompromised hosts, such as AIDS patients or transplant recipients, EBV-infected cells proliferate again and cause op-portunistic B-cell lymphoma, a lymphoproliferative disorder (LPD) (6, 22).
For the diagnosis of CAEBV and LPD, it is essential to measure the EBV load in either a biopsy specimen or the peripheral blood (19, 23, 24, 27, 33). A biopsy is invasive and labor-intensive, so several methods to detect the virus load in the peripheral blood for the early diagnosis of LPD and CAEBV have been developed. Spontaneous outgrowth of EBV-infected B cells in vitro (27, 30), in situ hybridization (ISH) using EBV-encoded small RNA (EBER) probe (18), and quantitative PCR assays are now used to determine the EBV load in peripheral blood mononuclear cells (PBMNC) (2, 26, 27, 29). Previously, we reported that quantitative PCR was useful for diagnosing and monitoring EBV infections (37). However, the quantitative PCR assay requires at least 3 days to complete, since the assay includes gel electrophoresis and Southern hybridization steps. Moreover, the linear range of the quantitative PCR is too narrow to measure a variety of samples
because, in samples with a large amount of template, the amount of amplified product reaches a plateau after the log phase of the reaction (34).
Recently, a novel real-time quantitative PCR was developed (7, 36). This method measures the accumulation of PCR prod-ucts with a fluorogenic probe and by real-time laser scanning in a 96-well plate. Since this assay does not require postsample handling, much faster assays are possible. The assay has a very large dynamic range of target molecule determination because the real-time measurement of the PCR product enables us to quantify the amplified products in the log phase of the reaction (7). In this study, the real-time PCR method was applied to the measurement of EBV DNA in peripheral blood. We measured the virus load in patients with symptomatic EBV infections and compared it with the load in patients without symptoms asso-ciated with EBV infection. The real-time PCR was also com-pared with the ISH and traditional qualitative PCR assays.
MATERIALS AND METHODS
Patients and samples.Eighteen patients who had symptomatic EBV infections were enrolled in this study (four with CAEBV, five with LPD, and nine with IM). These patients were 1 to 19 years old (mean age, 6.5 years). CAEBV was diagnosed according to previously published guidelines (19, 24). The clinical features of some of these cases were described elsewhere (10, 13, 15, 17). All the LPD patients except a 2-year-old boy with congenital immunodeficiency had had liver transplants. LPD was suspected in patients with lymphadenopathy, pulmo-nary infiltration, gastrointestinal tract bleeding, or unexplained allograft dysfunc-tion. The diagnosis of LPD was established by pathology or the detection of EBER by the ISH assay (18, 33). IM was diagnosed by clinical findings and serological examinations as follows: positive for anti-viral capsid antigen (VCA) immunoglobulin G (IgG) and/or IgM and negative for anti-EB nuclear antigen (EBNA) antibody. For controls, 10 patients who had had either a liver or a bone marrow transplantation were prospectively evaluated for EBV infections. These patients were 1 to 17 years old (mean age, 5.8 years) and had no symptoms characteristic of LPD. Either the recipient or the donor was seropositive for EBV. In addition, 13 immunocompetent patients (2 to 16 years old; mean age, 6.7 years) who were initially suspected of having a primary EBV infection were enrolled as controls. These patients were positive for both anti-VCA IgG and EBNA antibodies, indicating that they had been previously infected with EBV. Either heparinized or EDTA-treated blood was taken from the patients, and
* Corresponding author. Mailing address: Department of Pediatrics, Nagoya University School of Medicine, 65 Tsuruma-cho, Showa-ku, Nagoya 466-8550, Japan. Phone: 81-52-744-2303. Fax: 81-52-744-2974. E-mail: [email protected].
132
on May 15, 2020 by guest
http://jcm.asm.org/
the PBMNC and plasma were separated with Ficoll-Paque (Pharmacia Biotech, Piscataway, N.J.). For the PCR assay, the DNA was extracted from the PBMNC and plasma fraction by using a QIAamp Blood Kit (QIAGEN Inc., Chatsworth, Calif.) and stored at220°C until use.
Real-time quantitative PCR with a fluorogenic probe.The PCR primers for this assay were selected in the BALF5 gene encoding the viral DNA polymerase (1). The upstream and downstream primer sequences were 59-CGGAAGCCCT CTGGACTTC-39and 59-CCCTGTTTATCCGATGGAATG-39, respectively. A fluorogenic probe (59-TGTACACGCACGAGAAATGCGCC-39) with a se-quence located between the PCR primers was synthesized by PE Applied Bio-systems (Foster City, Calif.). The PCR reaction was performed using the Taq-Man PCR kit (PE Applied Biosystems) as previously described (14). Briefly, either 250 ng of DNA from PBMNC or the extraction solution from 50ml of plasma was added to a PCR mixture containing 10 mM Tris (pH 8.3), 50 mM KCl, 10 mM EDTA, 5 mM MgCl2, 100mM dATP, dCTP, dGTP, and dTTP, 0.2 mM each primer, 0.1mM fluorogenic probe, and 1.25 U of AmpliTaq Gold (PE Applied Biosystems). Following an activation of the AmpliTaq Gold for 10 min at 95°C, 45 to 50 cycles of 15 sec at 95°C and 1 min at 62°C were carried out by a model 7700 Sequence Detector (PE Applied Biosystems). Real-time fluores-cence measurements were taken, and a threshold cycle (CT) value for each sample was calculated by determining the point at which the fluorescence ex-ceeded a threshold limit (10 times the standard deviation of the baseline) (7). For a positive control, a plasmid that contained the BALF5 gene was constructed from pGEM-T vector (Promega, Madison, Wis.) and termed pGEM-BALF5. A standard graph of the CTvalues obtained from serially diluted pGEM-BALF5 was constructed. The CTvalues from clinical samples were plotted on the stan-dard curve, and the copy number was calculated automatically by Sequence Detector version 1.6 (PE Applied Biosystems), a software package for data analysis. Each sample was tested in duplicate, and the mean of the two values was shown as the copy number of the sample. Samples were defined as negative if the CTvalues exceeded 50 cycles.
Qualitative PCR assay.The qualitative PCR assay using nested primers was performed with slight modifications of a previously described method (37). Briefly, the outer primers, which were designed in theBamHI W region of the EBV gene (positions 1544 to 1568 for the 59primer and 1653 to 1677 for the 39 primer), were used for the first round of PCR (12). The same volume of the DNA extraction solution used for the real-time PCR assay was added to a total of 50 ml of reaction mixture containing 10 mM Tris (pH 8.3), 50 mM KCl, 1.5 mM MgCl2, 100mM dATP, dCTP, dGTP, and dTTP, 0.2mM each primer, and 1.25 U ofTaqpolymerase (TaKaRa, Ohtsu, Japan). Amplifications were carried out for 30 cycles with a PCR Thermal Cycler (TaKaRa). After the first amplification, 2 ml of the amplified products was used for the second amplification, which consisted of 30 cycles using the inner primers (positions 1572 to 1591 for the 59 primer and 1642 to 1661 for the 39primer) (12). The amplified products were separated on a 1.2% agarose gel, stained with ethidium bromide, and visualized by UV light. The qualitative PCR assay could detect two copies of a plasmid control that contained theBamHI W fragment. Since the fragment is located in internal repeats and one EBV genome contains 10 or moreBamHI fragments (12), the qualitative PCR was more sensitive than the real-time PCR assay. On the other hand, the region was not selected for the real-time quantitative assays since the number of the repeat was variable among EBV strains.
ISH assay for the detection of EBER.The ISH assay was performed using the EBER probe as previously described (9). For the ISH assay, 105separated PBMNC were spotted on silane-coated slides and dried. Each slide was hybrid-ized with the alkaline phosphatase-labeled EBER probe, washed, and reacted with 5-bromo-4-chloro-3-indoyl phosphate for visualization. Positive cells were counted and expressed as cells per 105PBMNC.
Statistical analysis.The software package Statview J 4.02 (Abacus Concepts Inc., Berkeley, Calif.) was used for data analysis. Student’sttest was used for the comparison of the mean copy numbers of EBV DNA in each group. The Pearson correlation coefficient was used to compare the real-time PCR and ISH assays.
RESULTS
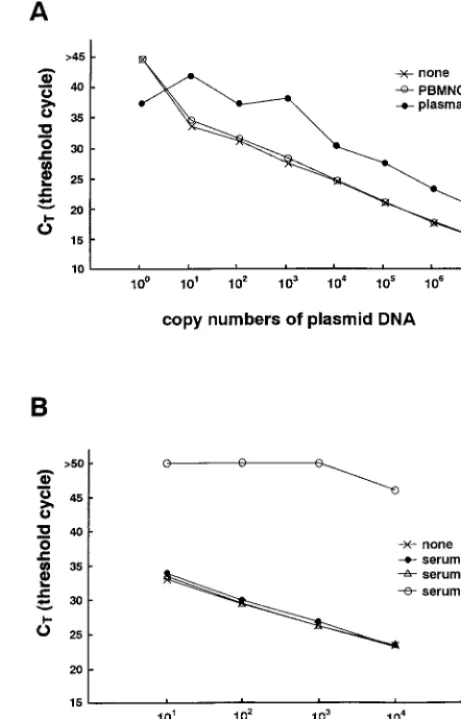
Establishment of a real-time PCR assay for quantifying EBV-DNA. Serially diluted pGEM-BALF5 was tested by the real-time PCR assay, and a standard curve of the CTvalues obtained by using the positive control was constructed. A wide linear range (beginning at 10 copies and extending through 107 copies of the control plasmid) was established (Fig. 1A). A minimum of two copies of the plasmid could be detected by the system (data not shown).
To confirm the specificity of the primers and the probe, an EBV-negative lymphoma cell line, other human herpesviruses (herpes simplex virus type 1 and 2, cytomegalovirus, varicella-zoster virus, and human herpesvirus 8), and PBMNC from EBV-seronegative patients were tested by this system. All were negative for EBV DNA. Next, we examined an EBV-positive
marmoset cell line (B95-8), two Burkitt’s lymphoma cell lines (Raji and Daudi), and four lymphoblastoid cell lines. All the cell lines were positive for EBV DNA by the real-time PCR assay. From the standard curve, the estimated number of EBV DNA genomes ranged from 5.2 to 31 per cell in these cell lines, which approximately equals the previously reported values (25).
Detection of an inhibitor in heparinized blood. Heparin inhibits the PCR (3, 16). Since some of our samples were heparinized blood, we performed reconstruction studies to confirm the removal of the inhibitor from these samples by the DNA extraction kit. Heparinized blood was taken from a pa-tient who was seronegative for EBV, and PBMNC and plasma were separated. DNA extraction solution from either the PBMNC or plasma fraction was added to serially diluted plasmid controls. The DNA-extraction solution from PBMNC did not inhibit the PCR. The solution from the plasma,
how-FIG. 1. (A) Standard curve for real-time PCR. Serially diluted pGEM-BALF5 plasmid was amplified with or without DNA extraction solutions from blood and analyzed in real time with a model 7700 Sequence Detector. The CT values were plotted against copy number to construct the standard curve. Ex-planation of symbols: none, plasmid with EBV insert; PBMNC, PBMNC from an EBV-seronegative patient plus plasmid with EBV insert; plasma, plasma from an EBV negative patient plus plasmid with EBV insert. (B) Effect of heparin on quantitation of plasmid DNA. Serially diluted plasmid controls were amplified with or without various DNA extraction solutions and analyzed using a model 7700 Sequence Detector. Explanation of symbols: none, plasmid with EBV in-sert; serum, serum from an EBV seronegative patient plus plasmid with EBV insert; serum1EDTA, serum and EDTA plus plasmid with EBV insert; se-rum1heparin, serum and heparin plus plasmid with EBV insert.
on May 15, 2020 by guest
http://jcm.asm.org/
[image:2.612.312.543.76.436.2]ever, inhibited the reaction, and the yield of amplified products decreased approximately 1- to 100-fold (Fig. 1A). For example, the CTvalue of 105copies of the plasmid in the plasma fraction approximately equaled that of 107copies of the plasmid alone. To confirm that the residual heparin in the plasma was the inhibitor, the DNA extraction solutions from serum, serum plus EDTA, and serum plus heparin were examined in the reconstruction study. EDTA or heparin was added to EBV-free serum at the standard concentrations used for anticoagu-lation (final concentrations, 3 mM and 25 U/ml, respectively). The DNA extraction kit was used in an attempt to remove these anticoagulants, and each extraction solution was mixed with the plasmid control. Only the serum-plus-heparin sample inhibited the PCR reaction (Fig. 1B). These results indicate that the heparin is the inhibitor and could not be removed from the plasma. The results also show that the real-time quantitative PCR assay is useful for determining the presence of inhibitors.
Quantitation of EBV DNA in patients with symptomatic EBV infection.Next, we estimated the virus load in blood from patients with symptomatic EBV infections by the real-time PCR assay. Since the reconstruction study indicated that plasma from heparinized blood was unsuitable for the quanti-tation and blood from most patients with symptomatic EBV infections was drawn with heparin, PBMNC were used for the analysis. The mean number of EBV DNA genomes in the PBMNC was 103.7 copies/mg of DNA in patients with LPD, 104.1 copies/mg of DNA in patients with CAEBV, and 102.2 copies/mg of DNA in patients with IM (Fig. 2). These numbers were significantly larger than those for posttransplant patients without EBV-related diseases (101.3 copies/mg of DNA;P, 0.0001 for LPD and CAEBV,P50.02 for IM) or in immu-nocompetent and EBV-seropositive controls (101.2copies/mg of DNA;P,0.0001 for LPD and CAEBV,P50.004 for IM). Sequential samples from a 19-year-old female with IM were obtained and tested using the real-time PCR assay. Since the patient’s blood was drawn with EDTA, which did not interfere with the reaction, both PBMNC and plasma were used for the assay. The virus load decreased as the symptoms resolved (Fig. 3).
Specificity of real-time PCR assay. We hypothesized that 102.5copies permg of PBMNC DNA were enough to diagnose
[image:3.612.150.454.74.250.2]symptomatic EBV infections, because all the patients with LPD and CAEBV had more copies of the EBV DNA genome than this number (Fig. 2). A total of 60 samples were used to evaluate the diagnostic performance of the real-time PCR as-say. When 102.5copies permg of PBMNC DNA was used as a criterion to diagnose symptomatic EBV infections, the real-time PCR assay was highly specific (both the specificity and the positive predictive value were 93%, as shown in Table 1). Next, this new quantitative method was compared with a qualitative method using conventional PCR. Blood samples tested by the real-time PCR assay were also evaluated by the qualitative PCR assay using PBMNC fraction, plasma fraction, or both. The qualitative PCR assay using PBMNC was very sensitive but its specificity was low because the assay was so sensitive that latent EBV in the PBMNC was detected in individuals without EBV-related diseases (Table 1). On the other hand, when plasma was used for the qualitative PCR assay, the assay was specific and as diagnostic as the real-time PCR assay (both the specificity and the positive predictive value were 92%, as
FIG. 2. Quantitation of EBV DNA by real-time PCR. DNA was extracted from PBMNC obtained from patients with symptomatic EBV infections or control patients without EBV-related diseases. Two hundred fifty nanograms of DNA was used for the real-time PCR assay, and the EBV DNA copy numbers per microgram of DNA are shown. Multiple samples for some patients were tested because repeated evaluations were needed. Bars show the means and standard deviations for each group. The dotted line shows the detection limit of the assay.
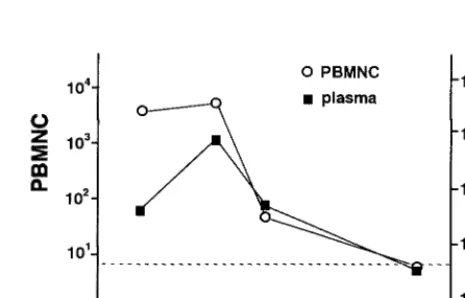
FIG. 3. Change in the virus load in a patient with IM. Sequential samples from a patient with IM were obtained, and both the PBMNC and plasma were analyzed by the real-time PCR assay. The EBV DNA copy numbers are shown per microgram of DNA. The EBV DNA copy numbers are shown per milliliter of plasma. The dotted line shows the detection limit for each sample.
on May 15, 2020 by guest
http://jcm.asm.org/
[image:3.612.315.548.536.685.2]shown in Table 1). This result agreed with our previous find-ings (37).
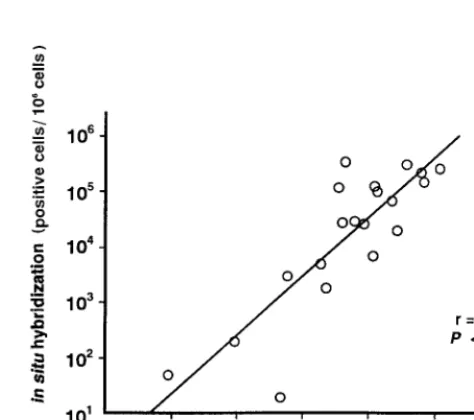
To demonstrate the accuracy of the real-time PCR assay, we compared it with another quantitative method, the ISH assay. PBMNC from patients with symptomatic EBV infections were used for both the real-time PCR and ISH assays. The copy numbers of EBV DNA measured by the real-time PCR assay were highly correlated with the EBV-positive cell numbers by the ISH assay (r50.842;P,0.0001 [Fig. 4]). Taken together with the comparison with the qualitative PCR assay, these results showed that the real-time PCR assay was a sufficiently sensitive and specific method for diagnosing symptomatic EBV infections and for monitoring of the virus load.
DISCUSSION
Real-time laser scanning coupled with a fluorogenic probe is a new technique which enables us to quantify a large number of amplified products rapidly and accurately (7, 35). Using this system, it is possible to analyze more than 40 samples in 2 to 3 h even if they are tested in duplicate. We showed that this system was applicable to the quantitation of EBV load in patients with symptomatic EBV infections. This technique de-tected PCR inhibitors and estimated the efficiency of the ex-traction methods, both of which are particularly important to quantify the EBV load accurately and reproducibly. Further-more, this system eliminates the precautions that must be taken with amplified products to avoid contamination because the technique is performed in completely sealed wells. This is a great improvement over the conventional PCR assays, which have considerable risks of carryover contamination. With its rapidness, accuracy, and ability to handle many samples, the real-time PCR assay should replace the quantitative PCR methods now in use.
It has been shown that heparin is an inhibitory factor for PCR (3, 16). Using the real-time PCR assay, we showed that heparin was not eliminated from plasma by using standard DNA extraction methods and that the yield of amplified prod-ucts decreased 1 to 100 times. Heparin did not inhibit PCR when PBMNC were used as the templates, probably because any heparin was washed out from the PBMNC during the separation with Ficoll-Paque. In this study, we used the PBMNC fractions for most of the quantitation because of lack of inhibition. As EBV remains latent in lymphocytes, the PBMNC fraction is usually used to estimate the virus load in peripheral blood. In primary or chronic active infections, cell-free virus is produced and released from cells in lytic cycles (25). We and others have previously reported that the presence of EBV-DNA in the plasma is diagnostic of primary EBV
infection (4, 37), which was confirmed in the present study. Since serum and plasma are readily obtained, they may be better sources for the quantitation of the virus load. Serum and EDTA-treated plasma can be used because they do not inhibit the PCR. If only heparinized blood is available, heparinase is reported to be useful for eliminating heparin from the DNA extraction solution (16, 21).
[image:4.612.52.292.100.165.2]Since even healthy individuals have latent EBV in their blood, the presence of EBV genomes does not always indicate an active EBV infection or EBV-related disease. For the di-agnosis of EBV-related diseases, a significant virus load should be defined. When we used 102.5copies/mg of PBMNC DNA as the criterion, the real-time PCR assay was specific enough to diagnose symptomatic EBV infections. All the patients with LPD and CAEBV had more than 102.5copies/mg of DNA (Fig. 2). In contrast, 2 of 14 (14%) posttransplant patients without these disease manifestations had levels higher than 102.5 cop-ies/mg of DNA (Fig. 2). To our knowledge, only two papers have defined the significant virus load in symptomatic EBV infections, and both of them stated that 500 copies/105cells is sufficient to diagnose LPD (26, 29). In this study, we quantified the amount of DNA extracted from PBMNC and used a fixed amount of DNA in the real-time PCR assay (250 ng). Using a set volume of the DNA extraction solution from a fixed num-ber of PBMNC is simpler but may produce a bias caused by differences in the extraction efficiency for each sample. If 105 lymphocytes produce 0.5mg of DNA as suggested in the man-ufacturer’s handbook (QIAamp Blood Kit; QIAGEN), then 500 copies/105PBMNC equals 103.0copies/mg of DNA, which is slightly greater than our criterion, 102.5copies/mg of DNA. Accordingly, we consider 102.5copies/mg of DNA a suitable cutoff level for distinguishing EBV-related LPD or CAEBV from latent EBV infections or asymptomatic reactivation of the virus. Some patients with IM had fewer copies of EBV DNA than 102.5copies/mg of DNA. Patients with IM may have less virus load in their peripheral blood compared with patients with CAEBV or LPD. Therefore, it might be inappropriate to
[image:4.612.312.549.466.676.2]FIG. 4. Correlation of results of the real-time PCR and in situ hybridization assays. PBMNC were obtained from patients with symptomatic EBV diseases, and 20 samples were analyzed using both the real-time PCR and ISH assays. The copy numbers of DNA measured by the real-time PCR assay and EBV-positive cell numbers measured by the ISH assay were plotted, and the correla-tion coefficient (r) was calculated.
TABLE 1. Performance of a real-time PCR assay for diagnosing symptomatic EBV infections and comparison
with a qualitative PCR assay
Assay type samplesNo. ofa Sensitivity(%) Specificity(%) PVPositiveb(%) NegativePVb(%)
Real-time PCRc 60 85 93 93 83
Qualitative PCR
PBMNC 51d 100 57 69 100
Plasma 54d 82 92 92 83
aSamples were obtained from either patients with symptomatic EBV
infec-tions (33 samples) or control patients without EBV-related diseases (27 sam-ples).
bPV, predictive value.
c102.5copies permg of PBMNC DNA was regarded as the creiterion to diag-nose symptomatic EBV infections.
dSome samples were not available for the qualitative PCR assays.
on May 15, 2020 by guest
http://jcm.asm.org/
use the above criterion for the diagnosis of IM. The other possible reason that the IM patients had fewer EBV DNA copies may be that some of these samples had been stored for more than 5 years.
In patients who have had a bone marrow or solid organ transplant, LPD is an acute, life-threatening disease. Its diag-nosis is sometimes difficult, and the disease often progresses rapidly (5, 11). LPD is usually resistant to both chemotherapy and antiviral drugs (32). However, recent papers report that infusions of donor leukocytes or EBV-specific CTL are useful for the treatment of LPD (8, 20, 28). Rooney et al. stress the importance of early or preemptive administration of EBV-specific CTL in treating LPD (27). We believe that the real-time PCR assay is a useful method for the rapid diagnosis of LPD and for monitoring the virus load to evaluate the efficacy of treatment.
REFERENCES
1.Baer, R., A. T. Bankier, M. D. Biggin, et al.1984. DNA sequence and expression of the B95-8 Epstein-Barr virus genome. Nature310:207–211. 2.Bai, X., G. Hosler, B. B. Rogers, D. B. Dawson, and R. H. Scheuermann.
1997. Quantitative polymerase chain reaction for human herpesvirus diag-nosis and measurement of Epstein-Barr virus burden in posttransplant lym-phoproliferative disorder. Clin. Chem.43:1843–1849.
3.Beutler, E., T. Gelbart, and W. Kuhl.1990. Interference of heparin with the polymerase chain reaction. BioTechniques9:2–3.
4.Gan, Y. J., J. L. Sullivan, and J. W. Sixbey.1994. Detection of cell-free Epstein-Barr virus DNA in serum during acute infectious mononucleosis. J. Infect. Dis.170:436–439.
5.Gratama, J. W.1994. Epstein-Barr virus infections in bone marrow trans-plantation recipients, p. 429–442.InS. J. Forman, K. G. Blume, and E. D. Thomas (ed.), Bone marrow transplantation. Blackwell Scientific Publica-tions, Boston, Mass.
6.Hanto, D. W., G. Frizzera, K. J. Gajl-Peczalska, K. Sakamoto, D. T. Purtilo, H. Balfour, Jr., R. L. Simmons, and J. S. Najarian.1982. Epstein-Barr virus-induced B-cell lymphoma after renal transplantation: acyclovir therapy and transition from polyclonal to monoclonal B-cell proliferation. N. Engl. J. Med.306:913–918.
7.Heid, C. A., J. Stevens, K. J. Livak, and P. M. Williams.1996. Real time quantitative PCR. Genome Res.6:986–994.
8.Heslop, H. E., C. Y. Ng, C. Li, C. A. Smith, S. K. Loftin, R. A. Krance, M. K. Brenner, and C. M. Rooney. 1996. Long-term restoration of immunity against Epstein-Barr virus infection by adoptive transfer of gene-modified virus-specific T lymphocytes. Nat. Med.2:551–555.
9.Hironaka, T., M. Nagasaki, S. Morikawa, and K. Hirai.1993. Detection of Epstein-Barr virus transcripts in chemically or immunologically-activated cells and in a null cell-line (HLN-STL-C) by in situ hybridization with alkaline phosphatase-linked oligonucleotide probes. J. Virol. Methods44:
141–154.
10. Imai, S., M. Sugiura, O. Oikawa, et al.1996. Epstein-Barr virus (EBV)-carrying and -expressing T-cell lines established from severe chronic active EBV infection. Blood87:1446–1457.
11. Imashuku, S., T. Goto, T. Matsumura, M. Naya, M. Yamori, M. Hojo, S. Hibi, and S. Todo.1997. Unsuccessful CTL transfusion in a case of post-BMT Epstein-Barr virus-associated lymphoproliferative disorder (EBV-LPD). Bone Marrow Transpl.20:337–340.
12. Jones, M. D., and B. E. Griffin.1983. Clustered repeat sequences in the genome of Epstein-Barr virus. Nucleic Acids Res.11:3919–3937. 13. Kimura, H., I. Tsuge, S. Imai, M. Yamamoto, K. Kuzushima, T. Osato, and
T. Morishima. 1995. Intact antigen presentation for Epstein-Barr virus (EBV)-specific CTL by a lymphoblastoid cell line established from a patient with severe chronic active EBV infection. Med. Microbiol. Immunol.184:
63–68.
14. Kimura, H., Y. Wang, L. Pesnicak, J. I. Cohen, J. J. Hooks, S. E. Straus, and R. K. Williams.1998. Recombinant varicella-zoster virus glycoproteins E and I: immunologic responses and clearance of virus in a guinea pig model of chronic uveitis. J. Infect. Dis.178:310–317.
15. Kuzushima, K., M. Yamamoto, H. Kimura, Y. Ando, T. Kudo, I. Tsuge, and T. Morishima.1996. Establishment of anti-Epstein-Barr virus (EBV) cellular immunity by adoptive transfer of virus-specific cytotoxic T lymphocytes from an HLA-matched sibling to a patient with severe chronic active EBV infec-tion. Clin. Exp. Immunol.103:192–198.
16. Lin, H. J., T. Tanwandee, and F. B. Hollinger.1997. Improved methods for quantification of human immunodeficiency virus type 1 RNA and hepatitis C virus RNA in blood using spin column technology and chemiluminescent
assays of PCR products. J. Med. Virol.51:56–63.
17. Morita, M., I. Tsuge, H. Matsuoka, Y. Ito, T. Itosu, M. Yamamoto, and T. Morishima.1998. Calcification in the basal ganglia with chronic active Ep-stein-Barr virus infection. Neurology40:1485–1488.
18. Nakazawa, Y., H. Chisuwa, T. Ikegami, Y. Hashikura, H. Matsunami, T. Ichikawa, T. Oh-ishi, and S. Kawasaki.1997. Efficacy of quantitative analysis of Epstein-Barr virus-infected peripheral blood lymphocytes by in situ hy-bridization of EBER1 after living-related liver transplantation: a case report. Transplantation63:1363–1366.
19. Okano, M., S. Matsumoto, T. Osato, Y. Sakiyama, G. M. Thiele, and D. T. Purtilo.1991. Severe chronic active Epstein-Barr virus infection syndrome. Clin. Microbiol. Rev.4:129–135.
20. Papadopoulos, E. B., M. Ladanyi, D. Emanuel, et al.1994. Infusions of donor leukocytes to treat Epstein-Barr virus-associated lymphoproliferative disorders after allogeneic bone marrow transplantation. N. Engl. J. Med.
330:1185–1191.
21. Pardoe, I. U., and T. I. Michalak.1995. Detection of hepatitis B and wood-chuck hepatitis viral DNA in plasma and mononuclear cells from heparin-ized blood by the polymerase chain reaction. J. Virol. Methods51:277–288. 22. Purtilo, D. T., R. S. Strobach, M. Okano, and J. R. Davis.1992. Epstein-Barr
virus-associated lymphoproliferative disorders. Lab. Investig.67:5–23. 23. Randhawa, P. S., R. Jaffe, A. J. Demetris, M. Nalesnik, T. E. Starzl, Y. Y.
Chen, and L. M. Weiss.1992. Expression of Epstein-Barr virus-encoded small RNA (by the EBER-1 gene) in liver specimens from transplant recip-ients with post-transplantation lymphoproliferative disease. N. Engl. J. Med.
327:1710–1714.
24. Rickinson, A. B.1986. Chronic, symptomatic Epstein-Barr virus infection. Immunol. Today7:13–14.
25. Rickinson, A. B., and E. Kieff.1996. Epstein-Barr virus, p. 2397–2446.In B. N. Fields, D. M. Knipe, and P. M. Howly (ed.), Virology. Lippincott-Raven Publishers, Philadelphia, Pa.
26. Riddler, S. A., M. C. Breinig, and J. L. McKnight.1994. Increased levels of circulating Epstein-Barr virus (EBV)-infected lymphocytes and decreased EBV nuclear antigen antibody responses are associated with the develop-ment of posttransplant lymphoproliferative disease in solid-organ transplant recipients. Blood84:972–984.
27. Rooney, C. M., S. K. Loftin, M. S. Holladay, M. K. Brenner, R. A. Krance, and H. E. Heslop.1995. Early identification of Epstein-Barr virus-associated post-transplantation lymphoproliferative disease. Br. J. Haematol.89:98– 103.
28. Rooney, C. M., C. A. Smith, C. Y. Ng, S. Loftin, C. Li, R. A. Krance, M. K. Brenner, and H. E. Heslop.1995. Use of gene-modified virus-specific T lymphocytes to control Epstein-Barr-virus-related lymphoproliferation. Lan-cet345:9–13.
29. Rowe, D. T., L. Qu, J. Reyes, N. Jabbour, E. Yunis, P. Putnam, S. Todo, and S. Green.1997. Use of quantitative competitive PCR to measure Epstein-Barr virus genome load in the peripheral blood of pediatric transplant patients with lymphoproliferative disorders. J. Clin. Microbiol.35:1612– 1615.
30. Savoie, A., C. Perpete, L. Carpentier, J. Joncas, and C. Alfieri.1994. Direct correlation between the load of Epstein-Barr virus-infected lymphocytes in the peripheral blood of pediatric transplant patients and risk of lymphopro-liferative disease. Blood83:2715–2722.
31. Straus, S. E.1988. The chronic mononucleosis syndrome. J. Infect. Dis.
157:405–412.
32. Straus, S. E., J. I. Cohen, G. Tosato, and J. Meier.1993. NIH conference. Epstein-Barr virus infections: biology, pathogenesis, and management. Ann. Intern. Med.118:45–58.
33. Swerdlow, S. H.1992. Post-transplant lymphoproliferative disorders: a mor-phologic, phenotypic and genotypic spectrum of disease. Histopathology
20:373–385.
34. Wang, A. M., and D. F. Mark.1990. Quantitative PCR, p. 70–75.InM. A. Innis, D. H. Gelfand, J. J. Sninsky, and T. J. White (ed.), PCR protocols. Academic Press, Inc., San Diego, Calif.
35. Williams, P. M., S. J. Williams, C. Schwer, A. S. Krishnarao, C. Heid, B. L. Karger, and P. M. Williams.1996. Real time quantitative PCR. Quantitative competitive polymerase chain reaction: analysis of amplified products of the HIV-1 gag gene by capillary electrophoresis with laser-induced fluorescence detection. Genome Res.6:146–152.
36. Williams, S. J., C. Schwer, A. S. Krishnarao, C. Heid, B. L. Karger, and P. M. Williams.1996. Quantitative competitive polymerase chain reaction: analysis of amplified products of the HIV-1 gag gene by capillary electro-phoresis with laser-induced fluorescence detection. Anal. Biochem.236:146– 152.
37. Yamamoto, M., H. Kimura, T. Hironaka, K. Hirai, S. Hasegawa, K. Ku-zushima, M. Shibata, and T. Morishima.1995. Detection and quantification of virus DNA in plasma of patients with Epstein-Barr virus-associated dis-eases. J. Clin. Microbiol.33:1765–1768.