Reduction of Non-Revenue Water (NRW) in
Trincomalee Town – A Case Study
Luxmanan Subaharan*
*Planning & Coordination Section, National Water Supply & Drainage Board
DOI: 10.29322/IJSRP.9.09.2019.p9302 http://dx.doi.org/10.29322/IJSRP.9.09.2019.p9302
Abstract - Trincomalee town, being located in the dry zone of Sri Lanka, cannot be considered a water-stressed area. However, there is an ever-increasing demand for drinking water supply due to the increase in population and the rapid development of the area. Trincomalee town receives 11,250 m3/d of treated water out of which 39% is recorded as NRW. Trincomalee town recorded
a comparatively high percentage of Non-Revenue Water (39%) in the region mainly due to the deteriorated distribution system and associated problems. Most of the pipelines in the distribution system are encrusted and experience frequent leakages which resulted in low pressure zones. This situation created consumer dissatisfaction and development restriction in the area. In this thesis the author discusses the NRW reduction for the effective water loss management and shows how such benefits can be achieved by applying the developed methodologies to a pilot area of the town.
The Author obtained knowledge of various methods by research papers from various seminars and donor agencies. Analysis of the Trincomalee town Water Distribution System showed that 41% of the pipe network is over 30 years old and about 57% of the pipes were over 10 years old. The major factors contributing to NRW are leakages, illegal consumption and administration losses such as estimated bills, water meter errors, human errors etc.
Under the pilot scale study, initially the main causes of NRW were identified and more attention was paid to the most significant causes. After studying various strategies, part to whole method was selected as more appropriate to reduce NRW in the pilot area. Accordingly small areas or road stretches were isolated and causes that create NRW were reduced. Implementation of this exercise to cover the entire pilot area helped to reduce NRW by a considerable quantity.
The aim of the research was to reduce of NRW for the effective water loss management. The method adopted for water loss management is different from country to country, city to city and place to place depending on availability and institutional frame work etc. The short and long term strategies developed for water loss management for Trincomalee town could be applied to similar towns in developing countries.
Index Terms – Non Revenue Water (NRW), Distribution Network, Water Losses, Water Balance
I. INTRODUCTION
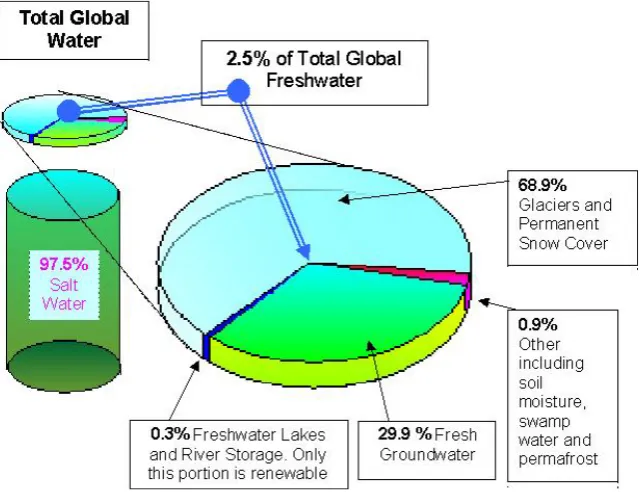
Fig. 1.1 Global Freshwater Availability (ref.IgorA.Shiklomanov, 1998)
The water scarcity situation will get worse in the world’s urban areas where over 50% of the world’s population live. Between 2000 and 2030, it is projected that there will be an increase of urban population of 2.12 billion, with over 95% of this increase expected to be in low – income countries (UN – HABITAT’s state of the world’s cities report 2006/2007).Parallel with this growth in population, the demand for drinking water has been increasing rapidly in urban areas of developing countries.
The WHO report of global annual assessment of sustainable and drinking water 2008 shows spreading of recent demarcation of water stress situation which shows in fig.1.2.Accordingly, current situation is not favourable that most part of the world suffered without access to drinking water and this will continue to be worst in next millennium. Hence it is important to pay more attention to avoid such situation for betterment of the society.
In the year 2006, 0.9 billion people of the world population were without access to safe drinking water supply from 1990 to 2006 approximately 1.56 billion people gained access to improved water facilities. Accordingly, 87% of world population used drinking water from improved sources as compared to 77% in the year 1990.
In 2002, 82% of the Asia and pacific region had gained access to improved water supplies and the increase of approximately 758 million people since 1990.In Sri Lanka access to improved water supplies in urban are 90% and rural 72% and island wide 78%.The millennium development Goal (MGD) target for improved safe drinking water supply is to have Rural 90% and urban 100% of the population in Sri Lanka by the year 2015 (Millennium Project 2005) Source “Asia water watch 2015 – WHO”. However, by end of year 2015, 84.1% of the population has safe access to drinking water of which 43.5% is through piped water supply systems and 40.6% is through rural water supply systems.
Water losses in distribution system (33% NRW) where National Water Supply & Drainage Board (NWS&DB) maintain the schemes in Sri Lanka are at reasonable level among South Asian Countries. Non-Revenue Water (NRW 39%) in Trincomalee town has one of the highest value in the region. Trincomalee town has one of the comparatively oldest distribution systems in Sri Lanka. By reviewing the distribution system originally it had good system but periodical rehabilitation has not taken place and only day to day maintenance existed. Due to this passive management system, the following deficiencies are created at present as tabulated in fig.1.2.
L o w P res su re Unreliable service Loss of institutional Image Frequent Tariff increase Water Source Stress Consumer dissatisfaction L o ss O f R ev en u e
System Leaks Illegal Consumption
Frequent
Breakdowns Estimated Bills
Meter Defects
Problems with Passive Water Distribution Management
Meter Errors
Meter Reading
Cycle Errors Meter Readers Malpractices
Uneven Water Supply
Free Water
Supply Data Entry Errors Limited Water Supply
Infrastructure Damages Need High Capital Investments Water Contamination High Production Cost Energy Wastage
Fig 1.2: Problems with Conventional Water Distribution Management Source: NWS&DB
Reduction of NRW had been given less attention in early days in the water supply sector in Sri Lanka due to freely available raw water and less pollution. However, nowadays, the reduction of NRW has become a very important factor due to two main reasons, such as high production cost and drinking water source scarcity. Simultaneously much attention has been given to provide reliable service and consumer satisfaction. With these concepts passive management system has changed to active management system with more attention has been paid for distribution management with investment on rehabilitation to achieve following as tabulated in fig 1.3.
Q u a lit y W a te r Good Institutional Image Differ Tariff Increase Less Illegal
Consumption Consumer Appreciations
E n er g y Sa v ing
Less Pipe Damage Meter Reading cycle errors
Provide only essential free water supply
Less Water Source Stress 24/7 Water Supply Sustainable Active Water Distribution
Management
Less Complaint Less Data Entry Errors Appropriate Water Meter Use Differ Capital Investments Satisfactory
Pressure Low Production Cost
Increased Revenue
Reliable Service
Therefore, the water loss management can provide sustainable access to safe drinking water and achieve the MGDs (Target 10 of goal 7) of ensuring environmental sustainability. As such, water loss management is one of the main strategies to improve accessibility and reliability of water supply for the majority of residents in developing countries.
In Sri Lanka, water stress situation has not been experienced but other associated environmental problems are common due to rapid urbanization, deforestation and population increase. In general, water is difficult to purify, expensive to transport impossible to substitute, hence it is important to discuss about the effective distribution of drinking water in a pipe borne water supply system with minimum wastage.
II. OBJECTIVES OF THE STUDY
The broad objective of the study is to improvement of pipe borne water supply by reduction of distribution losses in Trincomalee town (A case study).
Specific Objectives:
The following specific objectives have been identified to achieve these goals:
• To evaluate the Trincomalee town water supply distribution management system and re -arrange the same with appropriate strategy to handle NRW
• To evaluate and characterize the water loss in the distribution system
• To develop short and long term strategies for the reduction of water losses in the distribution system to suit local conditions.
III. LITERATURE REVIEW
In February 2010, S.S.Devaraja has made a study on “Identification of a Methodology for reduction of Non-Revenue Water & Improvement of pipe borne water service in Colombo city”. In this report the author study and analyse in depth the problem of Non-Revenue Water (NRW) in Greater Colombo distribution system and also discuss the reasons for the highest percentage (56%) in Colombo city and selection of appropriate methodology for water loss management.
In 2008, “Assessment of Non Revenue Water in Hantana Water Supply Scheme” was done by L.L.A.Peiris, N.D.K.Dayawansa and R.P.De Silva. In this report, a detail NRW reduction programme was carried out during October 2006 and May 2007 to determine and reduce the NRW of Hantana WSS. The average NRW in Hantana WSS is 36.12% where the real and apparent water losses are 9.18% and 26.94% respectively. According to the findings, rectification of water leakages does not significantly reduce the NRW of Hantana WSS.
Further studies has been done by ADB’s Technical Assistance Consultant’s namely “Sri Lanka: Capacity Development for Non-Revenue Water Reduction Project” for the Ministry of Urban Development, Water Supply and Drainage in February 2014.
Also, the studies on NRW reduction techniques were carried out in various countries/cities to reduce NRW within the specified target as mentioned in Table 2.1.
City or Country Current NRW (%) Specified Target
Colombo 56 NRW under 40%
Hantana WSS 36.12 NRW under 30%
Malaysia 36.4 NRW under 25%
Italy 30 to 40 Acceptable long term NRW 15%
Korea 29.3 NRW under 15%
Finland 12 to 25 NRW under 10%
Hong Kong 30.5 Real Losses 16% in 20 years
Bangkok 38.8 NRW not to exceed 30%
Table 2.1: NRW as % of System Input Volume against the Specified target – A.O Lambert (2001)
Definition of Non – Revenue Water (NRW):
The NRW define as the quantity of water that does not earn revenue to the organization, expressed as a percentage of the net production. The major cause for NRW are water leakage, illegal consumption, administrative losses, legitimate free water uses such as un – metered supplies, fire fighting, stand post supplies etc. Percentage of NRW can be expressed as,
𝑁𝑁𝑁𝑁𝑁𝑁=�𝑄𝑄𝑆𝑆𝑆𝑆𝑆𝑆𝑆𝑆𝑆𝑆𝑆𝑆− 𝑄𝑄𝑄𝑄 𝐵𝐵𝐵𝐵𝑆𝑆𝑆𝑆𝐵𝐵𝐵𝐵𝐴𝐴𝐴𝐴𝐴𝐴𝑆𝑆𝐴𝐴𝐴𝐴
𝑆𝑆𝑆𝑆𝑆𝑆𝑆𝑆𝑆𝑆𝑆𝑆 � 𝑥𝑥 100
IV. METHODOLOGY
To identify the methodology to reduce NRW, a pilot project was implemented in zone 01 located in the southern part of Trincomalee town. Also, this area was selected for the pilot study because all three communities are residing and the area was easily isolated and a flow meter was installed to measure the inflows. This area include of 2,107 water connections. Studies commenced with assessment of initial NRW.
According to literature review, there are several methods available to reduce water losses in distribution systems. However most of the methods are not favourable to the local situations. Therefore, pilot scale studies were initiated at very basic level with house to house survey to find out causes for water losses. This strategy was conducted with the help from trained technical staff such as site OIC and Engineering Assistants under my supervision to identify illegal connections and service leaks. Meter accuracy with scaled one litre bottle, defective meter replacement, finding reasons for estimated bills and their solutions, identifying appropriate method to get meter readings from house closed premises etc.
Further, leak survey was planned to identify visible leaks by the same studies groups. In addition, to the day time leakages, most of the leaks are visualized and during night and at the same time pipe leakages at culvert crossings were examined by special teams with instruments.
Night leak survey was implemented and step testing was carried out section – wise to identify heavy leakage areas.
Steps of Research Methodology
S.No Steps Activities performed
01 Desktop study
Detailed literature review on existing distribution
network of Trincomalee town at Regional
Manager’s Office. This was done before the field
studies and which was done between June –
December 2015
02 Analysis of existing datas
Analysis of reports, policy documents,
procedures, zone isolation, identification of bulk
meters etc. This also was done between June –
December 2015
03 Identification of sub zones
By using digital distribution map, Trincomalee
town is divided into 05 zones for which each
zone can be easily look after by one officer with
two gangs. This was done during desktop study
04 Identification of pilot study area
Pilot study area was identified using the digital
distribution map and having the natural
boundaries in order to isolate the area clearly and
a flow meter will be installed
05 Field Observations
The field observations were carried out between
January 2016 to June 2016. Two groups were
fielded headed by a EA from Regional Manager’s
office under my direct supervision. The other
facilities such as vehicle, labours, and stationeries
were provided by NWS&DB.
06 Data Analysis
Data Analysis and Calculations were done to
evaluate the state of NRW and modifications
were made then and there to improve NRW.
Improvement made was again evaluated for
V. OBSERVATIONS & DATA ANALYSIS
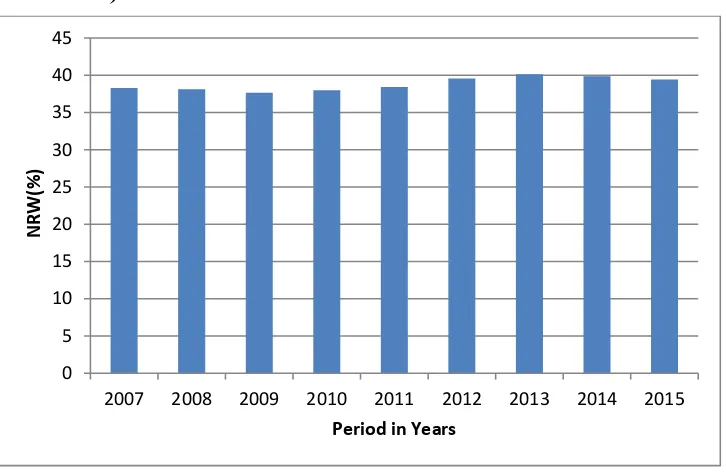
By reviewing of actual NRW in Trincomalee town, it has been noted that the gradual increase and no significant difference between the figures over the past 5 years period. Increasing water demand met with increasing supply quantity as conventional method of finding solution for low pressure zones. When the loss management is taken into account, this is not the best practice because this will result not only in wastage of water but also cause damage the infrastructure due to leakages.
NRW
(%)
Year
2007 2008 2009 2010 2011 2012 2013 2014 2015
[image:6.595.118.481.259.497.2]38.29 38.11 37.67 37.98 38.44 39.56 40.15 39.89 39.45
Table 4.8:Non-Revenue Water in Trincomalee town from 2007 to 2015
[image:6.595.72.523.656.776.2](Source: NWS&DB Past Records)
Fig 4.8: Non-Revenue Water in Trincomalee town from 2007 to 2015
Water Balance
Practicing of the IWA format for water balance analysis is the first step in getting started with a water loss reduction programme. Knowing various components of consumption and losses will give an idea of where the losses are occurring and it magnitude. This will help to identify key resulted areas with priority order to give more weight age to reduce water losses. Hence the calculations help to estimate value of leakage and derive a leakage management programme.
Components of the water balance for Trincomalee town distribution in year 2015 (water volumes in m3/year) are illustrated figure
4.10.
System input volume 2,895,693
100% (+/- 3%)
Authorized consumption 2,076,510 71% (+/- 4%)
Billed Authorized Consumption 1,766,372 61% (+/- 4%)
Revenue Water 1,766,372 61% (+/- 4%)
Unbilled Authorized Consumption 310,138 10 % (+/-5%)
Non-Revenue Water (NRW) 1,120,321
39% (+/-4%) Water Loss Apparent Losses
0 5 10 15 20 25 30 35 40 45
2007 2008 2009 2010 2011 2012 2013 2014 2015
NRW
(%
)
810,183 29% (+/-5%)
[image:7.595.69.524.53.119.2]260,612 9% (+/- 2.4%) Real Losses 549,571 20% (+/-5%)
Fig 4.10: Water Balance in Trincomalee town in year 2015
VI. CONCLUSIONS AND RECCOMMENDATIONS
After the comprehensive study carried out about water loss management with literature review and data analysis which helped to gain a sound knowledge about the subject and the Trincomalee town water distribution system, the following conclusions could be drawn and recommendations made to improve the NRW and the service level in Trincomalee city water facilities to provide customer satisfaction.
Conclusions:
At present, NRW of Trincomalee town water supply is relatively high compared to other similar cities in the region. The main causes of NRW in Trincomalee town is water leaks followed by illegal connections & illegal re-connection , un-recording customer meters, defective meters, estimated bills and inaccuracy/inconsistency in meter reading. The age of the distribution network also made significant impact on high NRW.
A pilot study was conducted within the isolated manageable area with limited number of connections or one feeding point which is one of the best practices of conduct water loss management suitable to any city in the world.
Based on the pilot study, it reveals that, to get the effective water loss management, awareness and commitment of all NWSDB staff members, from top to bottom are very important. Further, awareness of consumers too is essential to get information about illegal consumption, defective meters and water leakages etc.
Recommendations:
Based on the study, it is recommended that:
1. In the short term strategies to be implemented to reduce water losses are: a) Implement water balance by using IWA mechanism
b) Implement zonal management system
c) At least to physically monitor with water consumption according to the number of houses, since it is difficult to isolate areas due to lack of information about the system layouts etc.
d) Implement night visible programme by using zone officers e) Introduce proposed meter reader rotation system within the zone
f) Identify high income connections and installed high accuracy water meters
g) Outsource possible maintenance work and pay more attention for preventive maintenance programme, monitoring of activities and active leak control works
h) Improve repair techniques and workmanship with adopting training programmes i) Carry out map updating with field data
j) Conduct programs for Re-training of staff on improved and latest methods of water loss management k) Identify key areas and implement monitoring programme accordingly
2. In order to achieve significant gains in reducing and managing water losses, the following long term strategies for Trincomalee town need to be carried out:
a) Policy to be developed to have minimum pipe lines in a road with consideration for further developments and high excavation cost such as limiting to two rider mains each side of the road and feeder and trunk mains b) Policy to be developed to provide individual connections from rider mains
c) Smaller diameter deteriorated pipes to be replaced d) Development of distribution model and calibration
e) Feeding areas of Andankulam reservoirs to be isolated by rearranging distribution system f) Establishment of DMAs with limited number of connections
g) Map updating by using modern technologies such as CTC cameras, metal detectors, non-metallic detectors etc. to identify unknown branches
3. IT enabled system in the NWS&DB should be developed to accommodate IWA water balancing mechanism and derive and present performance indicators such as UARL and ILI to evaluate the condition of distribution system.
4. Benchmarking of Regional Manager’s office, Area Engineer’s office and each OIC offices with selected parameters such as per m3 revenue, staff per 1,000 connections, collection efficiency, debtage, supply per connection, NRW etc. is vital in
order to motivate the management and staff to improve them.
VII. REFERENCES
1. ADB, Sri Lanka: Capacity Development for Non-Revenue Water Reduction Project, NRW Specialists Pty Ltd, Australia, February 2014. 2. Allan Lambert and Richard Taylor, Water Loss Guidelines, February 2010.
3. David Micheal Delgado, Infrastructure Leakage Index (ILI) as a Regulatory and Provider Tool, 2007/2008. 4. District Secretariat, Kachcheri, Trincomalee, Performance Report and Accounts, 2014.
5. Gary Lange, Domestic Water Meters – Characteristics and Applications.
6. Graham MacDonald and Carl D Yates, DMA Design and Implementation, a North American Context, 2005.
7. Igor A.Shiklomanov, World Water Resources, State Hydrological Institute (SHI), St.Petersburg, Russia and UNESCO (Paris), 1998). 8. Julian Thornton, Reinhard Sturm and George Kunkel, P.E, Water Loss Control, Second Edition, McGraw Hill Publications. 9. Lambert, A.O, Water Losses Management and Techniques, International Water Association (IWA) Congress, Berlin, October 2001. 10. Matsushita, H, Establishment of Leakage Accident rate curves for drinking water pipes, Montreal, 2010.
11. Mckenzie, R.S, Wegelin, W.A and Meyer, N, Water Demand Management Cookbook.
12. Ronnie Mckenzie, Component Based Analysis for Management of Leakage in Potable Water Supply Systems. 13. Saroj Sharma, Performance Indicators of Water Losses in Distribution System, April 2008.
14. Stuart Trow and Malcolm Farley, Developing a Strategy for Leakage Management in Water Distribution System. 15. UNICEF and WHO, Progress on Sanitation and Drinking Water, 2015 Update and MDG Assessments. 16. VAG, GIZ, IWG-KIT and IEC-FHNW, Guidelines for Water loss reduction, A focus on pressure management. 17. VINCI Construction Grands Projects, Rehabilitation & Upgrading of Kantale Water Treatment Plant, GTIWSP, 2014.
18. WHO, Asia Water Watch 2015, “Are countries in Asia on track to meet Target 10 of the Millennium Development Goals?”, December 2005.
VIII. AUTHORS
L.Subaharan, Senior Engineer, Planning and Coordination Section, National Water Supply & Drainage Board, Tincomalee