DEC-JAN, 2016, VOL. 3/13 www.srjis.com Page 3254 MASS RAPID TRANSIT SYSTEM – AN EMERGING MODE OF PUBLIC
TRANSPORT
Y.P.Singh1 & Brijesh Kumar Kashyap2
1
Prof. Y.P.Singh is presently engaged as Adjunct Professor at School of Business Studies, Sharda
University .
2
Brijesh Kumar Kashyap is currently pursuing Ph.D in Management from Sharda University.
Introduction
Among the various important key inputs necessary for accelerating economic growth or
development of any area , one of the main requirement is the improvement of transportation
facility. The social transformation taking place in our country in respect of gradual movement of
large segment of society from rural areas to urban area necessitates radical and immediate
reforms in the transportation sector. The focus shall be on reducing cost of transportation and at
the same increasing the facility and convenience in transportation. Over the last few years , new
modes of transportation have been introduced for public transport system. The economic benefits
arising out of such systems are manifold. For example, Delhi has been blessed with Metro rail
system which is providing services to very large segment of society at reasonable cost, good
hygienic environment, safe travelling, etc. Encouraged by the performance of Metro rail system
in Delhi, gradually its presence is being expanded in other adjacent areas referred as NCR areas.
The connectivity of one area with the other through this kind of transportation gradually brings
both the areas at par in terms of all kind of services besides facilitating the life of millions of
people who could not afford to live in cities like Delhi on account of higher rental charges but
had to travel on daily basis for their job purpose. The mass rapid transit system is the need of the
hours as it offers following benefits:
DEC-JAN, 2016, VOL. 3/13 www.srjis.com Page 3255 a) It allows larger number of people to travel from one area to the other area in the
predetermined time.
b) Nowadays, pollution has become main concern for the Government as different ways are
being explored to reduce the pollution problems. The provision of MRTS as means of public
transport offers great opportunity in combating the pollution issues.
c) The radical change in the social system has skewed the mindset of general public towards
availing hygienic environment in all respects. In contrasts to buses being used for public
transport, MRTS offers clean and hygienic mode of transport for commuting from place of
residence to their place of work.
d) The security issues are also addressed to in case of MRTS to a large extent in comparison to
other modes of transport.
e) The present life style of upcoming generation assigns lot of value to time. The total travelling
time including waiting time has been considerably reduced in case of MRTS as compared to
other modes of transportation , particularly, road transport where chances of delay/time loss
are very high due to frequent traffic jams.
f) In the light of various services being provided by MRTS, the cost of travelling per kilometer
appears to be economical in comparison various other modes of public transport.
Realizing the importance of transportation in transformation of social sector, Government under
its twelfth five year plans has allocated funds for different type of transportation system such as
Railway, Road, MRTS, Ports, etc. An analysis of the same reveals that though in absolute terms ,
the amount allocated towards MRTS appear to be relatively less than other modes, but the
subsequent increase over five year period in percentage term is much larger as compared to other
modes of transports. This clearly reflects success of MRTS over other means of transport. With
the Government’s initiative in promoting MRTS in comparison to other modes at the
background, the present study aims to test statistically, if there is any difference in approach with
regard to efforts of Government in focusing more emphasis on setting up MRTS under its
proposed 12th five year plan. The study defines following null hypothesis :
Null Hypothesis : There is no significant difference between percentage increase in fund
allocation for MRTS and other means of transport under 12th five year plan .
Research Methodology : In order to test the above hypothesis, the proposed plan expenditure
for different mode of transport under 12th five year plan have been referred, as shown below in
DEC-JAN, 2016, VOL. 3/13 www.srjis.com Page 3256 Year Road and
Bridges Railways MRTS Airports Ports
2012-13 150466 64713 13555 7691 18661
2013-14 164490 78570 17148 10716 25537
2014-15 180415 96884 22298 15233 35260
2015-16 198166 121699 29836 21959 49066
2016-17 221000 157355 41322 32116 69256
Table 1: Amount (in Rs crores) allocated under 12th Five year Plan for various modes of
transport.(Source: Planning Commission Report 2012-17)
In absolute terms, the amount allocated for Road and bridges appears to be relatively larger than
other modes of transportation but the percentage increase in amount of allocated expenditure for
different modes over each subsequent year shows greater thrust towards MRTS , Airports and
Ports as can be observed from the percentage increase given below in table 2.
Year Road and
Bridges Railways MRTS Airports Ports 2012-13
2013-14 9.320378026 21.41301 26.50682 39.33169 36.8469
2014-15 9.681439601 23.30915 30.03266 42.15192 38.07417
2015-16 9.838982346 25.6131 33.80572 44.15414 39.15485
[image:3.612.137.475.86.250.2]2016-17 11.52266282 29.29852 38.49712 46.25438 41.14866
Table 2: Percentage increase in Amount allocated for various modes of transport
The data given in table 2 has been used to test the hypothesis under study with the help of
ANOVA techniques.
Analysis of Data
The assumption of normality of data has been examined using one sample Kolmogorov-Smirnov
test (K-S test ) using SPSS. The result of the output are summarized below in table 3.
One-Sample Kolmogorov-Smirnov Test
Mode
N 20
DEC-JAN, 2016, VOL. 3/13 www.srjis.com Page 3257 Std.
Deviation
12.2348742
Most Extreme Differences Absolute .168
Positive .132
Negative -.168
Kolmogorov-Smirnov Z .750
Asymp. Sig. (2-tailed) .627
a. Test distribution is Normal. b. Calculated from data.
Table3: SPSS output of One sample Kolmogorov – Smirnov Test
As can be observed from above calculation , p-value (Asymp. Sig) is greater than .05 , therefore,
we can concluded that our data complies with the condition of normality . In order to test the
homogeneity of variances among return , Levene statistic has been calculated using SPSS , as
shown below in table 4:
Test of Homogeneity of Variances Mode
Levene Statistic df1 df2 Sig.
2.563 4 15 .081
Table4: SPSS output of Levene statistic test
Since the Levene statistic is greater than 0.05 , therefore we can conclude that the variability
among various figures under study are significantly different. This makes necessary to further
employ usage of ANOVA test to find out if the percentage increase for different mode of
transport are significantly different or not. The output obtained using SPSS on the data given
under table 1 , with regard to ANOVA test, is given below in table 5.
ANOVA Mode
Sum of Squares df
Mean
Square F Sig.
Between Groups
2691.310 4 672.828 66.032 .000
Within Groups
152.840 15 10.189
Total 2844.151 19
DEC-JAN, 2016, VOL. 3/13 www.srjis.com Page 3258 It can be observed from the output that p value is less than .05 ,it implies our null hypothesis is
rejected which implies there is significant difference between proposed percentage increase
among different mode of transports. The difference among the returns being observed cannot be
concluded to have occurred by chance and they can be interpreted as statistically significant
differences.
Post Hoc Test and Analysis
The result obtained above shows that there is significant different among proposed percentage
increase in expenditure during the period under study. In order to ascertain difference of each
mode vis-à-vis other modes under study, multiple comparison test has been conducted and its
output is given in table 6.
Multiple Comparisons Dependent Variable: Mode
Tukey HSD
(I) Type
Mean Difference
(I-J) Std. Error Sig.
95% Confidence Interval Lower Bound Upper Bound Roads and bridges
Railways
-14.8175793*
2.2571398 .000
-21.787457
-7.847702
MRTS
-22.1197143*
2.2571398 .000
-29.089592
-15.149837
Airports
-32.8821668*
2.2571398 .000
-39.852044
-25.912289
Ports
-28.7152793*
2.2571398 .000
-35.685157
-21.745402 Railways Roads
and bridges
14.8175793* 2.2571398 .000 7.847702 21.787457
MRTS -7.3021350* 2.2571398 .038
-14.272012
-.332258
Airports
-18.0645875*
2.2571398 .000
-25.034465
-11.094710
Ports
-13.8977000*
2.2571398 .000
-20.867577
-6.927823
MRTS Roads
and bridges
22.1197143* 2.2571398 .000 15.149837 29.089592
Railways 7.3021350* 2.2571398 .038 .332258 14.272012
Airports
-10.7624525*
2.2571398 .002
-17.732330
-3.792575
Ports -6.5955650 2.2571398 .068
-13.565442
DEC-JAN, 2016, VOL. 3/13 www.srjis.com Page 3259
Airports Roads
and bridges
32.8821668* 2.2571398 .000 25.912289 39.852044
Railways 18.0645875* 2.2571398 .000 11.094710 25.034465
MRTS 10.7624525* 2.2571398 .002 3.792575 17.732330
Ports 4.1668875 2.2571398 .385 -2.802990 11.136765
Ports Roads
and bridges
28.7152793* 2.2571398 .000 21.745402 35.685157
Railways 13.8977000* 2.2571398 .000 6.927823 20.867577
MRTS 6.5955650 2.2571398 .068 -.374312 13.565442
Airports -4.1668875 2.2571398 .385
-11.136765
2.802990
[image:6.612.175.540.460.638.2]*. The mean difference is significant at the 0.05 level.
Table 6: SPSS output of Multiple comparison test
As can be observed from the above table, the values under Road and bridges are significantly
different from all the other modes of transport under study. This implies that the focus of
Government on Road and bridges in the coming years would be relatively less as compared to
development of other modes such as MRTS, Airports and Ports. The values of MRTS modes are
significantly different from all other modes except Ports , where the value has been found to be
0.068 implying there is no significant difference at 5% significance level. The same behavior of
the percentage increase in expenditure over different modes of transportation is also visible from
the mean plot of the returns shown in figure 1
Figure 1: Mean Plot
Another observation made from the mean plot is that the mean percentage increase in plan
DEC-JAN, 2016, VOL. 3/13 www.srjis.com Page 3260 bridges and Railways. This clearly demonstrate the strength of MRTS in emerging as important
means of transport for public transport and shifting of focus of the Government from
development of Roads ,bridges and railways to Mass Rapid Transit system.
Conclusion and Suggestion
The above analysis statistically proves the increased attention of Government in development of
MRTS on account of various benefits and advantages it command over other modes of existing
public transport. The increased allocation of budget towards MRTS clearly signifies that it will
be gradually having its presence in many urban and semi urban areas. However, the Government
need to accordingly develop master plan of its new cities so that the problem being faced
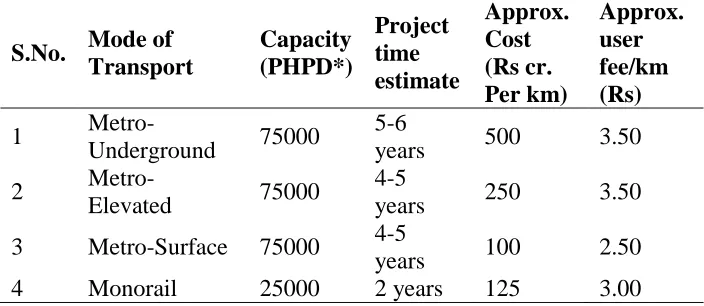
nowadays can be averted in future.In case of urban mass rapid transit system (MRTS), there are
a number of options which depend on the current and future needs, geographical factors, funds
available, etc. Metros can be underground, elevated or at surface. However, the cost and time
involve in their construction varies considerably as can be observed from the table 7.
S.No. Mode of Transport
Capacity (PHPD*)
Project time estimate
Approx. Cost (Rs cr. Per km)
Approx. user fee/km (Rs)
1
Metro-Underground 75000
5-6
years 500 3.50
2
Metro-Elevated 75000
4-5
years 250 3.50
3 Metro-Surface 75000 4-5
years 100 2.50
[image:7.612.130.482.334.487.2]4 Monorail 25000 2 years 125 3.00
Table 7: Comparative analysis of Metro project at different levels
*PHPD: Per hour per direction at three- minute frequency
(Source: The Economic Times on 23 Feb,2012 )
As can be observed from the above table, the cost of construction in case of Metro rail on surface
is significantly lower than Metro at elevated and surface level therefore the preference shall be
given for this option and it will enable the government to provide more coverage at low budget.
However, the main constraint being foreseen in this case is the availability of land. It is therefore
essential for the Government to ensure availability of enough land space in their proposed master
DEC-JAN, 2016, VOL. 3/13 www.srjis.com Page 3261 References
“Need to integrate MRTS with other public transport systems” published in The Hindu Business
Line on 25 Feb,2011.
“Only mass rapid transit solutions can provide India's urban commuters with efficient mobility” published in The Economic Times on 23 Feb,2012.
Gwilliam, K. (2002). Cities on the Move: Urban Transport Strategy Review. World Bank,
Washington DC
CIRT (2004), State Transport Undertakings: Profile and Performance ,2002–03, Central
Institute of Road Transport, Pune.
Pucher, J., N. Korattyswaroopam, and N. Ittyerah (2004). „The Crisis of Public Transport in
India: Overwhelming Needs but Limited Resources‟, Journal of Public Transport, 7(4)
„Urban transport „ by O.P.Aggarwal published in India Infrastructure Report 2006, Oxford