Estimation of Radiological Hazard Indices Due To
Radioactivity in Soils in Ibiono Ibom, Akwa Ibom State,
Nigeria
Essien, I. E., Essiett, A. A., Ani, O. B., Peter, I. G and Udofia, A. E
Department of Physics, Faculty of Sciences University of Uyo, Uyo, Nigeria
Abstract- The radiological hazard indices due to the radioactivity in soil samples in Ibiono Ibom Local Government Area of Akwa Ibom State, Nigeria were estimated. Soil samples were randomly collected at the depth of 30 cm in different locations from each of the three studied sites. The radionuclide activity concentrations in the soil samples were measured using gamma spectroscopy method. The mean activity concentration of 40K are 238.10±22.47 Bq/Kg, 73.84±7.15 Bq/Kg and 106.58±8.63 Bq/Kg respectively for the three sites, then for 238U the mean values for the three sites are respectively 8.26±2.06 Bq/Kg, 6.11±1.58 Bq/Kg and 3.16±0.80 Bq/Kg and for 232Th the mean values are 9.13±1.03Bq/Kg, 8.13±0.91Bq/Kg and 5.91±0.66Bq/Kg respectively. The mean radium equivalent for the three areas is 27.222 Bq/kg. The mean absorbed dose rates for the areas were 19.805 nGyh-1, 10. 863nGyh-1 and 9.787 nGyh-1 The mean total annual effective dose equivalent obtained for the areas were 0.101mSvy-1 , 0.062mSvy-1 and 0.060mSvy-1 respectively The values for all the hazards indices obtained were found to be below the world limits Therefore the level of exposure at the study areas presently poses no significant health threat, hence, the soils can be used as building material.
Index Terms- Activity concentrations, radionuclides, radiological hazard indices, gamma spectroscopy.
I. INTRODUCTION
oils are natural sources of radioactive materials (NORMs) which are known to be the most prominent means of exposing the public to radiation. Rocks, soils and vegetation are known to contains long half live radionuclide such as Uranium - 238, Thorium-232 and Potassium-40 and the knowledge of these radionuclides distribution in an environment is necessary for the estimation of the effect of radiation exposure due to both terrestrial and extraterrestrial sources (Thabayneh and Jazzar, 2012). It is reported that these NORMs are widely distributed in the rocks, with Potassium as the major element widely present (Gbenu et al., 2016). Environmental problems, such as health threats, associated with these NORMs occur in the process of quarrying, leaching, handling, storage, transportation of quarried products and the use of contaminated equipments without controls. In the process of preparation of these rocks for utilization, these radiations are absorbed by man through food intake and air inhalation. (Innocent et al, 2013).
Recently there is increasing demands for quarry products such as rocks, gravels, clays, stone sands, by state governments,
non-governmental organizations (NGOs) and individuals as buildings materials and for other developmental purposes in this area under study. Therefore, due to the economic values and high demands for the quarry products, some areas of Ibiono Ibom Local Government Area of Akwa Ibom, Nigeria, which are naturally endowed with these resources in a large quantity, are now witnessing commercial quarries. The quarry activities which involve the digging of the ground soils to certain depth in order to bring the natural resources to the top surfaces also bring the NORMs to the soil surface, thereby increasing the radiation exposure to the workers and environment. Therefore the knowledge of the activity concentration of these NORM and their progenies in these soils samples enable one to assess any possible radiological hazards to occupants of the dwellings where these samples are used as building materials to construct homes. Again, the information could be used to estimate population exposure to these radiation both indoors and outdoors as the populace spends 80 % of their times indoors and 20 % outdoors (Bede et al., 2015). However, no adequate evaluation of the radiological effects due to the radioactivity in the soil in the area has been conducted before now. It is on this background that this work was carried out to assess the level of radiological effects due to the soils in Ibiono Ibom Local Government area.
II. MATERIALS AND METHOD
Ibiono Ibom local government area is situated in the South south geopolitical zone of Nigeria and it lies between longitudes 70 381 and 80 101 E and latitudes 50 51 and 50 301N. It has a large land mass and is highly populated. The area is bounded by rivers from Cross River State also in the south southern part of Nigeria. The villages where soil samples were collected are Ikot Ekwuo Idoro, Ikot Ekoi and Use Ikot Amama. The major economic activities of the people are predominantly quarrying, fishing and farming. Ibiono Ibom local government area is also highly rich in igneous, sedimentary and metamorphic rocks widely used as building materials in construction of dwelling places and construction of roads
2012) were sealed in a well labeled polythene bags and taken to National Institute of Radiation Protection and Research (NIRPR), Nigerian Nuclear Regulatory agency (NNRA), University of Ibadan, Nigeria for analysis.
The collected soil samples were first dried and then crushed, grounded and passed through a sieve of 1.0mm mesh size. The fine-grained powder of each sample obtained were dried in an oven to about 1100 C for 2 hours to ensure total removal of moisture and 300g of each dried prepared sample was sealed in a cylindrical plastic container and properly labeled for easy identification. The prepared samples were stored for a period of 30 days to ensure secular radioactivity equilibrium between 226Ra and its short lived progeny (EL-Arabic, 2005). In the laboratory, the activity concentrations of uranium–238, thorium–232 and potassium–40 were determined using gamma spectrometer coupled to NaI(TI) detector. The data acquisition and analysis of gamma spectra were made possible by a computer base multi-channel analyzer maestro program and the radionuclide activity concentration per unit mass (c) was calculated using equation (1) (Essien and Akpan 2016)
t
M
N
c
γ
ξ
=
1Where M is the mass of the samples measured in Kg,
ξ
the detector energy dependent efficiency, t is the counting live time (s),γ
is the gamma ray yield per disintegration of the nuclides and N is the net peak area of the nuclide.
111 Radiological hazard indices
The radiological hazard indices considered for this work are radium equivalent activity, radioactivity level index, absorbed dose rate, annual effective dose equivalent, external and internal hazard indices as well as the excess lifetime cancer risk.
Radium Equivalent Activity
The radium equivalent activity,
R
aeqis used to compare the specific activities of material containing different quantitiesof238
U
,232Th
and40K
. The values ofR
aeqcould be obtained from (Bede et, al., 2015)
R
aeq(
BqKg
)
C
u1
.
43
C
Th0
.
077
C
K1
=
+
+
−
………..2
where
C
u,
,
C
Th andC
K are the average activity concentrationsof 238
U
,232Th
and 40K
respectively. In calculating Raeqvalues, the average activity concentration of 370Bq/kg,
259Bq/Kg and 4810Bq/kg used for 238U, 232Th and 40K radionuclide, respectively, were assumed
to produce the same gamma dose rate (EL-Taher et al, 2004).
Absorbed Dose Rate in Air
The effects of gamma radiation, emanating from radioactive sources in the environment, are usually given in terms of the total gamma radiation absorbed dose rate in air, D𝛾𝛾 and is calculated from the measured activity concentrations of 238U, 232Th and 40K radionuclides as
proposed by UNSCEAR (Bede et, al., 2015).
D
(
nGyh
)
0
.
427
C
u0
.
662
C
Th0
.
043
C
K1
=
+
+
− γ
3
Annual Effective Dose Equivalent
The annual effective dose equivalent (AEDE) received by individuals are generally obtained from the calculated values of D𝛾𝛾 by applying the conversion factor of 0.7SvGy-1 and the occupancy factors of 0.2 and 0.8 for outdoors and indoors effective doses, respectively (UNSCEAR, 2000). The annual effective dose outdoor (AEDE outdoor ), the annual effective dose indoor , (AEDE indoor )and the total annual effective dose (AEDE total), are obtained using the following relations.
6 1 1 1
10
7
.
0
2
.
0
25
.
365
24
)
(
)
(
mSvyr
−=
D
nGyh
−×
h
×
days
×
×
SvGy
−×
−r
AEDEoutdoo
γ 4 6 1 1 110
7
.
0
8
.
0
25
.
365
24
)
(
)
(
mSvyr
−=
D
nGyh
−×
h
×
days
×
×
SvGy
−×
−AEDEindoor
γ5
The total annual effective dose equivalent could be obtained from (Gbenu et al 2015)
AEDEtotal
(
mSvyr
)
5
AEDEoutdoo
r
1=
−
6
External and internal hazards indices
The external radiation hazard index,
H
ext, corresponding to238
U, 232Th and 40K natural radionuclides are calculated using the relation below
H
ext =4810
259
370
U THK
C
C
C
+
+
7
The internal hazard index for 238U, 232Th and 40K are obtained using the equation
H
in=4810
259
185
U THK
C
C
C
+
+
8
where CU, CTh and CK are the activity concentrations of 238
U, 232Th and 40K respectively and the numbers in the numerators of equations 5 and 6 are their respective conversion factors (Bede et al 2015). In comparison to equation 6, we can have equation 9.
H
total=
H
ext+
H
in 9The value for the external and internal hazard indices must be less than unity for the radiation hazard to be considered negligible (Beretka and Mathew, 1985). Similarly for radiological safety the value for Htotal also must be less than unity
Radioactivity Level Index
gamma-radiations decayed from these radioactive nuclides in soil
and values of
I
γ can be obtained using relation belowγ
I
=1500
100
150
U TH
K
C
C
C
+
+
10 where Cu, CTh and Ck are the activity concentrations of uranium,
thorium and potassium respectively. The calculated values of I𝛾𝛾must be less than unity for the soil environment to be free from radiological health hazards.
Excess Lifetime Cancer Risk
The excess lifetime cancer risk (ELCR) values are calculated using the given equation
F L
R
D
AEDEtotal
ELCR
=
×
×
11 where DL is the duration of life (taken approximately as 70
years), RF is the risk factor (Sv-1), which reflects the fatal cancer
risk per Sievert. For stochastic effects, a value of 0.05 for the public is recommended, (Taskin, et al, 2009).
III. RESULTS
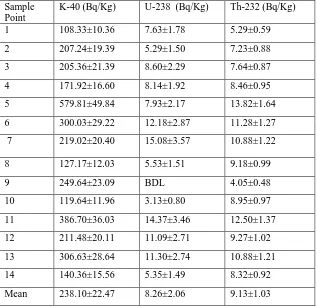
[image:3.612.149.466.262.569.2]The activity concentration of the three (40K 238U and 232Th) natural radionuclides in the soils in study areas are presented in Tables 1, 2 and 3
[image:3.612.164.450.597.731.2]Table 1: Activity concentrations of 40k, 238U and 232Th in the soil at the study sites at Ikot Ekwuo Idoro
Table 2: Activity concentrations of 40k, 238U and 232Th in the soil at the study sites at Ikot Ekoi Sample
Point
K-40 (Bq/Kg) U-238 (Bq/Kg) Th-232 (Bq/Kg)
1 108.33±10.36 7.63±1.78 5.29±0.59
2 207.24±19.39 5.29±1.50 7.23±0.88
3 205.36±21.39 8.60±2.29 7.64±0.87
4 171.92±16.60 8.14±1.92 8.46±0.95
5 579.81±49.84 7.93±2.17 13.82±1.64
6 300.03±29.22 12.18±2.87 11.28±1.27
7 219.02±20.40 15.08±3.57 10.88±1.22
8 127.17±12.03 5.53±1.51 9.18±0.99
9 249.64±23.09 BDL 4.05±0.48
10 119.64±11.96 3.13±0.80 8.95±0.97
11 386.70±36.03 14.37±3.46 12.50±1.37
12 211.48±20.11 11.09±2.71 9.27±1.02
13 306.63±28.64 11.30±2.74 10.88±1.21
14 140.36±15.56 5.35±1.49 8.32±0.92
Mean 238.10±22.47 8.26±2.06 9.13±1.03
Sample Point
K-40 (Bq/Kg) U-238 (Bq/Kg) Th-232 (Bq/Kg)
1 67.34±6.83 4.19±1.13 10.67±1.22
2 89.96±8.18 9.11±2.11 6.10±0.68
3 78.66±7.77 9.36±2.70 6.63±0.75
4 35.80±3.54 11.09±2.78 10.65±1.20
5 26.85±2.82 6.26±1.32 4.18±0.50
Table 3: Activity concentrations of 40k, 238U and 232Th in the soil at the study sites at Use Ikot Amama
IV. DISCUSSION
Radionuclides activity concentration in the soils samples Tables 1, 2 and 3 show that activity concentration of 40K are 108.33± 10.36 Bq/Kg to 579.81±49.84 Bq/Kg with mean of 238.10±22.47 Bq/Kg for Ikot Ekwuo Idoro, (26.85±2.82 to 180.40±18.85)Bq/Kg with mean of 73.84±7.15 Bq/Kg for Ikot Ekoi and (15.54±1.42 to 218.55 ±19.74) Bg/Kg with mean of 106.58±8.63 Bq/Kg for Use Ikot Amama respectively, then for
238
U the range (mean) for the three sites are respectively BDL- 15.08±3.57Bq/Kg (8.26±2.06 Bq/Kg), 1.03±0.28- 11.09±2.78 Bq/Kg(6.11±1.58 Bq/Kg) and BDL-11.10±2.78Bq/Kg (3.16±0.80 Bq/Kg) and for 232Th the values obtained are 4.05±0.48- 13.82±1.66Bq/Kg with mean value of 9.13±1.03Bq/Kg, (4.18±0.50 – 10.67±1.22)Bq/Kg with mean 8.13±0.91Bq/Kg and (4.36±0.50 – 7.67±0.84)Bq/Kg with mean
of 5.91±0.66Bq/Kg respectively. These radioactivity concentration values obtained in these quarry sites are below the world average value of 400 Bq/kg for 40k, 35Bq/kg for 238U and 30Bq/kg for 232Th (UNSCEAR, 2000), except in a one sample point at Ikot Ekwuo Idoro that the maximum value for K-40 is higher than the world value.
It could be observed from Fig.1 that the mean activity concentration of 40K is the highest for all the studied sites making
40
K the dominant radionuclide in the study areas. This result agrees with the previous study elswhere within the South South zone of Nigeria (Iwetan, et al 2015, Bede et al 2015). There is a low activity concentration of 238U in soils in all the studied areas while the activity concentration in some areas were below detection limit (BDL).
7 180.40±18.85 3.31±0.94 10.35±1.12
8 43.33±4.39 4.56±1.40 9.18±0.99
Mean 73.84±7.35 6.11±1.58 8.13±0.91
Sample Point
K-40 (Bq/Kg) U-238 (Bq/Kg) Th-232 (Bq/Kg)
1 26.85±2.58 6.68±1.77 4.36±0.50
2 218.55±19.74 3.04±0.80 7.39±0.79
3 113.51±10.72 5.83±1.40 6.64±0.75
4 15.54±1.42 4.67±1.27 5.79±0.64
5 150.72±14.75 BDL 5.31±0.59
6 98.91±0.63 1.91±0.35 4.39±0.50
7 121.99±10.58 BDL 7.67±0.84
Mean 106.58±8.63 3.16±0.80 5.94±0.66
0 50 100 150 200 250 300
K-40 U-238 Th-232 Raeq
Ikot Ekwuo Ikot Ekoi Use ikot Amama
0 50 100 150 200 250 300
K-40 U-238 Th-232 Raeq
M
ea
n
act
iv
ity
con
ce
nt
ra
tion
Fig. 1.0. Mean activity concentration of the radionuclides
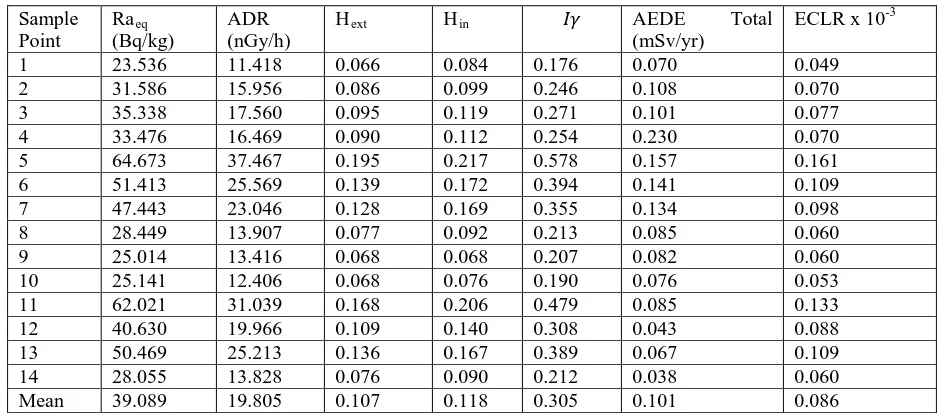
Radiological Hazard Indices in Soils of the Studied Areas In Tables 4, 5 and 6 it is observed that the radium equivalent varies from 23.536Bq/kg to 64.673 Bq/kg with a mean of 39.089 Bq/kg for Ikot Ekwuo Idoro, 12.303Bq/kg to
27.554Bq/kg with a mean of 22.750Bq/kg for Ikot Ekoi and 14.982 Bq/Kg to 30.436 Bq/Kg with a mean value of 19.828 Bq/Kg for Use Ikot Amama. These values are below the world standard of 370Bq/kg for radium equivalent.
[image:5.612.70.542.185.393.2]
Table 4 Calculated radiological hazards indices for the soils in Ikot Ekwuo Idoro
Sample Point
Raeq
(Bq/kg)
ADR (nGy/h)
Hext Hin 𝐼𝐼𝛾𝛾 AEDE Total
(mSv/yr)
ECLR x 10-3
1 23.536 11.418 0.066 0.084 0.176 0.070 0.049
2 31.586 15.956 0.086 0.099 0.246 0.108 0.070
3 35.338 17.560 0.095 0.119 0.271 0.101 0.077
4 33.476 16.469 0.090 0.112 0.254 0.230 0.070
5 64.673 37.467 0.195 0.217 0.578 0.157 0.161
6 51.413 25.569 0.139 0.172 0.394 0.141 0.109
7 47.443 23.046 0.128 0.169 0.355 0.134 0.098
8 28.449 13.907 0.077 0.092 0.213 0.085 0.060
9 25.014 13.416 0.068 0.068 0.207 0.082 0.060
10 25.141 12.406 0.068 0.076 0.190 0.076 0.053
11 62.021 31.039 0.168 0.206 0.479 0.085 0.133
12 40.630 19.966 0.109 0.140 0.308 0.043 0.088
13 50.469 25.213 0.136 0.167 0.389 0.067 0.109
14 28.055 13.828 0.076 0.090 0.212 0.038 0.060
[image:5.612.74.542.425.559.2]Mean 39.089 19.805 0.107 0.118 0.305 0.101 0.086
Table 5 Calculated radiological hazards indices for the soils in Ikot Ekoi
Sample Point
Raeq
(Bq/kg)
ADR (nGy/h)
Hext Hin 𝐼𝐼𝛾𝛾 AEDE Total
(mSv/yr)
ECLR x 10-3
1 24.633 11.748 0.067 0.078 0.180 0.072 0.049
2 24.760 11.796 0.067 0.092 0.182 0.072 0.053
3 24.898 11.768 0.067 0.093 0.181 0.072 0.049
4 21.598 9.925 0.058 0.084 0.153 0.069 0.042
5 23.557 10.878 0.064 0.081 0.166 0.067 0.046
6 12.303 6.164 0.033 0.036 0.095 0.038 0.028
7 27.554 13.963 0.074 0.083 0.215 0.076 0.060
8 22.697 10.662 0.061 0.074 0.163 0.065 0.046
Mean 22.750 10.863 0.061 0.078 0.167 0.062 0.047
Table 6 Calculated radiological hazards indices for the soils in Use Ikot Amama
Sample Point
Raeq
(Bq/kg)
ADR (nGy/h)
Hext Hin 𝐼𝐼𝛾𝛾 AEDE Total
(mSv/yr)
ECLR x 10-3
1 14.982 6.895 0.041 0.059 0.106 0.042 0.032
2 30.436 15.588 0.082 0.090 0.240 0.096 0.067
3 20.848 10.277 0.056 0.072 0.158 0.063 0.046
4 15.162 6.965 0.041 0.054 0.107 0.043 0.032
5 19.885 10.314 0.054 0.054 0.158 0.063 0.046
6 17.119 8.584 0.046 0.051 0.132 0.053 0.039
7 20.361 10.201 0.055 0.055 0.158 0.063 0.046
[image:5.612.72.545.592.715.2]Tables 4, 5 and 6 show the results of the calculated radiological hazard indices for each of the studied area. Absorbed dose rates vary from 11.418 nGyh-1 to 37.467nGyh-1 with a mean of 19.805 nGyh-1 Ikot Ekwuo Idoro and 6.164 nGyh-1 to 13.963 nGyh-1 with a mean of 10. 863nGyh-1 for Ikot Ekoi, 6.895 nGyh-1 to 15.588 Gyh-1 with mean value 9.787 nGyh-1 for Use Ikot Amama. These values are below the world standard of 55.0nGyh
-1
. The mean total annual effective dose equivalent obtained was 0.101mSvy-1 for Ikot Ekwuo Idoro, 0.062mSvy-1 for Ikot Ekoi and 0.060mSvy-1 for Use Ikot Amama. However, these values are within the 0.3 -1.0 mSvy-1 range proposed by United Nations Scientific Committee on the Effect of Atomic Radiation (UNSCEAR) for safety. The calculated radioactivity level index values reported in Tables 4 - 6 are below the world standard value of unity hence the materials from these quarry site can be used as buidling materials for housing construction without posing a health threat to the inhabitants (Tufail et. al, 2007). The
calculated
H
ext,
H
in has a value range less than unity respectively and Tables 4, 5 and 6 show the values ofH
Toatlalso less than unity. This indicates that interaction with the soils in Ibiono Ibom Local government area will not lead to respiratory diseases such as asthma and cancer and external diseases such as erythema, skin cancer and cataracts (Avwiri et al., 2012). The range mean excess lifetime cancer risk calculated for the studied area is between 0.044 x 10⁻³ – 0.086 x 10⁻³. These values are below the world standard of 0.29x10⁻³ implying that the probability of people in the quarry sites developing cancer cases is small (Taskin et al., 2009).V. CONCLUSION
The evaluation of radiological hazard indices and excess lifetime cancer risk in quarry sites in Ibiono Ibom Local Government Area of Akwa Ibom State, Nigerian have been conducted. This work saves as baseline for future radiological study of the study as the government has many development programmes for these areas. The activity concentrations of
40
K,238U,and 232Th in soil samples of Ibiono Ibom were below their respective world recommended safety limit.The radionuclides are randomly distributed in the soil with 40K being the dorminant radionuclide .The calculated radiological hazard indices for the Ibionno Ibom are all below their respective world standards.Therefore quarry activities and the obtained building materials do not pose any significant health threat to the environment and it’s residents. However, regular radiation monitoring and evaluation is recommended to notice any possible rise in radiation level due to the quarry activities in these areas
REFERENCES
[1] Avwiri, G. O.,Osimobi, J. C., Agbalagba, E. O.(2012). Evaluation of Radiation Hazard Indices and Excess Lifetime Cancer Risk Due to Natural Radioactivity in Soil profile of Udi and Ezeagu Local Government Area of Enugu State, Nigeria. Environmental and Earth Sciences. 1: 1-10
[2] Bede, M. C., Essiett, A. A., Inam, E. (2015). An Assessment of Absorbed Dose and Radiation Hazard Index from Natural Radioactivity in Soils from
Akwa Ibom State, Nigeria. International Journal of Science and Technology, 4(3): 80-89
[3] Beretka, J and Mathew, P. J (1985). Natural Radioactivity of Australian Building Materials, Industrial Waste and By-products. Health Physics. 48 (75): 87-95
[4] Chad Umoren, Y. E., Ohwekvwo, E.(2012). Influence of Crude Oil Spillage on the Gamma-Radiation status of Water and Soil in Ogba/ Egbema/ Ndoni Area. Nigeria. Energy and Environmental Research, 3(2):45-52
[5] Essiett, A. A, Essien, I. E. and Bede, M. C (2015). Measurement of Surface Dose Rate of Nuclear Radiation in Coastal Areas of Akwa Ibom State, Nigeria. International Journal of Physics, 3(5): 224-22
[6] EL-Arabi, A. M (2005): Natural Radioactivity in Sand used in Thermal Therapy at the Red sea coast. Environmental Radioactivity, 81: 11-19 [7] El-Taher, A. Uosif, M. A and Orabi, A. A (2004). Natural Radioactivity
Level and Radiation Hazard Indices in Granites from Aswan to Wadi EL-Allaqi South Eastern Desert, Egypt. Radiation Physics and Protection Conference, 7: 27-30
[8] Fannu, A. E., Darko, O. and Ephraim, J. H (2011). Determination of Natural Radioactivity and Hazard in soils and Rocks samples in Mining Areas in Ghana. West African Journal of Applied Ecology, 19: 654-702.
[9] Gbenu, S. T., Oladejo, O. F., Alayande, O., Olukotun, S. F., Fasasi, M. K and Balogun, F. A.(2015). Assessment of Radiological Hazard of quarry Products from Southwest Nigeria. Journal of Radiation Research and Applied Sciences, 20-25
[10] Innocent, A.J., Onimisi, M.Y.and Jonah, S. A. (2013). Evaluation of naturally Occurring Radionuclide Materials in Soils samples collected from some Mining Sites in Zamfara State. Nigeria. British Journal of Applied and Technology, 3(4): 684-692
[11] Iwetan, C. N, Fuwape, I. A., Arogunjo, A. M and Obor, G.(2015). Assessment of Activity Concentration of radionuclides in Sediment from Oil Producing Communities of Delta State Nigeria. Journal of Environmental Protection, 6: 640-650
[12] Taskin, H., Karavus, M., Topalloglu, A. Hindroglu, S. and Karahan, G.(2009). Radionuclides Concentration in soils and Lifetime Cancer Risk of the Gamma Radioactivity in kirklareli, Turkey. Environmental Radioactivity, 100: 49-53
[13] Thabayneh, K. and Jazzar, M (2012). Natural Radioactivity Levels and Estimation of Radiation Exposure in Environmental Soil sample from Tulkarem Province-Palestine. Open Journal of Soil Science, 2: 7 - 16 [14] Tufail, M., Akhar, N., Jaried, S. A. and Hamid, T (2007).natural Radiation
Hazard in Building Bricks Fabrication from Soils of two Districks of Pakistan,. Radiological Protection, 27: 481-492
[15] United Nations Scientific Committee on the Effects of Atomic Radiation (UNSCEAR, 2000): sources, Effects and Risks of Ionization Radiation. Report to the General Assembly, annexes B: Exposures from Natural Sources. New York, Pp 678-679
AUTHORS
First Author – Essien, I. E, Department of Physics, Faculty of Sciences University of Uyo, Uyo, Nigeria
Second Author – Essiett, A. A, Department of Physics, Faculty of Sciences University of Uyo, Uyo, Nigeria
Third Author – Ani, O. B, Department of Physics, Faculty of Sciences University of Uyo, Uyo, Nigeria
Fourth Author – Peter, I. G, Department of Physics, Faculty of Sciences University of Uyo, Uyo, Nigeria
Fifth Author – Udofia, A. E, Department of Physics, Faculty of Sciences University of Uyo, Uyo, Nigeria
*