M E T H O D O L O G Y
Open Access
Analysis of cluster randomised stepped
wedge trials with repeated cross-sectional
samples
Karla Hemming
1*, Monica Taljaard
2,3and Andrew Forbes
4Abstract
Background:The stepped wedge cluster randomised trial (SW-CRT) is increasingly being used to evaluate policy or service delivery interventions. However, there is a dearth of trials literature addressing analytical approaches to the SW-CRT. Perhaps as a result, a significant number of published trials have major methodological shortcomings, including failure to adjust for secular trends at the analysis stage. Furthermore, the commonly used analytical framework proposed by Hussey and Hughes makes several assumptions.
Methods:We highlight the assumptions implicit in the basic SW-CRT analytical model proposed by Hussey and Hughes. We consider how simple modifications of the basic model, using both random and fixed effects, can be used to accommodate deviations from the underlying assumptions. We consider the implications of these
modifications for the intracluster correlation coefficients. In a case study, the importance of adjusting for the secular trend is illustrated.
Results:The basic SW-CRT model includes a fixed effect for time, implying a common underlying secular trend across steps and clusters. It also includes a single term for treatment, implying a constant shift in this trend under the treatment. When these assumptions are not realistic, simple modifications can be implemented to allow the secular trend to vary across clusters and the treatment effect to vary across clusters or time. In our case study, the naïve treatment effect estimate (adjusted for clustering but unadjusted for time) suggests a beneficial effect. However, after adjusting for the underlying secular trend, we demonstrate a reversal of the treatment effect. Conclusion:Due to the inherent confounding of the treatment effect with time, analysis of a SW-CRT should always account for secular trends or risk-biased estimates of the treatment effect. Furthermore, the basic model proposed by Hussey and Hughes makes a number of important assumptions. Consideration needs to be given to the appropriate model choice at the analysis stage. We provide a Stata code to implement the proposed analyses in the illustrative case study.
Keywords:Stepped wedge, Cluster randomised trial, Analysis, Secular trends
Background
Stepped wedge cluster randomised trials (SW-CRTs), that is, trials in which clusters are randomised to be-come exposed to an intervention sequentially over time [1–3], are rapidly increasing in popularity. In the con-ventional version of this design, which is the focus in this paper, all clusters are initially observed in the
unexposed condition; then at usually regular intervals, one or more clusters are sequentially randomised to be-come exposed to the intervention and remain exposed for the duration of the study. The study continues until all clusters are exposed. Outcomes may be assessed on cross-sectional samples of individuals from each cluster at multiple discrete time points, on the same cohort followed over time, or as mixture of the two. In this paper we focus on the cross-sectional design. Examples of interventions evaluated using the stepped wedge de-sign include changes to the way that health services are
* Correspondence:[email protected]
1Institute of Applied Health Research, University of Birmingham, Birmingham B15 2TT, UK
Full list of author information is available at the end of the article
delivered and health care professional training interven-tions [4–7].
A characteristic feature of this design is that the evalu-ation happens over an extended period of time in which the proportion of clusters exposed to the intervention gradually increases. This means that the control clusters will, on average, contribute observations from an earlier calendar time than the intervention clusters. In evalua-tions of policy changes and service delivery interven-tions, there may be secular changes in the outcome caused by external forces such as changes in the way that care is delivered. Thus, calendar time may be asso-ciated with the outcome in addition to its association with exposure to the intervention and so is a potential confounder [3, 5]. Stepped wedge studies that do not ad-just for time (i.e. do not allow for the possibility of secu-lar trends) are, therefore, potentially biased [3]. Whilst a recent, small, systematic review identified that 8 of a total of 10 studies adjusted for secular trends [8], results from our own larger review of 32 published trials identi-fied that only 17 (53%) clearly allowed for the secular trends within the primary estimate of the treatment ef-fect (unpublished result) [9]; and another review has shown that only 61 out of 102 trials mentioned time ef-fects in the analysis [10]. In the early history of cluster randomised trials it was not unusual to see trial results published without allowing for clustering, thus yielding results which were overly precise. This remained a prevalent problem for years [11–13]. A similar situation has already started to arise in the SW-CRT literature wherein trialists are failing to adjust for time [14]. In fact, failure to account for time has even appeared in the recent methodological literature [15]. This is potentially a greater problem than failing to adjust for clustering, as it has implications for bias as well as for precision.
Another important consideration in stepped wedge tri-als is that the basic analytical model proposed by Hussey and Hughes [16] makes a number of assumptions. These assumptions may be under-appreciated by some clinical trialists, as sensitivity to their departure is rarely investi-gated or considered at the analysis stage. Yet, these model assumptions are different and more restrictive than assumptions made in the related framework pro-posed for the analysis of cluster cross-over trials [17]. Furthermore, whilst others have started to appreciate these assumptions when determining the sample size needed in a stepped wedge trial [18], there is no single paper which addresses all of these issues with respect to statistical analysis.
In this paper, our objectives are to (1) review the as-sumptions implicit in the basic Hussey and Hughes model and to consider their implications; (2) consider how these models can be extended to allow for devia-tions from assumpdevia-tions, including heterogeneity in the
secular trend and in the treatment effect and (3) discuss the importance of adjusting for secular trends. We present a case study to demonstrate the application of the pro-posed model extensions and to show how trial conclu-sions can differ as a result of adjusting for secular trends.
Methods
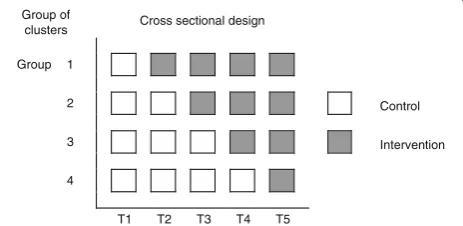
The defining feature of the SW-CRT is that clusters are randomised to initiate the intervention at different points in time. We define the points at which clusters are randomised to cross from the control to intervention as ‘steps’. Figure 1 presents a schematic illustration of the SW-CRT. The simplest stepped wedge study design has one cluster crossing over at each step (i.e. has the same number of steps as clusters) and has one additional measurement point to the number of steps (i.e. a prein-tervention measurement). Where more than one cluster switches at each step we refer to this as a group of clus-ters. Variations on the common design include multiple measurement points before any randomisation occurs or after all clusters have switched, steps between which no measurements are taken, and steps between which mul-tiple measurements are taken.
Case study: a SW-CRT to evaluate a training package to promote sweeping of the membranes
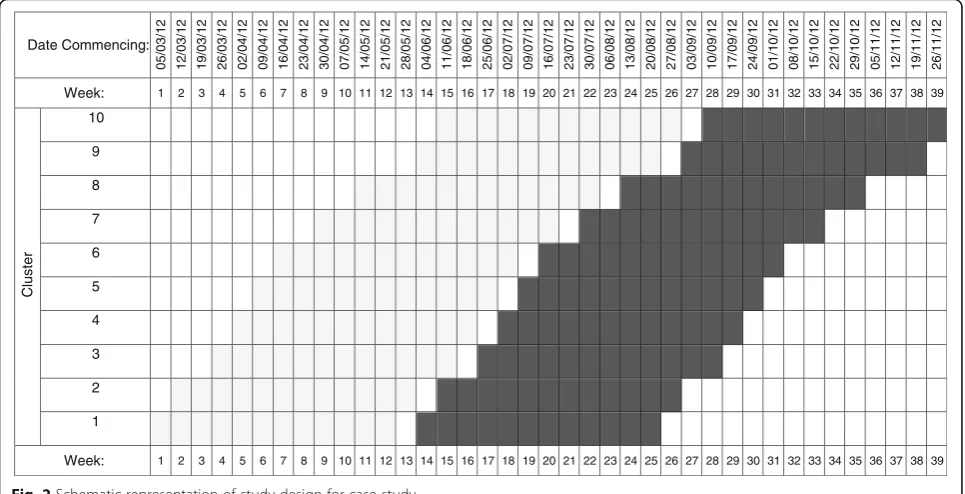
The UK body, the National Institute of Health and Clin-ical Excellence (NICE), recommends sweeping of the membranes at term to reduce induction of labour, but it is known that many women do not receive a membrane sweep. A pragmatic SW-CRT of 10 midwifery teams (with teams forming the clusters) was undertaken to evaluate whether a training package to promote sweep-ing of the membranes in post-term women is effective [19]. These 10 midwifery teams were split across two dif-ferent hospitals, with 5 teams serving each hospital and hospital used as a stratification factor in the randomisa-tion. The timing of the introduction of the intervention in each cluster was randomly allocated and evaluated using a slightly modified version of the stepped wedge cluster design (Fig. 2). Time was categorised into 39
Group of
clusters Cross sectional design
Group 1
2 Control
3 Intervention
4
T1 T2 T3 T4 T5
[image:2.595.306.538.590.703.2]time periods (each representing a week) with each birth occurring over the study duration being classified into the appropriate cluster by time period. The study in-cluded 2864 low-risk women over 39 weeks’ gestation and ran from 5 March 2012 to 26 November 2012. The primary outcome was whether or not the women had a membrane sweep. The next section commences with analysis methods for continuous outcomes then de-scribes natural extensions for binary outcomes– applic-able to our case study.
Basic model
Hussey and Hughes [16] have suggested a model-based approach for analysing data from a cross-sectional SW-CRT. This approach was proposed for continuous out-come variables and has been commonly used at the de-sign stage of these studies [9]. It involves fitting a linear mixed model:
Yijl ¼ β0 þ βj þ θXij þ ui þ eijl;
where i indexes the cluster, j indexes time and l in-dexes the individual, with Yijl a continuous outcome.
The term ui~N(0,σu
2
) represents a cluster-level random effect, eijl~N(0, σ(2e)) the individual error terms, X is a binary variable representing exposure to the treatment (1 for treatment, 0 otherwise),θ is the treatment effect. Following Hussey and Hughes,βjrepresents a fixed
cat-egorical effect to model the underlying secular trend (βT
= 0 for identifiability where T is the total number of measurement periods) and β0 an intercept term which
represents the population average during the first time interval. It is convenient to think of ui representing the
time invariant deviation of the ith cluster from the popu-lation average.
The intracluster correlation coefficient (ICC) which, under this model, is assumed constant over time, is then:
ρ ¼ σ2u
σ2
u þ σ2e :
Hussey and Hughes consider models for continuous outcomes with an identity link (to report mean differ-ence). But, this approach naturally extends togeneralised
linear mixed models for other outcome types (e.g. binary as in the case study), other link functions (e.g. logit) and consequently, other scales for the treatment effect (e.g. odds ratio (OR)).
It is important to recognise the underlying assump-tions of the basic Hussey and Hughes model, both with respect to fixed and random components. Most notably, the model includes a fixed effect for time (implying a common underlying secular trend across all clusters) and a single term for treatment (implying a constant shift in this trend under the treatment). In the basic model the effect of time is modelled as a categorical variable which allows for a piecewise secular trend. The model additionally implies a simple correlation struc-ture, whereby the correlation between any two observa-tions in the same cluster is the same regardless of
Date Commencing: 05/03/ 12 12/03/ 12 19/03/ 12 26/03/ 12 02/04/ 12 09/04/ 12 16/04/ 12 23/04/ 12 30/04/ 12 07/05/ 12 14/05/ 12 21/05/ 12 28/05/ 12 04/06/ 12 11/06/ 12 18/06/ 12 25/06/ 12 02/07/ 12 09/07/ 12 16/07/ 12 23/07/ 12 30/07/ 12 06/08/ 12 13/08/ 12 20/08/ 12 27/08/ 12 03/09/ 12 10/09/ 12 17/09/ 12 24/09/ 12 01/10/ 12 08/10/ 12 15/10/ 12 22/10/ 12 29/10/ 12 05/11/ 12 12/11/ 12 19/11/ 12 26/11/ 12
Week: 1 2 3 4 5 6 7 8 9 10 11 12 13 14 15 16 17 18 19 20 21 22 23 24 25 26 27 28 29 30 31 32 33 34 35 36 37 38 39
Cluster 10 9 8 7 6 5 4 3 2 1
Week: 1 2 3 4 5 6 7 8 9 10 11 12 13 14 15 16 17 18 19 20 21 22 23 24 25 26 27 28 29 30 31 32 33 34 35 36 37 38 39
[image:3.595.57.540.89.336.2]treatments administered and duration between the time periods of the observations.
The model also assumes that the data obtained, at multiple discrete time points, are on different individ-uals. However, whilst the data are assumed measured at discrete points in time in this model, the actual mea-surements might be obtained in continuous time (as in our case study) but categorised into time intervals de-fined by the steps.
We first consider extensions in which the assumption about the secular trend is relaxed and then move on to consider extensions in which the treatment effect is allowed to vary in some way. These extensions are incor-porated either by extending the fixed or random compo-nents of the model. Each extension makes implicit modifications to the assumptions about the correlation structures – we outline these along the way. For clarity we build the models up in a stepwise process. For nota-tional clarity, fixed effects are represented using Greek letters and random effects using lower case Roman let-ters. We use θ throughout to denote the treatment ef-fect, sometimes with a subscript to indicate a treatment effect that varies across some factor.
Extensions to allow different secular trends
In the basic Hussey and Hughes model, a homogeneous secular trend is assumed across all clusters. Whilst the underlying secular trend may not be of substantive inter-est, a misspecified secular trend may lead to biased treat-ment effects or biased standard errors. Random deviations (across clusters) from the underlying secular trend have already been proposed in the context of clus-ter cross-over designs and clusclus-ter trials with repeated cross-sectional measurements [17, 20, 21]. Such devia-tions have also been proposed in stepped wedge trials in the context of design and efficiency considerations [22, 23]. We consider extensions to the basic model to allow for variation in the secular trend across clusters, first using fixed effects and then using random effects.
Model extension A: varying secular trends across strata of clusters–using fixed effects
Secular trends might vary across clusters or defined sub-groups of clusters (i.e. strata). For example, in our case study involving stratified allocation of midwifery teams within two separate hospitals, it may be reasonable to allow for different secular trends in each hospital. This can be accomplished by adding a fixed-effect interaction between time and stratum to the basic model:
Yi sð Þjl ¼ β0 þ βj þ θXi sð Þj þ γjsZi sð Þ þ ui þ ei sð Þjl;
where Yi(s)jl indicates that cluster i is nested within
stratum s, Zi(s) is an indicator for stratum and γjs
represents the fixed time by stratum interaction (con-strained such thatγjsis 0 for the last strata). One natural choice might be to treat any stratification grouping used in the randomisation procedure as strata. This model ex-tension, modifying the fixed-effects components only, makes no modifications to the underlying correlation structure.
Model extension B: varying secular trends across clusters– using random effects
Secular trends might also be allowed to vary randomly across clusters, rather than across fixed subgroups of clusters. This can be incorporated by extending the random-effects components to allow a random inter-action between time and clustervij:
Yijl ¼ β0 þ βj þ θXij þui þ vij þ eijl;
where vij~N(0, σv2) and where vij is assumed
independ-ent toui. In this model, each cluster has a different
ran-dom effect at each time point and thus a different deviation from the average secular trend–although the degree of variation (as indicated by σv2) is sampled from
the same distribution at all time points and for all clus-ters [24]. It is convenient to think of vijrepresenting the
variation within a cluster due to time varying character-istics of the cluster.
One implication of including a random time by cluster interaction is that it allows the intracluster correlation to depend on whether observations are in the same time period or in different time periods. In particular, it al-lows for two different correlation coefficients:
ρW ¼
σ2
u þ σ2v
σ2
u þ σ2v þ σ2e
and
ρI ¼
σ2
u
σ2
u þ σ2v þ σ2e ;
where ρW represents the within-cluster, within-period
correlation and ρI the interperiod (same cluster)
correl-ation, with the restriction thatρI≤ρW. It is intuitive that
there may be a stronger correlation between observa-tions within the same cluster and period than between observations within the same cluster but in different pe-riods. We note that this model specification is analogous to specifications proposed for two period cluster rando-mised cross-over trials [17]. An alternate but equivalent specification is with the use of ρI/ρW rather than ρI,
is the same irrespective of how far apart in time those observations are made.
Extensions to allow for treatment-effect heterogeneity across clusters
In multicentre individually randomised trials, in which centres can have both treatment and control observa-tions, treatment-effect heterogeneity can be investi-gated by including a treatment by centre interaction [26]. In stepped wedge trials, because each cluster is both exposed and unexposed, it is also possible to model treatment by cluster interactions. Others have already considered the issue of allowing for treatment by cluster heterogeneity in power calculations for stepped wedge trials [18, 27], although here we propose slightly different model parameterisations which make less restrictive assumptions. Extensions to allow for treatment-effect heterogeneity are consid-ered in model extensions C to E below, first using fixed effects and then using random effects.
Model extension C: varying treatment effect across strata of clusters–using fixed effects
In addition to examining heterogeneity in secular trends across strata, it might also be reasonable to examine treatment-effect heterogeneity across strata. So, in our case study set across two different hospitals, there may be pragmatic interest in how the treatment effect varies across these hospitals. This can be incorporated by in-cluding a fixed-effect interaction between treatment and strata, to model the different treatment effects in each stratum/strata:
Yi sð Þjl ¼ β0 þ βj þ θXi sð Þj þ θsXi sð ÞjZi sð Þ þ ui þ ei sð Þjl;
using the same notation as earlier, where Zi(s)
repre-sents a stratum covariate and now θs represents a
fixed-effect interaction between treatment status and stratum (again constrained such that θs is 0 for the
last strata).
The model includes a single underlying secular trend for all strata, but a different shift in treatment effect (con-stant over time) for each stratum. Interest in treatment-effect variation by strata may have very practical implica-tions, as it allows addressing the question of whether or not a treatment was effective in a subgroup of clusters.
Model extension D: treatment-effect heterogeneity across clusters–using random effects
Where interest lies in examining treatment-effect het-erogeneity across clusters themselves, rather than fixed subgroups of clusters, this can be achieved by including a random interaction between treatment and cluster. We parameterise this model as follows:
Yijl ¼ β0 þ βj þ θXij þ uT iXij
þ uCi 1−Xij
þ eijl:
The two random-effect termsuTianduCirepresent the
random interaction between treatment status and clus-ter. These two random effects have a different variance parameter for those exposed (uTi~N(0, σT2)) and those
unexposed (uCi~N(0, σC2)); and importantly, a
covari-ance between these two random effects (σTC). Note that
this model allows the variability between clusters to dif-fer between the intervention and control periods.
This parameterisation implies different pairwise corre-lations within clusters, depending on whether observa-tions are both unexposed, both exposed, or one exposed and one unexposed. In particular, it implies:
ρCT ¼
σCT
ffiffiffiffiffiffiffiffiffiffiffiffiffiffiffiffiffiffiffiffiffiffiffiffiffiffiffiffiffiffiffiffiffiffiffiffiffiffiffiffiffiffiffiffiffiffiffiffiffiffi σ2
C þ σ2e
σ2
T þ σ2e
q ; ρCC
¼ σ2C
σ2
C þ σ2e
; and ρT T ¼ σ 2
T
σ2
T þ σ2e ;
whereρCTrepresents the correlation between two
obser-vations in the same cluster but with different exposures; and ρTTand ρCCthe correlations between two
observa-tions in the same cluster and same treatment exposures. There is no restriction as to which of these correlations are larger due to the inclusion of the covariance term.
Extensions to allow for treatment-effect heterogeneity across time
In addition to treatment heterogeneity across clusters, treatment effects might vary with time. Because the SW-CRT is run over multiple time periods it is possible to investigate treatment by time interactions. Others have considered delayed treatment effects (i.e. an interaction between treatment and time since the cluster was ex-posed) [27]. We consider extending the basic model for treatment heterogeneity that varies over step. That is, we consider a fixed-effect interaction between time period and treatment.
Model extension E: treatment-effect heterogeneity across time–using fixed effects
Interest might lie in determining whether treatment ef-fects vary across time. This can be achieved by extending the basic Hussey and Hughes model to include a fixed interaction between treatment status and time period (step). We parameterise this model as follows:
Yijl ¼ β0 þ βj þ θXij þ θjXij þ ui þ eijl:
in the study. Again for identifiability, the treatment effect in the last time period is constrained to be 0 (θT= 0).
Note that this model extension modifies the fixed-effects components only and makes no modifications to the underlying correlation structure. We note that this fixed-effect interaction will be estimable only at time pe-riods in which there are both exposed and unexposed observations. So, in our case study, this will be across weeks 13 to 26.
Results
Each of the models described above was fitted to the case study. Recall that the primary aim in the case study was to evaluate whether there is a difference in the probability of women’s membranes being swept during labour both before and after the intervention. We fitted several models: an inappropriate model that does not account for time; the Hussey and Hughes basic model; and each of the model extensions de-scribed in the previous section. We report ORs, and so fit the logistic regression model.
These models can be fitted in any statistical package, such as SAS, R, or Stata. We used Stata 14 to fit models using the melogit function using maximum likelihood methods. This function uses mean-variance adaptive Gauss-Hermite quadrature (Stata’s default estimation method). We used the default number of integration points (7) and default starting values. For one model (ex-tension D) we observed convergence difficulty using the melogit function and used the xtmelogit function instead
– which is recommended by Stata as an alternative in cases of variance components being near the boundary of the parameter space.
We estimate the ICCs on the logistic scale [28] using the estat function where possible (although in more complicated models we estimate the ICC simply by tak-ing the ratio of variances and for these cases no confi-dence interval for the ICC is provided). We provide sample Stata code as Additional file 1. The results are summarised in Table 1. Of note there are 10 randomisa-tion steps, but 13 time periods in which there are both control and intervention observations, for which a treat-ment by time interaction is potentially estimable.
Basic model and implications of naïve (unadjusted for time) estimates
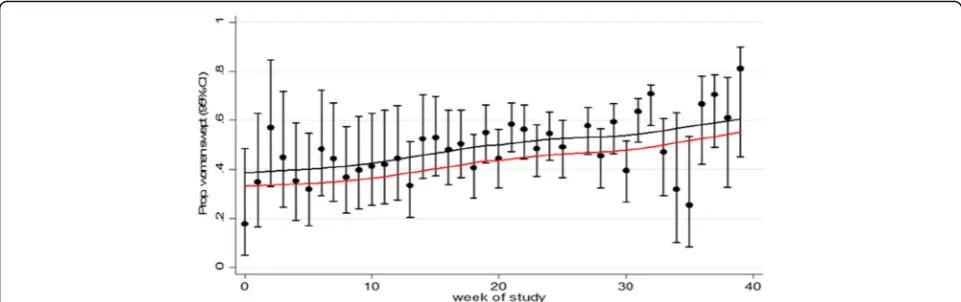
[image:6.595.60.540.468.680.2]Based on the observed data, there was a very small in-crease in the proportion of women swept in the period after exposure to the intervention (44.3% versus 46.4%). The naïve analysis, which accounts for treatment and a random effect for cluster (but not time), found a positive but nonstatistically significant effect of the intervention (OR 1.11; 95% CI 0.95 to 1.30). When modelling time as a categorical variable in those not exposed to the intervention there was some evidence of a small in-creasing trend over time in the proportion of women being swept (Fig. 3). Most notably, after adjusting for this secular trend, the estimated odds ratio shifted from favouring the intervention to favouring the con-trol. In particular, the adjusted analysis found a
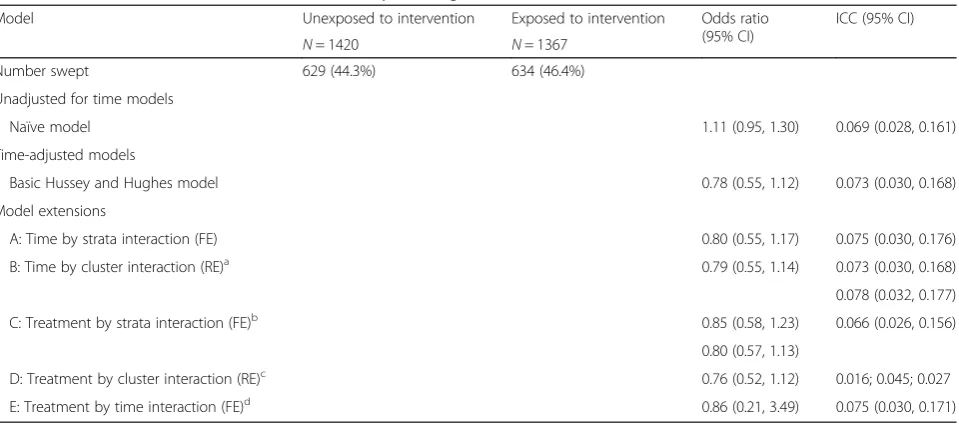
Table 1Estimates of treatment effect from the Hussey and Hughes model; and model extensions
Model Unexposed to intervention Exposed to intervention Odds ratio
(95% CI)
ICC (95% CI)
N= 1420 N= 1367
Number swept 629 (44.3%) 634 (46.4%)
Unadjusted for time models
Naïve model 1.11 (0.95, 1.30) 0.069 (0.028, 0.161)
Time-adjusted models
Basic Hussey and Hughes model 0.78 (0.55, 1.12) 0.073 (0.030, 0.168)
Model extensions
A: Time by strata interaction (FE) 0.80 (0.55, 1.17) 0.075 (0.030, 0.176)
B: Time by cluster interaction (RE)a 0.79 (0.55, 1.14) 0.073 (0.030, 0.168)
0.078 (0.032, 0.177)
C: Treatment by strata interaction (FE)b 0.85 (0.58, 1.23) 0.066 (0.026, 0.156)
0.80 (0.57, 1.13)
D: Treatment by cluster interaction (RE)c 0.76 (0.52, 1.12) 0.016; 0.045; 0.027
E: Treatment by time interaction (FE)d 0.86 (0.21, 3.49) 0.075 (0.030, 0.171)
CIconfidence interval,ICCintracluster correlation,FEfixed-effect interaction,RErandom-effect interaction.a
ICCs presented are within same cluster same period; and same cluster different period;b
Treatment effects for two strata (hospital A and hospital B);c
ICCs presented are within same cluster both treated; and same cluster both untreated; and same cluster different treatment;d
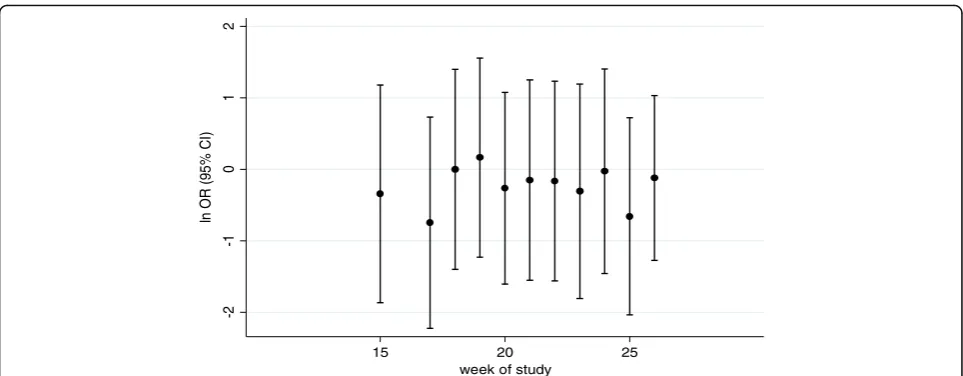
Treatment effect given is at mid study week 20–others are depicted in Fig.4. Note the ICC is re-ported on the logistic scale and so is not to be used for planning purposes. All models adjust for clustering
negative, but nonstatistically significant effect of the intervention (OR 0.78; 95% CI 0.55 to 1.12). The esti-mated ICC was 0.073 (95% CI 0.030, 0.168).
Models allowing for different secular trends
The case study was set across two different hospitals and so it is very possible that background trends differed between these two hospitals. We therefore allowed secu-lar trends to vary across these two hospitals (model ex-tension A). We observed no clear difference in underlying secular trends between the two hospitals (Figure not shown): inclusion of this term resulted in a nonsignificant interaction and the overall conclusions about the treatment effect did not change substantially (Table 1). We also fitted model extension B, allowing for random variation in the secular trend across the 10 clus-ters, as it seemed intuitive that as the study was con-ducted over 40 weeks that some time-dependent random variation was to be expected. Whilst we found that the correlation between observations in different time periods (0.073; 95% CI 0.030, 0.168) was slightly lower than between observations within the same time period (0.078; 95% CI 0.032, 0.177), the estimated treat-ment effect did not change substantially (Table 1). When fitting these model extensions, which allowed for differ-ing secular trends, we observed an increase in the width of the confidence intervals, reflecting a decrease in pre-cision associated with fitting a more flexible model.
Models allowing for treatment-effect heterogeneity
When we allowed for a fixed-effect interaction to inves-tigate treatment-effect heterogeneity across the two hos-pitals, we found that the interaction was not significant and the treatment effects similar between the two strata (Table 1, model extension C). In the model in which a random treatment by cluster interaction was included (model extension D), we observed some indication that
the correlation was lower between observations which were treated (point estimate 0.016) than between obser-vations which were not treated (point estimate 0.045). However, the treatment estimate changed little on allow-ing for this extra heterogeneity (Table 1). Allowallow-ing for treatment by time (step) interactions (model extension E) was uninformative as confidence intervals were very wide (Fig. 4). Again, all confidence intervals widened reflecting the decrease in precision associated with fit-ting these more complex models.
Discussion
The SW-CRT is a novel study design which is increasing in popularity and can be potentially valuable in the evaluation of service delivery and policy interventions [1, 2]. A recent systematic review found that a substan-tial proportion of stepped wedge studies published to date had failed to adjust for secular trends in the esti-mated treatment effect [9, 10]; and recent papers in high-impact journals have also failed to adjust for this confounder [14, 29]. We have demonstrated in this paper the consequences of not adjusting for time. Underlying secular trends in those clusters unexposed to the intervention in our example illustrates the real possibility of changes over time in the outcomes, irre-spective of any intervention. Furthermore, the common modelling framework proposed for the analysis of the SW-CRT by Hussey and Hughes – which does allow for secular trends – makes a number of assumptions. These include the assumption of a common underlying secular trend and a simple shift under treatment expos-ure across all clusters and all time periods. In this paper, we demonstrated how to explore sensitivities to deviations from these basic model assumptions. Whilst our case study did not prove to be sensitive to these model assumptions, it is important to note that this is unlikely to be the case in all studies.
Fig. 3Model-based estimate of underlying temporal trend in primary outcome over duration of trial in unexposed clusters (black line) and
model-based estimated of outcome in intervention periods (red line)–basic model for the case study. Point estimates and 95% CI for each step
[image:7.595.57.538.88.239.2]The impact of secular trends
In our example, we observed how the primary out-come increased over time in clusters unexposed to the intervention. The implication of this was that an intervention which prima facie appeared effective, al-beit with a small impact, actually transpired to be suggestive of an intervention which had an effect in the opposite direction. There are several possible ex-planations for this finding [5]. Firstly, the fully ad-justed confidence intervals did not rule out that the intervention may indeed be beneficial (i.e. the result was not statistically significant). Alternatively, contam-ination might be an explanation; that is, the unex-posed clusters becoming exunex-posed to the intervention before their randomised cross-over point. But, it might be the case that external to this intervention and study, other nationwide initiatives began, some-times described as a rising tide [30].
Modelling secular trends
Because of the inherent imbalance in treatment over time it is imperative that the primary analysis of a SW-CRT adjusts for time irrespective of whether it is statisti-cally significant. Time is a strong candidate for having a confounding effect in almost every SW-CRT and this lo-gical reasoning should dictate its criteria for inclusion rather than a reliance on statistical significance testing, or lack of, which is not useful for determination of con-founding [31]. In our example we observed the effect of calendar time to be reasonably linear. Modelling a linear trend will require fewer degrees of freedom than model-ling as a categorical variable and so should provide in-creased precision for the treatment effect. With a large number of steps, or where time is recorded continu-ously, it should also be possible to model the secular
trend using quadratic or cubic terms, or even fractional polynomials [32] or restricted cubic splines. With more than about four or five measurement occasions (or when time is measured continuously), fitting a parametric trend for time might result in more powerful statistical tests assuming that the modelled parametric trend actu-ally provides a reasonable approximation to the true underlying shape [33].
Extensions from the basic Hussey and Hughes model
The Hussey and Hughes model is becoming standard for use in the analysis of the SW-CRT. In our review we have identified that of the 32 published trials – 17 of these adjusted for secular trends and of these 7 used the Hussey and Hughes model [9]. We did not identify any studies that considered deviations from the basic model –either by modelling more flexible secular trends or ex-ploring treatment heterogeneity. Yet, the Hussey and Hughes model makes some important implicit assump-tions, namely, that the underlying secular trend is identi-cal across all clusters, and that the treatment produces a constant shift in this trend which is identical across all clusters and time points. It is important that these as-sumptions are recognised so that their appropriateness can be considered. We have outlined these assumptions and considered how they may be extended. We consid-ered extensions in which the secular trend was allowed to vary across clusters and the treatment effect was allowed to vary across clusters and time [34].
Correctly modelling the secular trend is important, otherwise the secular change might be mistakenly attrib-uted to the intervention. Modelling treatment-effect het-erogeneity might be considered less important if interest is in the average treatment effect but will affect the pre-cision of the treatment effect. Furthermore, implicit in a
-2
-1
0
1
2
ln
O
R
(9
5
%
C
I)
15 20 25
week of study
[image:8.595.57.539.86.274.2]model that assumes a single random intercept for the cluster is that the correlation between two observations in the same cluster is independent of their treatment status, an assumption that seems untenable. We ob-served a slight decrease in precision when we fitted these more complex models and this is to be expected more generally and is a reflection of model complexity. This will of course have implications on power –to the extent that appropriate consideration of these model ex-tensions at the power stage will result in an increase in sample size needed [22, 23].
We considered both extensions using random- and fixed-effect parameters. For the fixed-effects models we group clusters into strata. In our case study, the stratum is hospital as the study was set across two hospitals. Other choices for strata will be dependent on context. Fixed effects might be appropriate where there is a clear clinical interest in the effect of these strata. So, in our case study a clinical interest in whether the treatment ef-fect varies by these particular hospitals. There are clearly downsides though to the use of fixed effects as it will quickly reduce the degrees of freedom when the number of strata becomes large. Furthermore, when modelling the secular trend, the secular trend might be expected to vary across all clusters and not just across strata.
In our case study we did not find model choice to have an impact on the treatment effect or its precision (other than the model in which time was not included). This cannot and should not be taken as a generalisable result – we expect model misspecification to have a large im-pact in some situations. Indeed, model misspecification in generalised linear mixed models is known to be im-portant, as others have demonstrated in clustered data [35]. Misspecification can arise because of either misspe-cification of the model for the mean or misspemisspe-cification of the correlation structure. Misspecification of the mean might arise because of cluster-specific variation in secular trends perhaps, but these sorts of misspecifica-tions depend on the study and so are difficult to investi-gate generically. Misspecification of the correlation structure, however, can be investigated generically–and so, for example, future simulation studies should investi-gate the impact on bias and precision of treatment ef-fects estimated when there is decay in the correlation overtime but where this is ignored at the analysis stage.
Limitations
Although we have described extensions to the Hussey and Hughes approach, we did not examine the conse-quences of model misspecification on bias, coverage and power using simulations. There were also other exten-sions to the basic model which we did not consider. For example, an extension that we did not consider was to impose a structure on the cluster-level covariance over
time, such as linear or autoregressive decay in correla-tions over time. However, we did allow for an interaction between the time trend and some strata variable, but this will only be feasible where there is a natural choice for strata as it is not possible to model an interaction be-tween cluster and time as a fixed effect [36].
We limited our consideration to the generalised linear mixed model, but generalised estimating equations (GEEs) also allow for nonindependence in cluster trials [37]. Within the context of the SW-CRT, finite sample GEE correction methods have been proposed, but these are not widely available in Stata yet (though they are available in R) [38]. Including cluster as a fixed effect is a possibility; as too is an analysis using cluster-level means [39]; or something described by others as a verti-cal analysis [40]. Vertiverti-cal analyses involve separate ana-lyses at each time period and pooling time-specific treatment effects – using some sort of weighting methods. Vertical analyses are likely to make fewer as-sumptions, but at a cost of being less powerful [8].
We have also identified some more technical issues along the way. We observed model convergence issues with one of the model extensions (model D), which we were able to overcome using a different method of optimisation. We were also unable to obtain treatment by time interactions for all of our randomisation step points–due to scarcity of data. These complex models were fitted to data with only 10 clusters, and without any small sample correction fac-tors. Others have shown that this may have implications on bias and coverage, especially when using GEEs [38]. Finally, we reported correlations on the logistic scale. It is well known that for planning parallel cluster trials the ICC needed is on the proportions scale. However, whether the same principals apply to other correlations (such as inter-period correlations) is unknown. We also did not report confidence intervals for all correlation parameters, due to current statistical package limitations.
Conclusions
The SW-CRT is particularly appealing as it offers a means of conducting a randomised trial within a naturalistic set-ting. In order to successfully determine the effectiveness of an intervention evaluated using a SW-CRT, it is neces-sary to use appropriate analysis techniques because simple summary statistics (grouped by those exposed and not ex-posed to the intervention) will not be a fair summary of the effect of the intervention. In essence, this means that there is a necessity for allowing for underlying secular trends and it is this time-adjusted effect of the tion which is the unbiased estimate of how the interven-tion works. This adjusted effect, as shown in our examples, can be quite different to the unadjusted effect.
Furthermore, whilst the model proposed by Hussey and Hughes is becoming increasingly used at the ana-lysis stage, which does indeed adjust for time, it is im-portant to appreciate the assumptions implicit within this model– both the assumptions that are being made about secular trends and treatment effects; and the im-plied assumptions on the correlation structure. Further work, likely using simulation studies, is needed to deter-mine if model misspecification has important conse-quences in terms of bias or standard error of the intervention effect estimate.
Additional file
Additional file 1:Stata code to implement proposed models. (DOCX 14 kb)
Abbreviations
CI:Confidence interval; CRT: Cluster randomised trial; ICC: Intracluster
correlation; RCT: Randomised controlled trial; SW-CRT: Stepped wedge cluster randomised trial
Acknowledgements
KH acknowledges financial support for the submitted work from the National Institute for Health Research (NIHR) Collaborations for Leadership in Applied Health Research and Care (CLAHRC) for West Midlands.
Funding
KH acknowledges financial support for the submitted work from the National Institute for Health Research (NIHR) Collaborations for Leadership in Applied Health Research and Care (CLAHRC) for West Midlands.
Availability of data and materials
A Stata DO file of the commands needed to perform these analyses has been provided in Additional file 1.
Authors’contributions
KH conceived of the study, led in its design and coordination and drafted the manuscript. MT and AF helped write the paper and critically reviewed its contents. KH and AF carried out computation of examples. All authors contributed to the model developments. All authors read and approved the final manuscript.
Competing interests
The author(s) declare that they have no competing interests.
Consent for publication
All authors agree to publication and have approved the submitted version.
Ethics approval and consent to participate
No ethical approval or consent was required for this study which is the secondary analysis of a trial dataset.
Author details
1Institute of Applied Health Research, University of Birmingham, Birmingham B15 2TT, UK.2Clinical Epidemiology Program, Ottawa Hospital Research Institute, 1053 Carling Avenue, Ottawa, ON K1Y4E9, Canada.3Department of Epidemiology and Community Medicine, University of Ottawa, Ottawa, ON, Canada.4School of Public Health and Preventive Medicine, Monash University, Melbourne, VIC, Australia.
Received: 12 May 2016 Accepted: 6 February 2017
References
1. Brown CA, Lilford RJ. The stepped wedge trial design: a systematic review.
BMC Med Res Methodol. 2006;6:54.
2. Mdege ND, Man MS, Taylor (nee Brown) CA, Torgerson DJ. Systematic
review of stepped wedge cluster randomized trials shows that design is particularly used to evaluate interventions during routine implementation. J
Clin Epidemiol. 2011;64(9):936–48.
3. Hemming K, Haines TP, Chilton PJ, Girling AJ, Lilford RJ. The stepped wedge
cluster randomised trial: rationale, design, analysis and reporting. BMJ. 2015; 350:h391. doi:10.1136/bmj.h391.
4. The Gambia Hepatitis Study Group. The Gambia Hepatitis Intervention
Study. Cancer Res. 1987;47(21):5782–7.
5. King G, Gakidou E, Ravishankar N, Moore RT, Lakin J, Vargas M, et al. A
‘politically robust’experimental design for public policy evaluation, with
application to the Mexican universal health insurance program. J Policy
Anal Manage. 2007;26:479–506.
6. Leontjevas R, Gerritsen DL, Smalbrugge M, Teerenstra S, Vernooij-Dassen MJ,
Koopmans RT. A structural multidisciplinary approach to depression management in nursing-home residents: a multicentre, stepped-wedge
cluster-randomised trial. Lancet. 2013;381:2255–64.
7. Pearse R, Pedan C, Bion J, Faiz O, Holt P, Girling A, et al. HS&DR—12/5005/
10. Enhanced Peri-Operative Care for High-risk patients (EPOCH) trial: a stepped wedge cluster randomised trial of a quality improvement intervention for patients undergoing emergency laparotomy [protocol]. 2013. www.nets.nihr.ac.uk/projects/hsdr/12500510.
8. Davey C, Hargreaves J, Thompson JA, Copas AJ, Beard E, Lewis JJ, Fielding
KL. Analysis and reporting of stepped wedge randomised controlled trials: synthesis and critical appraisal of published studies, 2010 to 2014. Trials. 2015;16:358. doi:10.1186/s13063-015-0838-3. PubMed PMID: 26278667, PubMed Central PMCID: PMC4538923.
9. Martin J, Taljaard M, Girling A, Hemming K. A systematic review finds major
deficiencies in sample size methodology and reporting for stepped wedge cluster randomised trials. BMJ Open. 2016;6(2):e010166. doi:10.1136/ bmjopen-2015-010166.
10. Barker D, et al. Stepped wedge cluster randomised trials: a review of the statistical
methodology used and available. BMC Med Res Methodol. 2016;16:69.
11. Bland JM. Cluster randomised trials in the medical literature: two
bibliometric surveys. BMC Med Res Methodol. 2004;4:21.
12. Ivers NM, Taljaard M, Dixon S, Bennett C, McRae A, Taleban J, Skea Z,
Brehaut JC, Boruch RF, Eccles MP, Grimshaw JM, Weijer C, Zwarenstein M, Donner A. Impact of CONSORT extension for cluster randomised trials on quality of reporting and study methodology: review of random sample of 300 trials, 2000-8. BMJ. 2011;343:d5886. doi:10.1136/bmj.d5886. PubMed PMID: 21948873, PubMed Central PMCID: PMC3180203, Review.
13. Rutterford C, Taljaard M, Dixon S, Copas A, Eldridge S. Reporting and
methodological quality of sample size calculations in cluster randomised trials could be improved: a review. J Clin Epidemiol. In Press.
14. Dreischulte T, Donnan P, Grant A, Hapca A, McCowan C, Guthrie B. Safer
prescribing—A trial of education, informatics, and financial incentives. N
Engl J Med. 2016;374(11):1053–64. doi:10.1056/NEJMsa1508955.
15. Heo M, Kim N, Rinke ML, Wylie-Rosett J. Sample size determinations for
stepped-wedge clinical trials from a three-level data hierarchy perspective. Stat Methods Med Res. 2016. [Epub ahead of print].
16. Hussey MA, Hughes JP. Design and analysis of stepped wedge cluster
17. Parienti JJ, Kuss O. Cluster-crossover design: a method for limiting clusters level effect in community-intervention studies. Contemp Clin Trials. 2007;
28(3):316–23. Epub 2006 Oct 6.
18. Baio G, Copas A, Ambler G, Hargreaves J, Beard E, Omar RZ. Sample size
calculation for a stepped wedge trial. Trials. 2015;16:354. doi:10.1186/s13063-015-0840-9. PubMed PMID: 26282553; PubMed Central PMCID PMC4538764.
19. S Kenyon, S Dann, L Ingram, P Clarke, A Hogan, D Jenkinson, K Hemming.
Evaluation of bespoke training to midwifery teams to increase membrane sweeping to reduce induction of labour: a stepped wedge cluster randomised trial. Submitted for publication.
20. Ukoumunne OC, Thompson SG. Analysis of cluster randomized trials with repeated
cross-sectional binary measurements. Stat Med. 2001;20(3):417–33.7. 28(2):182-91.
21. Turner RM, White IR, Croudace T, PIP Study Group. Analysis of cluster
randomized cross-over trial data: a comparison of methods. Stat Med. 2007;
26(2):274–89.
22. Hooper R, Bourke L. Cluster randomised trials with repeated cross sections:
alternatives to parallel group designs. BMJ. 2015;350:h2925. doi:10.1136/bmj.h2925.
23. Girling AJ, Hemming K. Statistical efficiency and optimal design for stepped
cluster studies under linear mixed effects models. Stat Med. 2016. doi:10. 1002/sim.6850 [Epub ahead of print].
24. Hooper R, Teerenstra S, de Hoop E, Eldridge S. Sample size calculation for
stepped wedge and other longitudinal cluster randomised trials. Stat Med.
2016;35(26):4718–28. doi:10.1002/sim.7028.
25. Taljaard M, Teerenstra S, Ivers NM, Fergusson DA. Substantial risks associated
with few clusters in cluster randomized and stepped wedge designs. Clin Trials. 2016. [Epub ahead of print].
26. Brown H, Prescott R. Generalised linear mixed models, Applied mixed
models. In: Medicine. 3rd ed. Chichester: Wiley; 2014. doi:10.1002/ 9781118778210.ch3.
27. Hughes JP, Granston TS, Heagerty PJ. Current issues in the design and
analysis of stepped wedge trials. Contemp Clin Trials. 2015;45(Pt A):55–60.
doi:10.1016/j.cct.2015.07.006. Epub 2015 Aug 3. PubMed PMID: 26247569; PubMed Central PMCID: PMC4639463.
28. Eldridge SM, Ukoumunne OC, Carlin JB. The intra-cluster correlation
coefficient in cluster randomized trials: a review of definitions. Int Stat Rev.
2009;77(3):378–94.
29. van den Broek IV, van Bergen JE, Brouwers EE, Fennema JS, Götz HM,
Hoebe CJ, Koekenbier RH, Kretzschmar M, Over EA, Schmid BV, Pars LL, van Ravesteijn SM, van der Sande MA, de Wit GA, Low N, Op de Coul EL. Effectiveness of yearly, register based screening for chlamydia in the Netherlands: controlled trial with randomised stepped wedge implementation. BMJ. 2012;345:e4316. doi:10.1136/bmj.e4316. PubMed PMID: 22767614; PubMed Central PMCID: PMC3390168.
30. Dixon-Woods M, Leslie M, Tarrant C, Bion J. Explaining Matching Michigan:
an ethnographic study of a patient safety program. Implement Sci. 2013;8: 70. doi:10.1186/1748-5908-8-70. PubMed PMID: 23786847, PubMed Central PMCID:PMC3704826.
31. Rothman KJ, Greenland S, Lash TL. Modern epidemiology. 3rd ed.
Philadelphia: Lippincott, Williams & Wilkins; 2008.
32. Long J, Ryoo J. Using fractional polynomials to model non-linear trends in
longitudinal data. Br J Math Stat Psychol. 2010;63:177–203. doi:10.1348/
000711009X431509.
33. Fitzmaurice GM, Laird N, Ware JH. Applied longitudinal analysis. London:
Wiley; 2004.
34. Twisk JWR, Hoogendijk EO, Zwijsen SA, de Boer MR. Different methods to
analyze stepped wedge trial designs revealed different aspects of
intervention effects. J Clin Epidemiol. 2016;72:75–83.
35. Abad AA, Litière S, Molenberghs G. Testing for misspecification in
generalized linear mixed models. Biostatistics. 2010;11(4):771–86. doi:10.
1093/biostatistics/kxq019.
36. Morgan KE, Forbes AB, Keogh RH, Jairath V, Kahan BC. Choosing appropriate
analysis methods for cluster randomised cross-over trials with a binary
outcome. Stat Med. 2017;36(2):318–33. doi:10.1002/sim.7137.
37. Hubbard AE, Ahern J, Fleischer NL, Van der Laan M, Lippman SA, Jewell N,
Bruckner T, Satariano WA. To GEE or not to GEE: comparing population average and mixed models for estimating the associations between
neighborhood risk factors and health. Epidemiology. 2010;21(4):467–74.
doi:10.1097/EDE.0b013e3181caeb90.
38. Scott JM, deCamp A, Juraska M, Fay MP, Gilbert PB. Finite-sample corrected
generalized estimating equation of population average treatment effects in stepped wedge cluster randomized trials. Stat Methods Med Res. 2014.
[Epub ahead of print] PubMed PMID: 25267551; PubMed Central PMCID: PMC4411204.
39. Donner A, Klar N. Design and analysis of cluster randomization trials in
health research. London: Arnold; 2000. 0-340-69153-0.
40. Hayes RJ, Moulton LH. Cluster randomised trials. London: Chapman & Hall/CRC
Press. 2009.
• We accept pre-submission inquiries
• Our selector tool helps you to find the most relevant journal
• We provide round the clock customer support
• Convenient online submission
• Thorough peer review
• Inclusion in PubMed and all major indexing services • Maximum visibility for your research
Submit your manuscript at www.biomedcentral.com/submit