http://dx.doi.org/10.4236/jpee.2014.24061
Optimal Resources Dispatching Technology
of Distribution Network Rush-Repairing
Chao Zhang, Xinhe Chen, Xing Xiong, Jing Zhou, Wenbin Zhang
State Grid Electric Power Research Institute, Beijing, China
Email: [email protected], [email protected], [email protected],
[email protected], [email protected]
Received December 2013
Abstract
Confronted with the requirement of higher efficiency and higher quality of distribution network fault rush-repair, the subject addressed in this paper is the optimal resource dispatching issue of the distribution network rush-repair when single resource center cannot meet the emergent re-source demands. A multi-rere-source and multi-center dispatching model is established with the ob-jective of “the shortest repair start-time” and “the least number of the repair centers”. The optimal and worst solutions of each objective are both obtained, and a “proximity degree method” is used to calculate the optimal resource dispatching plan. The feasibility of the proposed algorithm is il-lustrated by an example of a distribution network fault. The proposed method provides a practical technique for efficiency improvement of fault rush-repair work of distribution network, and thus mostly abbreviates power recovery time and improves the management level of the distribution network.
Keywords
Distribution Network; Rush-Repairing; Multi-Objective and Multi-Resource Dispatching; Proximity Degree Method
1. Introduction
The power recovery efficiency of the power grid depends on the matching degree between the damage of the power grid and the rush-repair capability. The rush-repair capability of the power gird depends on the repair re-source reserves, field circumstance and the dispatching capability. The rere-source reserves are fundamental to the rush-repair work. And the resources dispatching technology is critical for the fast recovery to meet with the re-quirement of the distribution network fault rush-repair [1]-[5].
When the power grid is facing with the continuous or extensive attack, such as severe weather or geological disaster, rush-repair crew will be very busy and the repairing resource might not be able to meet with the emer-gency resource demands.
implies that it is hard to make an optimal decision. Besides, there is not evaluation criterion for the decision made by the commander until the rush-repair work is done. In this paper, a reasonable evaluation criterion and corresponding techniques for the decision making are studied to figure out the optimal resource dispatching plan.
2. Modelling for Resource Dispatching
2.1. The Resource Dispatching Process
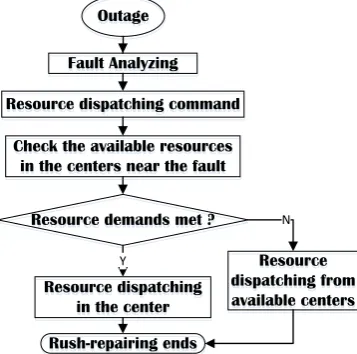
When a power outage event happen in the power grid, the rush repairing command center analyzes the outage cause based on the information from DSCADA, electricity usage data acquisition system, 95,598 customer ser-vice system, and etc.. According to the fault analysis, the command center recognizes the needed type and amount of the repair resources and then sends dispatching order to the resource centers. The dispatching process is shown in Figure 1.
2.2. Resource Dispatching Modelling
Sufficient repair resources are the fundamental requirement for the distribution network rush-repairing. In a rush-repair work, there will be n involved resource centers, which are notated asA A1, 2,…,An. Meanwhile, there
will be m (m > 1) types of repair resources needed in fault location A. The types of resources are notated as
1, 2, m
X X …,X , and the amount needed for every resource isx x1, 2,…,xm, respectively. xij and xij' is
as-sumed to be the resource reserve and supplying amount of the jth type of resource from the ith resource center, in which 1≤ ≤i n , 1≤ ≤j m and
1
n
ij j i
x x
=
≥
∑
. The delivery time from Ai to A is ti ( ti>0), assuming1 2 tn
t ≤ ≤t …≤ . The optimal resource dispatching plan implies that the start-time of the rush-repairing work is shortest and the number of involved resource centers is minimized.
Assuming the optimal plan is
ϕ
, which is specified as1 2
={ , , m}
ϕ ϕ ϕ …,ϕ (1)
where,
{
(
d1 d1) (
d2 d2) (
dk dk)
}
' ' '
, , , , , ,
j A x j A x j A x j
ϕ = represents the rush-repairing plan for the jth resource. If the selected resource center d d1, 2,…,dk from all of n centers satisfy the demand of the jth resource, we
have
' 1
d ji
k
j i
x x
= =
∑
, ( j=1, 2,…,m) (2)where, d 2
1
' ' ' d d
, ,
j j kj
x x …,x are the supplying amount of the jth resource from the selected resource centers, sep-arately. The set of all the dispatching plans is Ω .
Outage Outage
Resource demands met ? Resource demands met ?
Y
N
Resource dispatching from available centers
Resource dispatching from available centers Check the available resources
in the centers near the fault Check the available resources
in the centers near the fault Resource dispatching command Resource dispatching command
Rush-repairing ends Rush-repairing ends
Fault Analyzing Fault Analyzing
Resource dispatching in the center Resource dispatching
[image:2.595.208.387.522.699.2]in the center
Definition 1: The number of the selected resource centers is N
( )
ϕ
and the start-time of the rush-repair work is T( )
ϕ
, which implies that all the needed repair resources arrive at the fault location in T( )
ϕ
with their demand satisfied. Thus,( ) max( )i
T ϕ = t , i=d d1, 2,…,dk (3)
The objective of the resource dispatching is to minimize the start-time of the rush-repair work and the number of the resource centers involved. That is
min( ( )) min( ( ))
.
T
N
st
ϕ ϕ ϕ
∈Ω
(4)
The Equation (4) is a multi-target decision-making problem which can be solved by the technique of order preference by similarity to ideal solution. Therefore, the positive distance and the negative distance to the ideal solution can be worked out from the two following objective functions.
min( ( )) .
T st
ϕ ϕ
∈Ω (5) min( ( ))
. N st
ϕ ϕ
∈Ω (6)
Assume
ϕ
′′,ϕ
′′ is the best and worst solution of the Equation (5), separately. Andϕ ϕ
′, ′ is the best and worst solution of the Equation (6), separately. The proximity degree between a dispatching plan ϕv and thebest solution can be expressed as:
1 2
( ) ( )
( ) ( )
v
v v
N T
R
N T
ϕ ϕ
ω ω
ϕ ϕ
′ ′′
= + (7)
Similarly, the proximity degree between the plan ϕv and the worst solution can be expressed as:
1 2
( ) ( )
( ) ( )
v v
v
N T
r
N T
ϕ ϕ
ω ω
ϕ ϕ
= +
′ ′′ (8)
In the Equation (8), ω1 and ω2 are the weight of “the number of the resource center” and “the start-time of
the rush-repair work”, separately, and ω ω1+ 2=1. The specific value can be obtained by specialists. In this
pa-per, both of them are 0.5. The relative proximity degree between the plan ϕv and the ideal solution can be
ex-pressed as follows:
v v
v v
R
R r
ε =
+ ,0≤εv≤1 (9)
Therefore, the multi-objective decision-making problem can be translated to the proximity degree problem between the suggested solution and the ideal solution. The solution which obtains the maximal proximity degree
v
ε is optimal [6].
3. The Solution to the Resource Dispatching Problem
( )
" ,( )
"N ϕ N ϕ and T
( )
ϕ" ,T( )
ϕ" should be solved firstly for the Equations (7)-(9).3.1. The Solution to the
T
( )
ϕ
"
,
T
( )
ϕ
"
The resource centers involved should be near enough to make sure that the start-time of the rush-repair work is as earlier as possible.
Assume the resource centers A A1, 2,…,An are ranked by the delivery time to the fault location from shortest
to longest. If
1
0 0
j j
q q
pj j pj
p p
x x x
−
= =
< ≤
where x0j=0, the optimal dispatching plan for the jth resource with the objective of the shortest delivery time
can be expressed as:
1 1 1 2 2
0
( , ), ( , ), ( , )
j j
q
j j j q j pj
p
A x A x A x x
ϕ
−
=
′ = …, −
∑
(10)Thus,tqj which is the delivery time of the j
th resource from the resource center A
qj to the fault location, is the
shortest delivery time for the jth resource.
Similarly, the shortest delivery time for the other resources can be obtained. And the best solution to the Equ-ation (5) is
ϕ
′={
ϕ ϕ
1′ ′, 2,…,ϕ
m′}
.Therefore
1 2 ( ) max(q , q , , qm)
T
ϕ
′′ = t t t (11)And
( ) ( ) n
T
ϕ
′′ ≤Tϕ
≤t (12)Notice that the longest delivery time istn, that is:
( ")=n
T
ϕ
t (13)3.2. The Solution to the
N
( )
ϕ
'
,
N
( )
ϕ
'
Similar to Section 3.1, assume the resource centers A A1, 2,…,An are ranked by the resource reserve of the jth
resource from least to most.
The optimal dispatching plan for the jth resource with the objective of the least number of the involved re-source centers can be expressed as:
1 1 2 2
1 1
( , ), ( , ), , ( , )
j pj j
p
j k k j k k j k j k j
i
A x A x A x x
ϕ
−
=
= −
∑
… (14)
where, pj is least number of the involved resource centers for the jth resource.
Therefore, the least number of the involved resource centers of the rush-repair work is
max max( 1, 2, m)
N = p p p (15)
And for every dispatching plan ϕ,
max
( )
N
≤
N
ϕ
≤
n
(16)3.3. The Solution to the Dispatching Problem
In the resource dispatching optimization problem, not only the number of the involved resource centers is con-sidered to be as small as possible, but also the start-time of the rush-repair work should be as early as possible. Therefore, the dispatching plan whose relative proximity degree εv is the biggest is taken as the optimal
solu-tion.
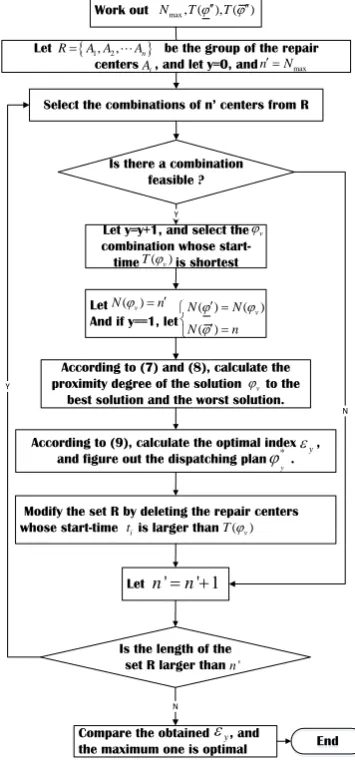
The calculation steps of the εv are as follows:
Step 1: Work outNmax, T
( )
ϕ" ,T( )
ϕ" ;Step 2: Let the set R = {A A1, 2,…,An} be the group of the repair centers, n′ =Nmax and the serial number
y = 0;
Step 3: Select combinations of n′ centers from the set R. If there is not a combination feasible, go to step 9; Step 4: Let y = y + 1, Select the combination ϕv whose start-time T(ϕv) is shortest from all of the
availa-ble feasiavaila-ble combinations;
Step 5: Let N(
ϕ
v)=n', and if y = 1, let'
( ) ( v)
N ϕ =N ϕ and N(
ϕ
')=n;Step 6: According to the Equation (7) and (8), calculate the proximity degree of between ϕv and the ideal
solution;
Step 7: Obtain the εy by Equation (9), and figure out the dispatching plan *
Step 8: Modify the set R by deleting the repair centers whose start-time ti is longer than T(ϕv);
Step 9: Let n′= +n′ 1;
Step 10: If the length of the set R is larger than n', go to step 3; or else, go to step 11; Step 11: Compare the obtained εy, and the largest one is optimal
The flow chart of the algorithm is shown in Figure 2.
4. Case Study
In this study case, the distribution power grid was affected by storm. Based on GIS technology, the rush-repair- ing center confirmed that the fault location is A. The dispatching plan of the required repair resources should be optimized to ensure the efficient of the rush-repair work.
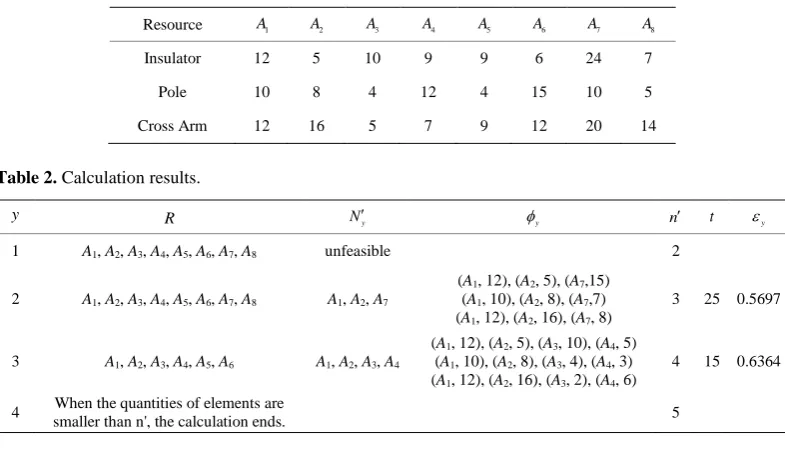
In this rush-repairing, 32*insulator (XPW-7)\25*pole (18 m) and 36*Cross Arm (1 meter) are required. There are eight available resource centers near fault location A, and their resource reserves are shown in Ta-ble 1.
The weights ω1 and ω2 are set to be 0.5. As is shown in Table 2, the biggest relative proximity degree is 0.6364 (y = 3). Therefore, the third dispatching plan whose start-time is 15 minutes is the optimal one.
The delivery time for every center is 10, 12, 14, 15, 20, 22, 25 and 30 minutes, separately. Follow the algorithm proposed in this paper, the calculation results are shown in Table 2. The details of the optimal plan are shown in Table 3.
Let
According to (7) and (8), calculate the proximity degree of the solution to the
best solution and the worst solution. Work out
Let be the group of the repair centers , and let y=0, and
Select the combinations of n’ centers from R
Is there a combination feasible ?
Is the length of the set R larger than
Modify the set R by deleting the repair centers whose start-time is larger than
' ' 1
n = +n
Y
N Y
Let
And if y==1, let
N
y
ε
According to (9), calculate the optimal index , and figure out the dispatching plan . * εy
y
ϕ
max n′ =N
Let y=y+1, and select the combination whose start-time is shortest
max, ( ), ( ) N Tϕ′′ Tϕ′′
( ) ( ) ( )
v
N N
N n
ϕ ϕ
ϕ ′ =
′ =
v ϕ
( v)
Tϕ
( v)
Nϕ = ′n
i
t T(ϕv)
'
n
{1, 2, n}
R= A AA
i
A
Compare the obtained , and the maximum one is optimal
v ϕ
End
[image:5.595.209.387.323.704.2]End
Table 1. The resource reserves.
Resource A1 A2 A3 A4 A5 A6 A7 A8
Insulator 12 5 10 9 9 6 24 7
Pole 10 8 4 12 4 15 10 5
[image:6.595.101.494.98.327.2]Cross Arm 12 16 5 7 9 12 20 14
Table 2. Calculation results.
y R Ny′ φy n′ t εy
1 A1, A2, A3, A4, A5, A6, A7, A8 unfeasible 2
2 A1, A2, A3, A4, A5, A6, A7, A8 A1, A2, A7
(A1, 12), (A2, 5), (A7,15)
(A1, 10), (A2, 8), (A7,7)
(A1, 12), (A2, 16), (A7, 8)
3 25 0.5697
3 A1, A2, A3, A4, A5, A6 A1, A2, A3, A4
(A1, 12), (A2, 5), (A3, 10), (A4, 5)
(A1, 10), (A2, 8), (A3, 4), (A4, 3)
(A1, 12), (A2, 16), (A3, 2), (A4, 6)
4 15 0.6364
4 When the quantities of elements are
[image:6.595.155.441.342.410.2]smaller than n', the calculation ends. 5
Table 3. The optimal resource dispatching plan.
Resource A1 A2 A3 A4
Insulator (XPW-7) 12 5 10 5
Pole (18 m) 10 8 4 3
Cross Arm (1 m) 12 16 5 6
5. Conclusion
In this paper, the optimal resource dispatching issue of the distribution network rush-repair is studied. The dis-patching model is established first with the objective of “the shortest repair start-time” and “the least number of the repair centers”. And a “proximity degree method” is used to calculate the optimal resource dispatching plan. The feasibility of the proposed algorithm is illustrated by an example of a distribution network fault. The pro-posed method provides a practical technique for efficiency improvement of fault rush-repair work of distribution network, and thus mostly abbreviates power recovery time and improves the management level of the distribu-tion network.
References
[1] Cui, W. and Wang, B.D. (2002) Development and Application of an Electrical Rush Repair Scheduling System. Auto- mation of Electric Power Systems, 26, 64-67.
[2] Lu, Z.G., Sun, B. and Liu, Z.Z. (2011) A Rush Repair Strategy for Distribution Networks Based on Improved Discrete Multi-Objective BBC Algorithm after Discretization. Automation of Electric Power Systems, 35, 55-59.
[3] Tao W.W., Zhang, H.B. and Ding, J.Y. (2010) Design of Multi-Level Synthetical Intelligent Decision-Making Support System for Secure Operation of Large-Scale Regional Power Network. Power System Technology, 34, 80-86.
[4] US-Canada Power System Outage Task Force (2004) Final Report on the August 14, 2003 Blackout in the United States and Canada: Causes and Recommendations.
[5] Yang, Y.H., Zhang, D.Y. and Ma, S. (2004) Study on the Architechture of Security and Defense System of Large- Scale Power Grid. Power System Technology, 28, 23-27.