http://dx.doi.org/10.4236/ojrad.2015.53021
Evaluation of Effective Dose Using the
k-Factor of Optimal Scan Range for CT
Examination
Masanao Kobayashi
1, Yasuki Asada
1, Kosuke Matsubara
2, Tomonobu Haba
3,
Yuta Matsunaga
4, Ai Kawaguchi
5, Kazuhiro Katada
6, Hiroshi Toyama
6,
Kichiro Koshida
2, Ryoichi Kato
1,
Shouichi Suzuki
11Graduate School of Health Sciences, Fujita Health University, Toyoake, Japan
2Division of Medical Sciences, Graduate School of Medical Sciences, Kanazawa University, Kanazawa, Japan 3Department of Radiology, Fujita Health University Hospital, Toyoake, Japan
4Department of Imaging, Nagoya Kyoritsu Hospital, Nagoya, Japan 5Department of Radiology, Toyota Memorial Hospital, Toyota, Japan
6Department of Radiology, Fujita Health University School of Medicine, Toyoake, Japan
Email: [email protected]
Received 9 July 2015; accepted 29 August 2015; published 1 September 2015
Copyright © 2015 by authors and Scientific Research Publishing Inc.
This work is licensed under the Creative Commons Attribution International License (CC BY). http://creativecommons.org/licenses/by/4.0/
Abstract
The American College of Radiology opened the computed tomography (CT) dose index registry (DIR) for general participation by all facilities in 2011. For each CT examination, data on volume CT dose index (CTDIvol), dose-length product (DLP), and, for body examinations, size-specific dose estimate (SSDE) were collected. However, effective dose is not estimated in DIR. The primary ob-jective of this study was to estimate k-factor profile in detail at various scan positions with mod-ified the ImPACT CT patient dosimetry. A tool that easily estimates the k-factor of suitable scan areas is essential for practical dose estimation in the DIR. We evaluated k-factor (effective dose/ DLP) profiles between a medical international radiation dose-five (MIRD-5) phantom positions using aImPACT software. As a result of this study, practicality of the k-factor profile method in clinical use was clarified. We speculate that a flexible k-factor improves the appropriateness of the E in hospital settings.
Keywords
1. Introduction
The American College of Radiology (ACR) opened the computed tomography (CT) dose index registry (DIR) for general participation by all facilities in May 2011 [1]. The registry has more than 750 registered facilities, 465 of which were actively contributing data at the end of August 2013 [1]. For each CT examination, data on volume CT dose index (CTDIvol), dose-length product (DLP), and, for body examinations, size-specific dose es-timate (SSDE) [2] were collected and used for protocol reviews. According to a supplement 127 by the Digital Imaging and Communications in Medicine (DICOM) standards committee [3], effective dose (E) evaluation method has been defined using DLP and the E conversion factor (E/DLP (k-factor) was introduced in the Inter-national Commission on Radiological Protection (ICRP) publication 102 [4]) by code value 113,800. However, E is not estimated in the ACR-DIR.
In a 2008 report by the United Nations Scientific Committee on the Effects of Atomic Radiation (UNSCEAR)
[5], the contribution of CT examination to the total collective E due to diagnostic medical examinations is ap-proximately 47% in the health-care level 1 countries. E provides an approximate index of potential detriment between various procedures; it is not used to determine individual risk. Therefore, E should be estimated to pro-vide facilities a tool to allow them to compare their dose index with diagnostic reference levels (DRLs) [4].
As reported in the annals of the ICRP publ.102 [4], the k-factors are properly understood for only six scan areas (head and neck, head, neck, chest, abdomen and pelvis, and trunk). However, CT examinations in diverse areas are performed: spine (cervical, thoracic, and lumber), coronary, appendix, renal, kidneys, liver, pancreas, aorta, colon, and dental. Moreover, the documented k-factors should not be interpreted beyond their intended purpose [6]. Therefore, estimating the k-factors of suitable scan areas may improve the practicality of E estima-tion.
The primary objective of this study was to estimate k-factor profile in detail at various scan positions with modified the ImPACT CT patient dosimetry, which was recently reported by Kobayashi [7]. A tool that easily estimates the k-factor of suitable scan areas is essential for practical dose estimation in the DIR.
2. Materials and Methods
The ImPACT software, which was released by the Imaging Performance Assessment of CT scanners (ImPACT) group of the Scanner Evaluation Center of the United Kingdom National Health Service (NHS), adopted the Monte-Carlo dose datasets simulated by the National Radiological Protection Board (NRPB) as NRPB-SR250
[8] [9]. ImPACT reflects the further development of a method to map results from the original 23-scanner data sets to other CT scanners by applying so-called “ImPACT factors” on the basis of tube voltage-dependent CTDI in free air (CTDIair) and CTDI in the center (CTDI100,c) with either a standard head or standard body polyme-thylmethacrylate phantom. The Medical International Radiation Dose (MIRD)-5 mathematical phantom used in ImPACT was divided from head to mid-thigh into 208 axial slabs of 5-mmthick. Although the basic data of such software must be continually updated to comply with the latest CT scanner. Therefore, we modified the Im-PACT software (ImIm-PACTmod.) to estimate DLP and E of a 320-multidetector row CT scanner (MDCT: Aquilion ONE ViSION Edition; Toshiba Medical Systems) [7].
2.1. Evaluation of the k-Factor Profile
In the ImPACTmod., the scan conditions were as follows: X-ray tube voltage and current = 120 kV and 50 mA, respectively; scan rotation time = 1.0 s/rotation; beam width = 2.0 mm (slice width of four multidetector row = 0.5 mm); pitch factor = 1.0. For the scan area, we sequentially set each axial slab (208 slabs covering the head to mid-thigh; nominal length of 5 mm along the z-axis) using a MIRD-5 phantom. Note that the radiation doses (CT dose index (CTDI), DLP, and E) were divided by 2.5—the factor relating the axial slab length to the beam width. The DLP was calculated by integrating the CTDI from the polymethylmethacrylate phantoms (PMMA: head; 16 cm φ and body; 32 cmφ) along the scan length. The obtained DLPs were 6.17 mGy·cm for the head (used as a proxy for the head-to neck area) and 2.73 mGy·cm for the body (used for the trunk area). Then theE was automatically calculated from the sex-averaged tissue weighting factors reported in ICRP publ.103 [10] and Monte-Carlo dose datasets. The k-factor was then calculated as follows:
-factor E
k
DLP
2.2. Comparison of k-Factors
To assess the validity of k-factor profile, we compared the k-factors of the six basic scan areas computed by ImPACTmod. (k-factorImPACT) and ICRP publ.102 (k-factorICRP). The coefficient over the scan area was confirmed by estimating the minimum and maximum k-factorsImPACT.
2.3. Comparison of E Determined in the Phantom Study and k-Factor Studies
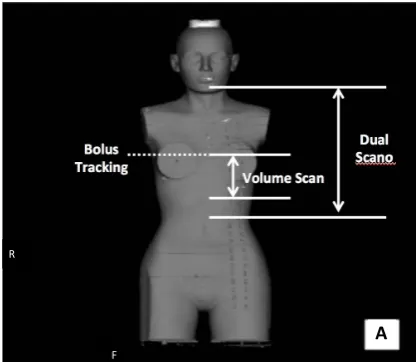
[image:3.595.237.393.230.444.2]We compared the E of coronary CT angiography (CCTA) examination derived from a human-body phantom (Alderson Rando phantom; 175 cm, 73.5 kg) study and k-factor (k-factorImPACT and k-factorICRP) studies. The phantom study employed a 320-MDCT and an electrocardiograph (ECG: IVYl 3000, Chronos Medical Devices, Inc., Chiba, Japan). The scan protocols and positions were summarized in Table 1andFigure 1.
Figure 1. Schema for MIRD-5 phantom of ImPACT CT patient dosimetry. Measure shows the relationship between bolus tracking position and organ position.
Table 1. Scan conditions for coronary CT.
Scan mode Dual scano Volume scan (target CTA) Bolus tracking Volume scan (prospective CTA)
Tube voltage (kV) 120 120 120 120
Tube current (mA) 10 90 20 450
Scan length (mm) 400 128 2 128
Slice No* 9 - 24 16 - 21 16 16 - 21
Field of view 320 (M) 320 (M) 320 (M)
Scan time (sec) 2.55
Active time (sec) 0.275
Cardiac phase (%) 75 70 - 80
Beat 1 1
CTDIvol (mGy) 2.2 13.4 11.5
DLP (mGy∙cm) 29.6 2.7 151.2
[image:3.595.91.538.494.706.2]In the phantom study, the thermoluminescent dosimeter (TLD) elements (MSO-S, Kyokko, Japan) in the Rando phantom on the 320-MDCT table were irradiated by the CT scanner. The amount of fluorescence (M) was measured by a TLD reader (Model 3000; Kyokko, Japan) and corrected by an individual calibration factor. The TLD elements were then calibrated at an air kerma of 10 mGy supplied by an effective energy of 54.6 keV (half-value layer (HVL) of aluminum (99.9%) = 7.88 mm Al). The calculations are summarized below:
air
D =M×f (2)
(
)
(
)
air
soft tissue etc
air
en
en D D µ ρ
µ ρ
= × (3)
1.0
T
H = ×D (4)
T T
E=
∑
W ×H (5)In Equations (2)-(5), Dair and D are the air-absorbed and tissue/organ-absorbed doses respectively, M denotes the fluorescence, and f is the correction factor obtained by calibration. The quantity (µen/ρ) is the ratio of the mass energy absorption coefficient, WT is the tissue/organ weighting factor in ICRP publ.103 [10], and HTand E denote the equivalent and effective doses, respectively.
In the k-factor studies, E was calculated from the k-factorICRP of adult chest (0.014 mSv∙mGy−1∙cm−1) and the arbitrary k-factorImPACT over the scan area.
Effective dose=DLP k× -factor (6)
Then the DLP displayed on the CT console was used in the CCTA examination.
3. Results
We first investigated the E profile, which was evaluated from the ImPACTmod., and calculated the k-factorImPACT profile using Equation (1) (Figure 2). The E profile and k-factorImPACT profile showed almost identical trends, but the latter was influenced by the DLP (head-neck; 6.17 mGy∙cm and body; 2.73 mGy∙cm). The E in the thy-roid, breast, upper-abdomen, and gonads (0.074, 0.122, 0.062, and 0.052 mSv, respectively) were higher than those in other areas, and the k-factorImPACT increased accordingly (0.012, 0.045, 0.062, and 0.052 mSv·mGy−1·cm−1 respectively).
[image:4.595.208.417.520.701.2]Each k-factorImPACT was obtained by the average k-factorImPACT profile between the MIRD-5 phantom posi-tions of six scan areas (Figure 3).The k-factorImPACT of the chest area was 46% (0.0065 mSv·mGy−1·cm−1) high-er than that value of the k-factorICRP (Table 2). The areas of others were similar to those values in the k-factorICRP. However, k-factorImPACT fluctuated intensely between the phantom positions (See Table 2; the minimum- and/or maximum-value, which have a relation to the MIRD-5 phantom positions).
Figure 2. Scan length of dosimetry for coronary CT.
A
R
Figure 3. Comparison between different bolus tracking positions in terms of the effective dose and k-factor.
Table 2. Comparison of the k-factor between ICRP publ.102 and this study.
Head and neck Head Neck Chest Abdomen and
pelvis Trunk
ICRP publ.102 0.0031 0.0021 0.0059 0.014 0.015 0.015
Ave. 0.0037 0.0021 0.0061 0.0205 0.015 0.0169
(Min-max) (0.0002 - 0.0154) (0.0002 - 0.0032) (0.0015 - 0.0154) (0.0059 - 0.0447) (0.0088 - 0.0227) (0.0059 - 0.0447)
Position 208 - 161 208 - 180 179 - 161 160 - 108 107 - 12 160 - 12
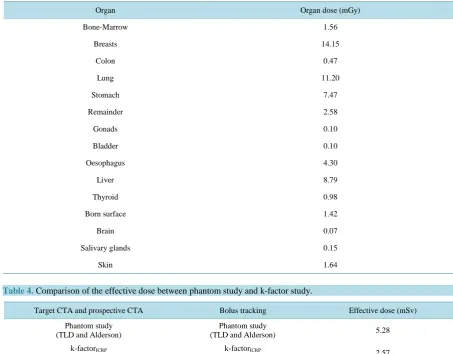
To clarify the practicality of a concept of k-factorImPACT profile method in clinical use, we compared the E evaluated in a phantom study and k-factor studies. In the phantom study, the D was especially high in the fol-lowing (Table 3): breast (14.15 mGy), lung (11.20 mGy), liver (8.79 mGy), and stomach (7.47 mGy). The E (5.28 mSv) was then calculated by the WT and compared with the results of the k-factor studies (Table 3and Table 4). In contrast, the E by k-factorICRP (0.0014 mSv·mGy−1·cm−1) and k-factorImPACT (volume scan = 0.028 mSv·mGy−1·cm−1 and bolus tracking = 0.0414 mSv·mGy−1·cm−1) were 2.57 mSv and 5.26 mSv, and those dif-ferences from the phantom study were 51% and 1%, respectively.
4. Discussion
In this study, we have showed that concept of k-factorImPACT profile methods to evaluate the k-factor of a suita-ble scan area. In addition, the practicality of the method in clinical use was clarified.
The k-factorImPACT is widely used to estimate the E [5]. However, it has been given for only six scan areas. In UNSCEAR 2008 report [5] provides the E of medical examinations involving CT examinations in various areas: spine (cervical, thoracic, and lumber), coronary, appendix, renal, kidneys, liver, pancreas, aorta, colon, and den-tal. Therefore, increasing the flexibility of the k-factor is a crucial goal in E assessment to manage E in DIR.
Table 3. Comparison of the organ doses.
Organ Organ dose (mGy)
Bone-Marrow 1.56
Breasts 14.15
Colon 0.47
Lung 11.20
Stomach 7.47
Remainder 2.58
Gonads 0.10
Bladder 0.10
Oesophagus 4.30
Liver 8.79
Thyroid 0.98
Born surface 1.42
Brain 0.07
Salivary glands 0.15
[image:6.595.95.539.400.511.2]Skin 1.64
Table 4. Comparison of the effective dose between phantom study and k-factor study.
Target CTA and prospective CTA Bolus tracking Effective dose (mSv)
Phantom study (TLD and Alderson)
Phantom study
(TLD and Alderson) 5.28
k-factorICRP
0.0140
k-factorICRP
0.0140 2.57
k-factorICRP
0.0140
k-factorImPACT
0.0410 2.64
k-factorImPACT
0.0285
k-factorImPACT
0.0410 5.26
mined using the voxel models phantom, which is constructed from the medical image data of real patients, and thus provides a more realistic description of the human body. Therefore, E assessment from the voxel models phantom should be included in the future studies of the k-factor.
5. Conclusion
In this study, we have showed that concept of k-factorImPACT profile methods to evaluate the k-factor of a suita-ble scan area. We speculate that a flexisuita-ble k-factor improves the appropriateness of the E in hospital settings.
References
[1] Chatfield, M.B. and Morin, R.L. (2013) The ACR Computed Tomography Dose Index Registry: The 5 Million Ex-amination Update.
http://www.acr.org/~/media/ACR/Documents/PDF/QualitySafety/NRDR/DIR/DIR%205%20Million%20Examinations %20Update.pdf#search='The+ACR+Computed+Tomography+Dose+Index+Registry%3A+The+5+Million+Examinati on+Update
[2] AAPM Report No 204 (2011) Size-Specific Dose Estimates (SSDE) in Pediatric and Adult Body CT Examinations.
[4] ICRP Publication 102 (2007) Managing Patient Dose in Multi-Detector Computed Tomography (MDCT).
[5] United Nations Scientific Committee on the Effects of Atomic Radiation (2010) UNSCEAR 2008 Report to the Gener-al Assembly with Scientific Annexes. Volume I.
[6] Shrimpton, P.C. and Wall, B.F. (2009) Effective Dose and Dose-Length Product in CT. Radiology, 250, 604.
http://dx.doi.org/10.1148/radiol.2502081340
[7] Kobayashi, M., Asada, Y., Matsubara, K., et al. (2014) Evaluation of Organ Doses and Effective Dose According to the ICRP Publication 110 Reference Male/Female Phantom and the Modified ImPACT CT Patient Dosimetry. Journal ofApplied Clinical Medical Physics, 15, 1-10.
[8] Impactscan. “Impactscan.org.” (2015) http://www.impactscan.org
[9] Jones, D.G. and Shrimpton, P.C. (1993) Normalized Organ Doses for X-Ray Computed Tomography Calculated Using Monte Carlo Techniques NRPB Report SR250. National Radiological Protection Board, Didcot.
[10] ICRP Publication 103 (2009) The 2007 Recommendations of the International Commission on Radiological Protection.
[11] Zhang, Y., Li, X., Segars, W.P. and Samei, E. (2012) Organ Doses, Effective Doses, and Risk Indices in Adult CT: Comparison of Four Types of Reference Phantoms across Different Examination Protocols. Medical Physics, 39, 3404- 3423.http://dx.doi.org/10.1118/1.4718710