http://dx.doi.org/10.4236/ajac.2014.510073
Cations and Anions in Sewage Sludge from
Gaza Waste Water Treatment Plant
Ibrahim Y. El-Nahhal1, Husam Al-Najar1, Yasser El-Nahhal2 1Faculty of Civil Engineering, The Islamic University Gaza, Gaza, Palestine 2Faculty of Science, The Islamic University Gaza, Gaza, Palestine
Email: y_el_nahhal@hotmail.com
Received 7 May 2014; revised 22 June 2014; accepted 6 July 2014
Copyright © 2014 by authors and Scientific Research Publishing Inc.
This work is licensed under the Creative Commons Attribution International License (CC BY). http://creativecommons.org/licenses/by/4.0/
Abstract
This paper determined cations and anions concentrations, Total Kjeldahl Nitrogen (TKN), and heavy metals content in sewage sludge collected from the drying beds of wastewater treatment plant in Gaza. The aim was to test the possibility of using this sewage sludge as an alternative source of mineral fertilizers. Many instruments were used in this work: flame photometry (K, Na), EDTA titration (Ca, Mg), the turbidity method
(
2)
4
SO − , spectrophotometer (turbidity), ascorbic
acid method (orthophosphate), titrimetric method (Cl−), inductive coupled plasma analyzer (ICP,
heavy metals). All the processes of experiments and analyses were described clearly for reference. Results showed that concentrations of Na+, K+, Ca2+ and Mg2+ were 28.93, 2.53, 271 and 177 mg/kg respectively whereas 3
4 PO−, 2
4 SO−,
3
NO−, and Cl− were 0.434, 18.59, 0.87 and 0.026 g/kg respec- tively. The concentrations of Fe, Cu, Pb, Zn and Mn were 125.12, 172.56, 76.88, 218.73 and 157.56 mg/kg respectively. These results indicate that sewage sludge from Gaza contained high fractions of most plant nutrients accordingly, and it may be advantageous to use the sludge as a natural source of plant fertilizers.
Keywords
Sludge, Cations, Anions, TKN, Heavy Metals
1. Introduction
people [1].
Sludge (biosolids) may be defined either the matter which refers to the residual, semi-solid material left from industrial wastewater, sewage treatment plants or settled suspension obtained from conventional drinking water treatment and numerous other industrial processes [2]. Sludge may be dried and incorporated with some carbo-naceous materials to produce a suitable composted material for the use in the agriculture to increase the produc-tion and improve the soil properties. Chemical and biological composiproduc-tions of sewage sludge depend on the wastewater composition [3]. Usually, it is rich in Organic Mater (OM) and plant nutrients such as Nitrogen (N), Phosphorus (P) and Calcium (Ca) [4] and can improve soil physical, chemical and biological properties, such as porosity, aggregate stability, bulk density, soil fertility, water movement and retention [5]. There are four waste-water disposal and treatment facilities in Gaza Strip, Beit Lahia, Gaza City, Khan Younis, and Rafah waste-wa- ter treatment plants. These stations are not sophisticated treatment technology; they consist of anaerobic lagoons, aerated lagoons and maturation ponds. It is expected that large amounts of sludge are being produced from Gaza Strip wastewater treatment plants.
Furthermore, Casado-Vela et al. [6] monitored the effect of the application of three increasing amounts of composted sewage sludge (3, 6 and 9 kg·compost·m−2) on the physicochemical properties of a horticultural cal-careous soil where two types of plants were grown under two exploitation regimes (one in a greenhouse and the other in open-air). They found out that the 9 kg·compost·m−2 application promoted the appearance of deleterious effects on the properties of soil, such as salt accumulation, a significant increase in the electrical conductivity and an input of heavy metals (Pb > Cr > Cd). The 6 kg·compost·m−2 application provided a supply of nutrients necessary to grow peppers plants under both exploitation regimes.
In a recent study, Roig et al. [7] analyzed the systematic and periodical use, for 16 years, of anaerobically di-gested sewage sludge as an agricultural fertilizer by assessing the effects on some soil physical-chemical, func-tional, and ecotoxicological properties. They found that the input of sludge enhances soil properties proportion-ally to the application doses and/or frequency. In addition, the effects of organic matter, nitrogen, phosphorus and toxic elements in sewage sludge applied to agricultural land were reviewed by [8] and they found that the organic matter may improve the structure and water-holding capacity of poor soils and the nitrogen and phos-phorus in sludge have fertiliser value, and the crops can accumulate toxic elements from sludge-amended soils. In addition, Egiarte et al. [9] examined effect of repeated application of sewage sludge of short-term ground-water contamination and reported that a repeated application of sludge at 60 Mg∙ha−1 resulted in significantly higher concentrations of Zn, Cd, Cr and Ni in the leachates than with other treatments (other loading rates). Moreover, Wong et al. [10] investigated the effects of Dissolved Organic Matter (DOM) from anaerobically di-gested dewatered sludge on Cd and Zn sorption by three different soil types and found that the addition of DOM significantly reduced the Cd and Zn sorption capacity for tested soils, suggesting that DOM had a stronger inhi-bitory effect on Zn sorption than that of Cd. They also found that the reduction in metal sorption caused by DOM was very apparent in the pH range of 5 to 8, with a maximum inhibition on metal sorption occurring at pH 7 - 7.5 especially for Zn but the effect was minimal at lower pH.
Khan and Scullion [11] measured the effects of varying sludge metal (Cd, Cu, Ni, Pb and Zn) contents on res-piration, biomass C and N, and N mineralization in a series of laboratory incubations of soil-sludge mixes. They found that Cd (up to 70 mg∙kg−1 in soil) did not affect any microbial index. Higher concentrations of the other metals generally caused a decrease in biomass C and N, the reduction for C often being proportionally less than that for N and in most cases, higher metal concentrations increased respiration rates and microbial metabolic quotient. In addition to that soil mineral N was increased by higher inputs of all metals and the use of sludges with higher metal concentrations may lead to short-term changes in soil microbial communities and their activi-ties, with increased loss of C to the atmosphere and N availability.
Serna and Pomares [12] determined the N-mineralization rate of 12 sewage sludges in a given soil during a 16-week aerobic incubation by analysis of inorganic N produced by a nonleached procedure. They found that the aerobically treated sewage sludges gave higher mineralization rates than the anaerobically treated wastes and values of potentially mineralizable N (No) varied from 71 to 394 mg·N∙kg−1 soil, and mineralization rate con-stant (k) ranged from 0.089 to 0.883 week−1. In a different study, López-Valdez et al. [13] investigated how emissions of CO2, N2O and N2, and dynamics of mineral N were affected when different types of N fertilizer, i.e.
4 NH+, NO3
−
, or unsterilized or sterilized wastewater sludge, were added to the Texcoco soil. It was found that microorganisms added with the sludge accelerated organic material decomposition, increased NH4
+
immobili-zation, and induced immobilization of NO3
−
(in Texcoco soil). They suggested that wastewater sludge im-proves soil fertility at Otumba (an agricultural soil) and would favour the vegetation of the Texcoco soil (alka-line sa(alka-line).
Fytianos and Charantoni [14] investigated the leaching of heavy metals from municipal sewage sludge. They found that for most values of liquid solid ratio (L/S), the percentage of leached amounts for the examined metals followed the order Cd > Zn > Pb> Fe > Mn. As pH decreased, metal concentrations measured in the leachate in-creased. And in general, EDTA showed the greatest mobilization ability, followed by NaOH, acid solutions (HCl, H3PO4), and water.
Moreno et al. [15] investigated the effect of sewage sludge amendment of a semiarid soil, previously polluted with Cd, on the toxic effect of this heavy metal on soil microbial biomass and its activity. They found out that in general, higher ED (Ecological Dose) values were calculated for the sewage sludge amended soil than for un-amended soil and thus the Cd toxicity to microbial activity of the sewage sludge un-amended soil can be considered lower than that of the unamended soil. As obvious, very limited data on quantities of sludge are available how-ever, no chemical analysis was done to determine concentrations of cations anions and heavy metal of sewage sludge from Gaza Strip. Accordingly, this study was designed to determine the cations, anions and heavy metals of sewage sludge from Gaza Strip and to test the possibility of using it as an alternative source of mineral fertilizers.
2. Materials and Methods
2.1. Sludge Sampling
A representative sludge samples with a volume of 20 L each were collected from different locations from the drying beds in the Sheikh Ejleen Waste Water Treatment Plant.
The samples were air-dried in the month of June 2013 using solar radiation, crushed and mixed together to insure homogeneity of the sludge. The dried sludge samples were sieved through 2 mm sieve and mixed again and kept in plastic bags for further experimental work.
2.2. Determination of Cations
Ten g of sludge samples were suspended in 25 ml distilled water form a ratio of 1:2.5 w/w and shaken over night, the pH and EC and TDS were measured to each sample. Then additional 25 ml water were added to form a ratio 1:5 w/w. Nutrient content (K, Ca, Mg, and Na, expressed as g∙kg−1
dry weight basis) were determined by EDTA titration (Ca, Mg), flame photometry (K, Na) [16].
2.3. Determination of Anions
The sulfate (SO4) was determined using the turbidity method and in this procedure sulfate ion is converted to a barium sulfate suspension under controlled conditions. The resulting turbidity is determined by spectrophoto-meter at 420 nm and compared with a curve prepared from standard sulfate solution. While the orthophosphate was determined using ascorbic acid method. The chloride was determined using the titrimetric method by titrat-ing it with silver nitrate (AgNO3) in the presence of potassium chromate as indicator
2.4. Determination of Heavy Metals
Following the procedure described by [17], the heavy metal concentration in sludge samples will be described. In this procedure, 0.5 - 2 g air dried sludge were digested in 10 ml of nitric acid 78% and kept under heating with flux at 65˚C for 24 h. Then the system was heated up to 120˚C for another 24 h. After complete digestion (nearly clear solution appeared). The system was left for cooling at the room temperature. The digested sludge was filtered through Whattman scale 43, filter paper ashless. The collected filtrate was completed to the mark of volumetric flask capacity 25 ml with the same acid solution. Then the heavy metals were analyzed using Induc-tive Coupled Plasma analyzer (ICP).
2.5. Determination of Nitrogen Fractions 2.5.1. Nitrate Fraction
concentration under acidic media to the corresponding nitrosalicylic acid with yellow color according to the chemical reactions shown in Figure 1(a).
The intensity of the yellow color represents the nitrate concentration and it was determined using a spectro-photometer. After making a standard curve of nitrosalicylic acid, the same procedure was done to the filtrate from 10 g of sludge in 50 ml of water. Results were expressed in g∙kg−1
dry weight basis.
2.5.2. Ammonium Fraction
Ammonium was determined using Kjeldahl method without the digestion step. Ten ml of the filtrate of 10 g of sludge in 50 ml of water after shaking overnight were taken to the distillation step of Kjeldahl and then to the back titration step to determine the ammonium fraction using hydrochloric acid. Results were expressed in g/kg dry weight basis.
2.5.3. Determination of Total Organic Nitrogen Fraction
Organic nitrogen (org-N) was determined using Kjeldahl digestion according to the following procedure below: 0.5 g of sludge samples were digested with sulfuric acid for 4 hours with 72% H2SO4 followed by a second boiling hydrolysis under reflux for 5 hours in H2SO4 (0.7 N) until clear solutions were obtained. Then the sam-ples were transferred to the distillation unit at Kjeldahl apparatus to catch the produced ammonium in Boric acid. The ammonium borate was then titrated by HCl 0.1 N to calculate the N content in sludge samples. The reaction procedures are shown below. Details of chemical reactions are shown in Figure 1(b).
2.6. Statistical Analysis
The statistical analysis of data was performed with ANOVA test using Excel program. The samples were in three replicates; mean and standard deviation were calculated. Analysis of variance among treatments was per-formed using t-test, p-values below 0.05 indicate significant differences.
3. Results and Discussion
3.1. Determination of Sodium, Potassium, Calcium and Magnesium
Determination of Na and K were done using Flame photometer. The relationship between flame-photometer readings of Na+ and K+ concentrations are shown in Figure 2.
It is obvious that at low concentrations of Na or K ions, nearly linear relationship between the flame photo-meter read and the concentrations. However, fitting the data to a linear regression line showed bad fit (R2 = 0.55). Accordingly, converting the data in Figure 2 to a log scale provides good fit. The regression information is shown in Table 1. Where Y and X represent the log scales of flame photometer reading and concentrations respectively. Accordingly, the equations in Table 1 were used to determine the sodium and/or potassium con-centrations in sludge samples. The measured concon-centrations are shown in Table 2.
[image:4.595.113.516.540.707.2]
(a) (b)
Figure 2.Standard curve of (Na/K) determination in sludge sample.
Table 1. Regression equations for sodium and potassium.
Cation Regression Eq R2
Na Y = 2.024X + 1.95 0.95
K Y = 1.8093X + 2.73 0.95
Table 2. Sodium, potassium, calcium and magnesium concentrations in sludge samples.
Cations Concentration mg/kg
Na 28.93 ± 6.85
K 2.53 ± 0.43
Ca 271 ± 38.74
Mg 177 ± 67
Fe 125.12 ± 13.65
Calcium and magnesium concentrations in the sludge samples were determined using EDTA titration method using plank and sample readings. The results are shown in Table 2.
It can be seen that Sodium and potassium concentrations are 28.93 ± 6.85, 2.53 ± 0.43 mg/kg, respectively. The high concentration of sodium or potassium ion in sludge samples may be attributed to the fact that a lot of surfactants, cosmetics, and soups are containing sodium or potassium in their chemical structure. Moreover, cal-cium and magnesium concentrations are 271 ± 38.74 and 177 ± 67 mg/kg, respectively. Furthermore, Fe con-centration is 125.12 ± 13.65 mg/kg.
As obvious, K is the lowest concentration among all of the cations and Ca is the highest concentration among all cases.
The explanation of these results is that surfactants, soups, and cosmetics may be degraded during sludge for-mation resulting in transferring sodium or potassium into inorganic form (e.g. NaCl). Our explanation is sup-ported by the results of [19] who found that surfactant, cosmetic product formulations, contributes significantly to the pollution profile of sewage and wastewater with various compounds including cations. Further supports to our results come from [20] who reported high concentration of cations in treated sewage water and from the re-sults of [21] who correlated the high concentrations of cations in aerobic granular sludge with the low concen-tration of Cu++ in sludge.
3.2. Concentrations of Anions
[image:5.595.127.468.361.463.2]Figure 3. It can be seen that a linear regression equation provide the best fit (R2 = 0.9803). The high value of R2 suggests the best fit, accordingly the regression equation was used to determine the concentration of Cl− ions in the unknown samples. The determined Cl− concentrations in the unknown samples are shown in Table 3.
It is obvious that a linear relationship is shown in concentration at AgNO3 below 4 mg/l with an equation of Y = 0.2996X − 0.0106 with a value of R2
= 0.9803 indicating a strong positive association between the Cl (ml) and Na concentration mg/l. Accordingly, in the range of 0 - 4 mg/l, concentration of Cl may be determined. Howev-er, concentration above this range may need several dilutions. Nevertheless, within the range, a strong positive association was observed R2 = 0.9803. This relationship provides good fits that allow determination of Cl con-centration in the sludge sample. However, the determined Cl concon-centration is 25.84 ± 4.26 mg/kg (Table 3) which is in the acceptable levels of Cl standards [22].
3.2.1. Sulfate Concentration
The relationship between the optical density and sulfate concentration are linear below 60 mg/l as shown in Figure 4.
[image:6.595.183.412.488.703.2]It can be seen that the relationship is expressed as a linear regression with equation Y = 0.035X + 0.066 and R2 value equals to 0.9971. This indicates a strong positive association and enabled accurate determination of sulfate concentration in the sludge samples. According, the determined sulfate concentration in sludge equals to
Figure 3. Relationship of standard solutions of Cl concentra-tion and required amount of AgNO3.
Table 3. Chloride, sulfate and phosphate concentrations. Values represent average and standard deviation.
Anion Average
Cl− (mg/kg) 25.84 ± 4.26
2 4
SO− (g/kg) 18.59 ± 2.44
3 4
PO− (g/kg) 0.434 ± 0.023
18.59 ± 2.44 g/kg. This value looks nearly high but in fact sulfur containing protein is a high fraction in nature. However, the nearly high sulfate level is due to the high solubility in water which is not pH-dependent. Similar results were recently obtained by [23].
3.2.2. Phosphate Concentration
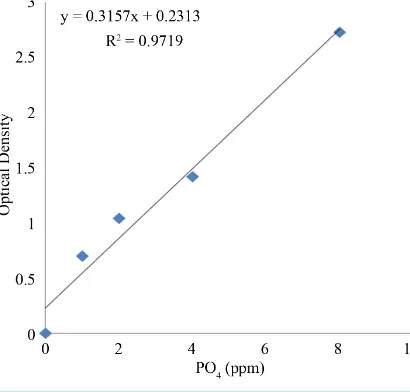
The relationship between gradient concentrations of phosphates and corresponding optical densities are shown in Figure 5.
It can be seen that a linear relation is observed at concentrations below 10 ppm and the relationship is ex-pressed by the equation Y = 0.3157X + 0.2313 with an R2 value equals to 0.9719. This indicates a strong posi-tive association which enabled determination of phosphate concentrations in the sludge samples. The data are shown in Table 3.
A comparison among anions concentrations is shown in Table 3, it can be seen that Cl− has the lowest con-centrations among all whereas 2
4
SO− is the highest among all.
The explanation of these results is that these values represent the soluble fraction of Cl−, 2 4
SO−, and PO4− in sludge samples. The low value of phosphate concentrations in sludge samples is due to the fact that, phosphate solubility is pH-dependent. Accordingly, at low pH value high phosphate levels may be found in sludge. How-ever, the current pH value of sludge equals to 6.78 ± 0.02 [24] accordingly, low fraction of phosphate was found. Another support to our argument comes from the fact that phosphoric acid is a weak acid and has 3 dissociation constants. This indicates that phosphate solubility is pH-dependent. It is obvious that the phosphate level is 0.434 ± 0.023 g/kg in the sludge. As obvious, nearly low values of 3
4
PO − are available in sludge samples. This value represent only the soluble fraction of phosphate not all phosphate. Under pH value 6.78, phosphate ion tends to precipitate from the solution. Similar observations were given recently by [25].
3.2.3. Nitrate, Ammonium and TKN Concentrations
The importance of nitrate levels in sludge samples emerged from the fact that sludge can be used as an alterna-tive source of nitrate instead of nitrogen, phosphorus and potassium fertilizer application in agriculture.
According to the methods described above, we generated a standard nitrate curve by converting the nitrate into the corresponding nitro-salicylic acid that has yellow color at alkali media and measured the optical density at 410 nm. Accordingly, the optical density of nitro-salicylic acid and its gradient concentrations are shown in Figure 6.
It is obvious that a linear relationship with a value of R2 = 0.9988 is obtained even at nearly high nitrate con-centration (500 mg/l). This suggests that a strong positive association exists between the optical density and tested concentrations. This linear mode of interaction enabled us to use the regression equation to determine ni-trate concentrations in the unknown samples of sludge. Accordingly, the linear relationship is expressed by the equation Y = 0.0008X. This equation was used to determine the nitrogen concentration in the sludge samples. The value of nitrate level in sludge equals to 871 ± 135 mg/kg sludge as shown in Table 4.
Figure 5. Standard curve of phosphate determination in sludge samples.
[image:8.595.130.467.508.566.2]Figure 6. Optical density nitrate concentration relationship. Standard curve.
Table 4. Nitrogen levels in sludge. Values represent average and standard deviation.
Sludge
TKN mg/kg 5000.04 ± 757.5
Total soluble N mg/l 61.63 ± 31.69
Nitrate mg/kg 871 ± 135
3.3. Concentration of Heavy Metals
Concentration of heavy metals in sludge samples are shown in Table 5. It can be seen that cupper concentration is 172.56 ± 61.53 mg/kg. Moreover, lead concentration is 75.86 ± 1.63 mg/kg. Furthermore, the zinc concentra-tion is 218.73 ± 8.35 mg/kg. The manganese concentraconcentra-tion is 157.96 ± 21.67 mg/kg. It is obvious that Zn con-centration is the highest one among all cases followed by cupper and manganese. Moreover, lead concon-centration is the lowest one among all.
The high levels of heavy metals can be explained by the fact that industrial wastewater network is connected with the domestic wastewater network. Both wastewaters come together to wastewater treatment plant. The mixing of industrial wastewater with domestic wastewater allows heavy metals to precipitate due to the changes of pH values from acidic range in the industrial wastewater to alkaline range in the domestic wastewater. The precipitated heavy metals react with organic acid that generated from the biodegradation of the organic wastes in the treatment plant and with inorganic acid.
This process makes an accumulation of heavy metals in sludge. Our explanation is supported by the results of [30] who investigated the distribution and variation trend of heavy metals in sludge samples collected from dif-ferent wastewater treatment plants in China and showed that contents of heavy metals in sludge varied signifi-cantly, and the average contents exhibited an order of Cr > Zn > Cu >Pb> As > Hg > Cd. However, the presence of heavy metal in sludge sample may move to the plant during the agricultural process [29]. Furthermore, the presence of heavy metals in sludge may become toxic to soil nitrifying or denitrifying bacteria that benefit the plant growth. This explanation is supported by the results of [31] who studied the effects of heavy metals in wastewater on anoxic/aerobic-membrane bioreactors performance and revealed that the nitrification/denitrifica- tion rates were dramatically decreased in different percentages based on the concentration of heavy metals in wastewater. Accordingly, it may be necessary and recommended to remove heavy metals from sludge samples before agricultural application. Our recommendation is supported by the work of [32] who investigated the long-term removal of heavy metals in a combined up-flow anaerobic sludge bed system treating municipal wastewater and revealed that high removal efficiencies were found for some metals in the following order: Sn > Cr > Cu > Pb > Zn > Fe (63% - 94%) and medium removal efficiencies for Ni (49%), Hg (42%), and Ag (40%), and finally Mn and As showed negative percentage removals. Further support come from the results of [33] who studied the retention of heavy metals at two pilot-scale treatment wetlands, consisting of two vertical flow beds followed by a horizontal flow bed and revealed that a major removal pathway was sedimentation and adsorption onto soil substrate as well as precipitation and co-precipitation. It has been shown by [34] that application of compost containing high fraction of heavy metals expose plant and ground water to contamination of heavy metals. In addition, El-Nahhal [20] found heavy metals in the drinking water collected from different sources and attributed this to possible contamination from industrial wastewater out house. In comparison with USEPA 1994 standards, the heavy metals concentrations in the sludge are found to be many times lower than USEPA 1994 standards. Accordingly, the sludge can be used in agriculture.
4. Conclusion
Sludge samples contain high fraction of Na, K, Ca, Mg, and Fe which are in respective manner 28.93 ± 6.85, 2.53 ± 0.43, 271 ± 38.74, 177 ± 67 and 125.12 ± 13.65 mg/kg. Moreover, 3
4 PO −, 2
4
[image:9.595.158.440.621.709.2]SO −, Cl− are respectively 25.84 ± 4.26 mg/kg, 18.59 ± 2.44 g/kg and 0.434 ± 0.023 g/kg. Sludge samples contained high fraction of
Table 5. Heavy metals levels in sludge. Values represent average and stan-dard deviation (mg/kg).
Heavy metals Average ± stdev (mg/kg) USEPA standards (mg/kg)
Cu 172.56 ± 61.53 4300
Pb 75.86 ± 1.63 840
Zn 218.73 ± 8.35 7500
Mn 157.96 ± 21.67 NA
TKN. Total soluble N and nitrate are in respective form: 5000.04 ± 757.5, 61.63 ± 31.69 and 871 ± 135 mg/kg. The concentrations of Cu, Pb, Zn, Mn are in the following order: 172.56 ± 61.53, 75.86 ± 1.63, 218.73 ± 8.35 and 157.96 ± 21.67 mg/kg, respectively. Application of sludge in agriculture soil may enhance plant growth due to high fraction of plant nutrients.
References
[1] Palestinian Central Bureau of Statistics (2014) Population in Palestine, Household Budget.
http://www.pcbs.gov.ps/site/881/default.aspx#Population
[2] Miller, M.C. (2011) Microbiological Safety of Organic Fertilizers Used for Production. MSC Thesis, Clemson Univer-sity, Clemson.
[3] Melo, W.J., Marques, M.O., Ferreira, M.E., Melo, G.M.P. and Melo, V.P. (2002) Chemical Properties and Enzyme Activity in a Sewage Sludge Treated Soil. Communications in Soil Science and Plant Analysis, 33, 1643-1650. http://dx.doi.org/10.1081/CSS-120004305
[4] Hue, N.V. (1988) Residual Effects of Sewage Sludge Application on Plant and Soil-Profile Chemical Composition.
Communications in Soil Science and Plant Analysis, 19, 1633-1643. http://dx.doi.org/10.1080/00103628809368040 [5] Silveira, M.L.A., Alleoni, L.R.F. and Guilhermje, L.R.G. (2003) Sewage Sludge and Heavy Metals in Soils. Scientia
Agricola, 60, 793-806. http://dx.doi.org/10.1590/S0103-90162003000400029
[6] Casado-Vela, J., Sellés, S., Díaz-Crespo, C., Navarro-Pedreño, J., Mataix-Beneyto, J. and Gómez, I. (2007) Effect of Composted Sewage Sludge Application to Soil on Sweet Pepper Crop (Capsicum annuum var. annuum) Grown under Two Exploitation Regimes. Waste Management, 27, 1509-1518. http://dx.doi.org/10.1016/j.wasman.2006.07.016 [7] Roig, N., Sierra, J., Martí, E., Nadal, M., Schuhmacher, M. and Domingo, J. (2012) Long-Term Amendment of
Span-ish Soils with Sewage Sludge: Effects on Soil Functioning. Agriculture, Ecosystems & Environment, 158, 41-48. http://dx.doi.org/10.1016/j.agee.2012.05.016
[8] Sterritt, R.M. and Lester, J.N. (1980) The Value of Sewage Sludge to Agriculture and Effects of the Agricultural Use of Sludges Contaminated with Toxic Elements: A Review. Science of the Total Environment, 17, 55-90.
http://dx.doi.org/10.1016/0048-9697(80)90102-3
[9] Egiarte, G., Pinto, M., Ruíz-Romera, E. and Camps Arbestain, M. (2008) Monitoring Heavy Metal Concentrations in Leachates from a Forest Soil Subjected to Repeated Applications of Sewage Sludge. Environmental Pollution, 156, 840-848. http://dx.doi.org/10.1016/j.envpol.2008.05.025
[10] Wong, J.W.C., Li, K.L., Zhou, L.X. and Selvam, A. (2007) The Sorption of Cd and Zn by Different Soils in the Pres-ence of Dissolved Organic Matter from Sludge. Geoderma, 137, 310-317.
http://dx.doi.org/10.1016/j.geoderma.2006.08.026
[11] Khan, M. and Scullion, J. (2002) Effects of Metal (Cd, Cu, Ni, Pb or Zn) Enrichment of Sewage-Sludge on Soil Mi-cro-Organisms and Their Activities. Applied Soil Ecology, 20, 145-155.
http://dx.doi.org/10.1016/S0929-1393(02)00018-5
[12] Serna, M.D. and Pomares, F. (1992) Nitrogen Mineralization of Sludge-Amended Soil. Bioresource Technology, 39, 285-290. http://dx.doi.org/10.1016/0960-8524(92)90218-M
[13] López-Valdez, F., Fernández-Luqueño, F., Luna-Guido, M., Marsch, R., Olalde-Portugal, V. and Dendooven, L. (2010) Microorganisms in Sewage Sludge Added to an Extreme Alkaline Saline Soil Affect Carbon and Nitrogen Dynamics.
Applied Soil Ecology, 45, 225-231. http://dx.doi.org/10.1016/j.apsoil.2010.04.009
[14] Fytianos, K. and Charantoni, E. (1998) Leaching of Heavy Metals from Municipal Sewage Sludge. Environment In-ternational, 24, 467-475. http://dx.doi.org/10.1016/S0160-4120(98)00026-9
[15] Moreno, J., Hernández, T., Pérez, A. and Garcı́a, C. (2002) Toxicity of Cadmium to Soil Microbial Activity: Effect of Sewage Sludge Addition to Soil on the Ecological Dose. Applied Soil Ecology, 21, 149-158.
http://dx.doi.org/10.1016/S0929-1393(02)00064-1
[16] Saña, J., Giró, F., Soliva, M. and Florensa, P. (1989) Methodology Used for Evaluating the Quality of Compost Pro-duced in Catalonia. Simposio Internazionale produzione et impiego del compost, Adige,20-23 June 1989, 343-362. [17] Bashour, I. and Sayegh, A. (2007) Methods of Analysis for Soils of Arid and Semi-Arid Regions. FAO, Rome.
[18] Cataldo, D.A., Maroon, M., Schrader, L.E. and Youngs, V.L. (1975) Rapid Colorimetric Determination of Nitrate in Plant Tissues by Nitration of Salicylic Acid. Communications in Soil Science and Plant Analysis, 6, 71-80.
http://dx.doi.org/10.1080/00103627509366547
[20] El-Nahhal, Y. (2006) Contamination of Goundwater with Heavy Metals in Gaza Strip. 10th International Water Tech- nology Conference, IWTC10 2006, Alexandria, 1139.
[21] Zheng, X.Y., Wang, X.N., Huang, X., Chen, Q., Chen, W. and He, Y.J. (2013) Effects of Cu2+ on Morphological Structure, Functional Groups, and Elemental Composition of Aerobic Granular Sludge. Environmental Technology, 34, 219-224. http://dx.doi.org/10.1080/09593330.2012.689368
[22] USEPA (US Environmental Protection Agency) (2010) Guidance for Federal Land Management in the Chesapeake Bay Watershed. USEPA, Washington DC, 841-R-10-002.
[23] Jing, Z., Hu, Y., Niu, Q., Liu, Y., Li, Y.Y. and Wang, X.C. (2013) UASB Performance and Electron Competition be-tween Methane-Producing Archaea and Sulfate-Reducing Bacteria in Treating Sulfate-Rich Wastewater Containing Ethanol and Acetate. Bioresource Technology, 137, 349-357. http://dx.doi.org/10.1016/j.biortech.2013.03.137
[24] El-Nahhal, I.Y., Al-Najar, H. and El-Nahhal, Y. (2014) Physicochemical Properties of Sewage Sludge from Gaza. In-ternational Journal of Geosciences, 5, 586-594. http://dx.doi.org/10.4236/ijg.2014.56053
[25] Luan, J., Li, R., Zhang, Z., Li, Y. and Zhao, Y. (2013) Influence of Chlorine, Sulfur and Phosphorus on the Volatiliza-tion Behavior of Heavy Metals during Sewage Sludge Thermal Treatment. Waste Management & Research, 31, 1012- 1018. http://dx.doi.org/10.1177/0734242X13493955
[26] Dvořák, L., Svojitka, J., Wanner, J. and Wintgens, T. (2013) Nitrification Performance in a Membrane Bioreactor Treating Industrial Wastewater. Water Research, 47, 4412-4421. http://dx.doi.org/10.1016/j.watres.2013.03.053 [27] Sreesai, S., Peapueng, P., Tippayamongkonkun, T. and Sthiannopkao, S. (2013) Assessment of a Potential Agricultural
Application of Bangkok-Digested Sewage Sludge and Finished Compost Products. Waste Management & Research, 31, 925-936. http://dx.doi.org/10.1177/0734242X13494261
[28] Sheng, Y. and Xing, L. (2013) Organics Removal and Protein Recovery from Wastewater Discharged during the Pro-duction of Chondroitin Sulfate. Water Science & Technology, 68, 1582-1590. http://dx.doi.org/10.2166/wst.2013.405 [29] El-Nahhal, Y., Tubail, K., Safi, M. and Safi, J. (2013) Effect of Treated Waste Water Irrigation on Plant Growth and
Soil Properties in Gaza Strip, Palestine. American Journal of Plant Sciences, 4, 1736-1743.
[30] Zhang, C., Chen, H., Yu, Y.X., Wang, L.J., Han, J.B. and Tao, P. (2013) Pollution Characteristics of Heavy Metals in Sludge from Wastewater Treatment Plants and Sludge Disposal in Chinese Coastal Areas. Huan Jing Ke Xue, 34, 1345-1350. (in Chinese)
[31] Feng, B., Fang, Z., Hou, J., Ma, X., Huang, Y. and Huang, L. (2013) Effects of Heavy Metal Wastewater on the Anox-ic/Aerobic-Membrane Bioreactor Bioprocess and Membrane Fouling. Bioresource Technology, 142, 32-38.
http://dx.doi.org/10.1016/j.biortech.2013.05.019
[32] De la Varga, D., Díaz, M.A., Ruiz, I. and Soto, M. (2013) Heavy Metal Removal in an UASB-CW System Treating Municipal Wastewater. Chemosphere, 93, 1317-1323. http://dx.doi.org/10.1016/j.chemosphere.2013.07.043
[33] Wojciechowska, E. and Gajewska, M. (2013) Partitioning of Heavy Metals in Sub-Surface Flow Treatment Wetlands Receiving High-Strength Wastewater. Water Science & Technology, 68, 486-493.
currently publishing more than 200 open access, online, peer-reviewed journals covering a wide range of academic disciplines. SCIRP serves the worldwide academic communities and contributes to the progress and application of science with its publication.