Munich Personal RePEc Archive
Long-term labour productivity and GDP
projections for the EU25 Member States
: a production function framework
Carone, Giuseppe and Denis, Cécile and Mc Morrow, Kieran
and Mourre, Gilles and Röger, Werner
August 2006
Online at
https://mpra.ub.uni-muenchen.de/744/
EUROPEAN
ECONOMY
EUROPEAN COMMISSION
DIRECTORATE-GENERAL FOR ECONOMIC AND FINANCIAL AFFAIRS
ECONOMIC
PAPERS
ISSN 1725-3187 http://europa.eu.int/comm/economy_finance
N° 253 June 2006
Long-term labour productivity and GDP projections for the EU25 Member States :
a production function framework
by
Giuseppe Carone, Cécile Denis, Kieran Mc Morrow, Gilles Mourre and Werner Röger
Economic Papers
are written by the Staff of the Directorate-General for Economic
and Financial Affairs, or by experts working in association with them. The “Papers”
are intended to increase awareness of the technical work being done by the staff and
to seek comments and suggestions for further analyses. Views expressed represent
exclusively the positions of the author and do not necessarily correspond to those of
the European Commission. Comments and enquiries should be addressed to the:
European Commission
Directorate-General for Economic and Financial Affairs
Publications
BU1 - -1/13
B - 1049 Brussels, Belgium
ECFIN/E3/GM/REP/53411
-
EN
ISBN
92-79-01194-4
KC-AI-06-253-EN-C
Long-term labour productivity and GDP projections for the
EU25 Member States : a production function framework
Giuseppe Carone, Cécile Denis, Kieran Mc Morrow, Gilles Mourre, Werner Röger
ABSTRACT
This paper presents the results of long run labour productivity and GDP growth rate projections (until 2050) for each of the 25 EU Member States and provides a detailed overview of the forecast methodology used. These projections were undertaken in order to provide an internationally comparable macroeconomic framework against which to assess the potential economic and fiscal effects of ageing populations. This assessment was carried out as part of the work undertaken by the EU’s Economic Policy Committee, in its Ageing Working Group, to project the public expenditure implications of ageing on pensions, health care, long-term care, unemployment insurance and education.
The projections presented in this paper, using a common production function methodology for all 25 countries, show the GDP growth rate effects of an assumptions-driven extrapolation of recent trends in employment and labour productivity. These base case projections reflect the working assumption of “no policy change” and should not therefore be seen as forecasts of long run sustainable rates of growth but more as an indication of likely developments if past trends were to persist in the future. In overall terms, the EU25 baseline projection suggests a significant slowdown in potential growth rates in the Union as a whole, with the EU25 growth rate projected to fall from around 2 ½ % at present to half that rate over the period 2041-2050. While the decline in the growth rate of living standards is less dramatic, it is nevertheless significant, with EU25 GDP per capita growth rates expected to decline from 2 ¼ % at present to 1 ½ % in the 2040’s.
Finally, various sensitivity tests are carried out to check the GDP per capita impact of some factors which have been excluded from the baseline scenario for reasons of simplicity or because of a lack of consensus in the academic literature. Some of the interesting conclusions that emerge from these sensitivity tests include :
• Firstly, the GDP per capita impact of changes in the participation rate assumption used in the projections is much greater than for assumed changes in the share of part-time employment (i.e. in average hours worked per worker).
• Secondly, the negative effect of a change in the age-structure of the population is fairly limited, although it is accepted that the labour productivity of an individual is likely to decline after the age of 55. A very strong fall in the productivity of older workers compared with that of prime-age workers would be required to significantly depress total labour productivity. Such an outcome, on the basis of current evidence, appears rather unlikely.
• Thirdly, changing the TFP growth rate targets (e.g. use of the 1990’s average instead of the long-term 1970-2004 average) could strongly affect the projections.
• Finally, an assumption of productivity convergence in levels substantially alters the projections for most EU10 countries but leaves the EU15 almost unchanged.
JEL classification: O47, D24, J11, J21, J26, H55
Keywords: productivity, GDP growth, production function, long-term projections, ageing populations,
pension reforms.
Acknowledgements. The authors wish to thank Declan Costello, Henry Bogaert (Chairman) and all
TABLE OF CONTENTS
1. INTRODUCTION ...6
2. STYLISED FACTS ABOUT LABOUR PRODUCTIVITY GROWTH AND ITS DRIVING FORCES...7
2.1. Historical trends in labour productivity...7
2.2. Driving forces behind productivity developments ...8
2.3. Issues to be considered when thinking about long-term productivity projections ...10
2.3.1. Economic convergence : theoretical and empirical Evidence ...10
2.3.2. What impact is ageing likely to have on long run labour productivity trends in general and on capital deepening and TFP developments specifically ? ...13
3. EVALUATION OF THE DIFFERENT APPROACHES FOR MAKING LONG-RUN PRODUCTIVITY PROJECTIONS...16
3.1. Purely mechanical projections...16
3.1.1. Extrapolation of past/recent trend growth ...16
3.1.2. Convergence to a benchmark...17
3.2. Economic approaches : considering the determinants of productivity...17
3.2.1. Judgmental approach: balance of upward and downward risks...17
3.2.2. Partial equilibrium analyses: estimating the effects of different factors on productivity. ...18
3.2.3. General equilibrium approach ...19
3.3. The merit of a “hybrid” approach: a “statistical” method embedded in a production function framework ...20
4. OVERVIEW OF THE METHODOLOGY ADOPTED FOR THE PRESENT PROJECTIONS...21
4.1. The production function (PF) framework...21
4.2. Short-to-medium term projections (2005-2009): underlying assumptions...24
4.2.1. Trend Total Factor Productivity (TFP)...25
4.2.2. Kalman filter generated NAIRU...25
4.2.3. Population of working age...25
4.2.4. Participation rates ...25
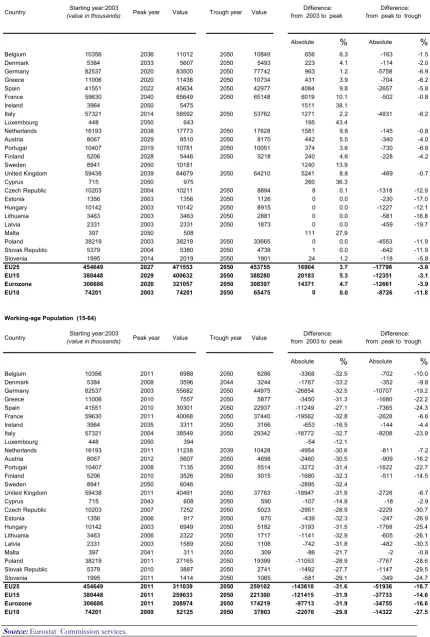
4.3. Long run projections (2010-2050) : underlying assumptions...28
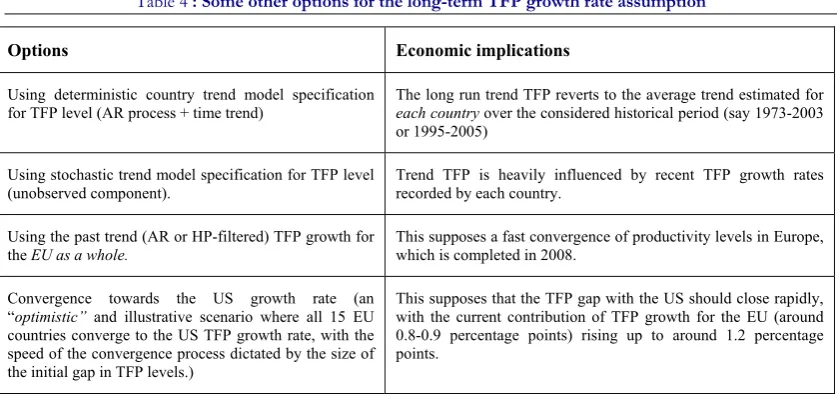
4.3.1. Total Factor Productivity ...28
4.3.2. Working age population ...31
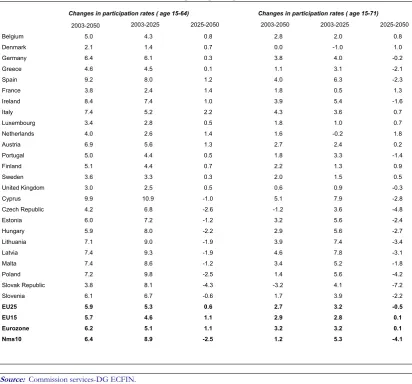
4.3.3. Participation rates ...34
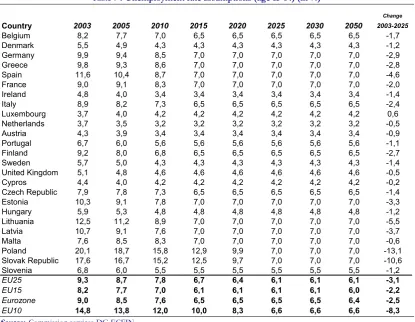
4.3.4. Moving from labour force to employment projections : assumptions on structural unemployment ...35
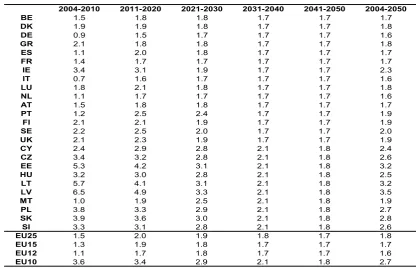
4.3.5. Capital formation : transition to the steady state ...36
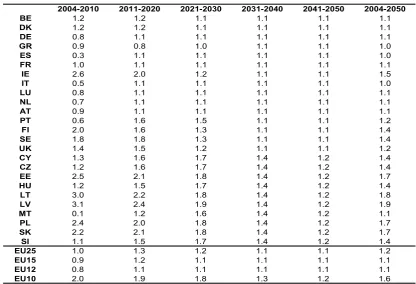
5. MAIN RESULTS OF BASELINE PROJECTIONS...37
5.1. Results for EU25, Euro Area, EU15 and EU10...37
5.2. Cross-country differences...43
6. SENSITIVITY TESTS ON PRODUCTIVITY AND GDP PER CAPITA ...44
6.1. Eight scenarios: rationale and construction ...45
6.1.1. Change in labour input assumptions...45
6.1.2. Impact of changing age-structure on productivity...46
6.1.3. Changes in TFP growth rate targets...47
6.1.4. Productivity convergence in levels rather than in growth rates...48
6.2. Main results of sensitivity tests...48
6.2.1. GDP per capita impact of assuming no change in participation rates is much greater than an assumed rise in the share of part-time employment ...51
6.2.2. The negative effect of a change in the population age-structure is fairly limited...51
6.2.3. Changing the TFP growth rate assumption could strongly affect the projections...53
6.2.4. An assumption of productivity convergence in levels substantially alters the projections for most EU10 countries whilst leaving the EU15 almost unchanged. ...54
7. CONCLUDING REMARKS ...55
REFERENCES ...58
LIST OF TABLES...62
ANNEX 1: COUNTRY-SPECIFIC RESULTS ...63
1. INTRODUCTION
In 2004, the ECOFIN Council gave the Economic Policy Committee (EPC) a mandate to produce a new set of long-run budgetary projections by mid-2005 for all twenty five Member States covering pensions, health care, long-term care, education, unemployment transfers and, if possible, contributions to pensions/social security systems. To this end, it was agreed that the budgetary projections should be made on the basis of common demographic projections, to be provided by Eurostat, and using macroeconomic assumptions to be validated in the EPC ‘s Working Group on Ageing
(EPC-AWG) 1. It was also accepted that the projections would be made on the basis
of a “no policy change” assumption, i.e. reflecting enacted legislation, including provisions which were expected to enter into force in a phased manner over time. The guiding principles of simplicity, comparability, consistency, prudence and transparency have underpinned the work of DG ECFIN and the EPC-AWG in preparing the new common budgetary projections.
This study presents the production function methodology, which was chosen by the EPC-AWG as the preferred approach for projecting labour productivity and GDP until 2050. In terms of structure, the study starts with some stylised facts about labour productivity growth, its main driving forces and the issues to be considered when making projections over such a long time horizon. It goes on to present the essential details of the various approaches which could be employed to make such projections, as well as providing a detailed overview of the specific methodology used in the present paper. Regarding the latter, the paper describes both the production function framework and the set of assumptions used to project its components over the medium to long run. On the basis of this agreed framework, the paper goes on to present the baseline projections which it produces for the EU25, EU15 and EU10 (new Member States) aggregates, whilst drawing some conclusions regarding the cross country differences as well as discussing a series of alternative scenarios. The essential conclusions to be drawn from the analysis are provided in the final section, with the detailed projections for each of the 25 Member States given in Annex 1.
1
2. STYLISED FACTS ABOUT LABOUR PRODUCTIVITY GROWTH AND ITS DRIVING FORCES
2.1. Historical trends in labour productivity
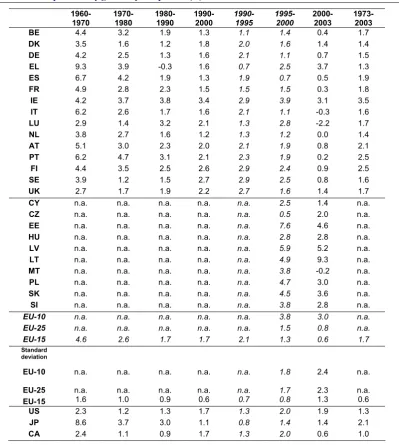
[image:8.595.100.500.221.667.2]The simplest observable measure of labour productivity is GDP per person employed. This measure is particularly relevant in the context of the budgetary projections since, together with the projections of the labour force and the NAIRU, it permits the calculation of the total output growth rate over the projection horizon.
Table 1 : Labour productivity growth by sub-periods (%)
1960-1970
1970-1980
1980-1990
1990-2000
1990-1995
1995-2000
2000-2003
1973-2003
BE 4.4 3.2 1.9 1.3 1.1 1.4 0.4 1.7
DK 3.5 1.6 1.2 1.8 2.0 1.6 1.4 1.4
DE 4.2 2.5 1.3 1.6 2.1 1.1 0.7 1.5
EL 9.3 3.9 -0.3 1.6 0.7 2.5 3.7 1.3
ES 6.7 4.2 1.9 1.3 1.9 0.7 0.5 1.9
FR 4.9 2.8 2.3 1.5 1.5 1.5 0.3 1.8
IE 4.2 3.7 3.8 3.4 2.9 3.9 3.1 3.5
IT 6.2 2.6 1.7 1.6 2.1 1.1 -0.3 1.6
LU 2.9 1.4 3.2 2.1 1.3 2.8 -2.2 1.7
NL 3.8 2.7 1.6 1.2 1.3 1.2 0.0 1.4
AT 5.1 3.0 2.3 2.0 2.1 1.9 0.8 2.1
PT 6.2 4.7 3.1 2.1 2.3 1.9 0.2 2.5
FI 4.4 3.5 2.5 2.6 2.9 2.4 0.9 2.5
SE 3.9 1.2 1.5 2.7 2.9 2.5 0.8 1.6
UK 2.7 1.7 1.9 2.2 2.7 1.6 1.4 1.7
CY n.a. n.a. n.a. n.a. n.a. 2.5 1.4 n.a.
CZ n.a. n.a. n.a. n.a. n.a. 0.5 2.0 n.a.
EE n.a. n.a. n.a. n.a. n.a. 7.6 4.6 n.a.
HU n.a. n.a. n.a. n.a. n.a. 2.8 2.8 n.a.
LV n.a. n.a. n.a. n.a. n.a. 5.9 5.2 n.a.
LT n.a. n.a. n.a. n.a. n.a. 4.9 9.3 n.a.
MT n.a. n.a. n.a. n.a. n.a. 3.8 -0.2 n.a.
PL n.a. n.a. n.a. n.a. n.a. 4.7 3.0 n.a.
SK n.a. n.a. n.a. n.a. n.a. 4.5 3.6 n.a.
SI n.a. n.a. n.a. n.a. n.a. 3.8 2.8 n.a.
EU-10 n.a. n.a. n.a. n.a. n.a. 3.8 3.0 n.a.
EU-25 n.a. n.a. n.a. n.a. n.a. 1.5 0.8 n.a.
EU-15 4.6 2.6 1.7 1.7 2.1 1.3 0.6 1.7
Standard deviation
EU-10 n.a. n.a. n.a. n.a. n.a. 1.8 2.4 n.a.
EU-25 n.a. n.a. n.a. n.a. n.a. 1.7 2.3 n.a.
EU-15 1.6 1.0 0.9 0.6 0.7 0.8 1.3 0.6
US 2.3 1.2 1.3 1.7 1.3 2.0 1.9 1.3
JP 8.6 3.7 3.0 1.1 0.8 1.4 1.4 2.1
CA 2.4 1.1 0.9 1.7 1.3 2.0 0.6 1.0
Sources: AMECO database, European Commission.
This convergence process appears to have continued in the 1980s and the first half of the 1990s, albeit to a much lesser extent. Conversely, the convergence process between the EU15 and the US has clearly reversed in the second half of the 1990s and
the early 2000s2. This is particularly true for some of the larger EU15 countries,
although a number of the smaller EU15 Member States (Greece, Ireland, Luxembourg, Finland and Sweden) have recorded a higher productivity growth rate compared with that of the US over the second half of the 1990s, enabling them to narrow the gap in terms of productivity levels. This development partly corresponds to the convergence of labour productivity growth rates within the EU15, with the standard deviation passing from 1.0% in the 1970s to 0.6% in the 1990s. However, this measure of dispersion seems to have risen in the late 1990s and the early 2000s. Looking at the new member States (EU10), their growth rates of labour productivity appear to be much higher (3.8% on average) than those of the existing Member States (1.3%) during the 1990s, which reflects the catching-up (or convergence) process in these economies.
2.2. Driving forces behind productivity developments
The main factors driving trend productivity growth derived from the standard Cobb-Douglas production function relate to labour input, capital input and technological progress, i.e. the residual which cannot be explained by the quantity and quality of either labour or capital. Several factors are worth considering in more detail.
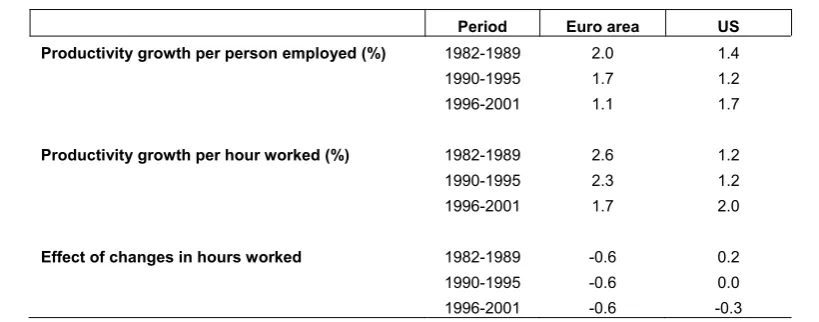
Changes in hours worked : The sharp decline in hours worked per worker in the
[image:9.595.92.502.506.667.2]1990s may explain why hourly labour productivity was higher than productivity per person employed in most of the continental European countries. Figures available for the euro area indicate that the growth in labour productivity per person employed is 0.6% points lower than labour productivity per hour worked in the three time periods considered in Table 2, which underscores the effect of the decline in average hours worked per person employed.
Table 2 : The effect of changes in hours worked on labour productivity growth (average annual changes)
Period Euro area US
Productivity growth per person employed (%) 1982-1989 2.0 1.4
1990-1995 1.7 1.2
1996-2001 1.1 1.7
Productivity growth per hour worked (%) 1982-1989 2.6 1.2
1990-1995 2.3 1.2
1996-2001 1.7 2.0
Effect of changes in hours worked 1982-1989 -0.6 0.2
1990-1995 -0.6 0.0
1996-2001 -0.6 -0.3
Source: ECB; August 2002 ECB Monthly Bulletin
2
Improvements in the average “human capital” of persons employed. As shown by
the OECD3, human capital can be proxied by the proportion of workers ranked by
educational attainment and weighted by their relative wages. However, the rise in the overall skill level of those in employment conceals two different effects:
- better education of the working-age population: the proportion of those attaining tertiary education has increased in most countries since the 1970s and in particular over the 1990s;
- the exclusion of the low skilled from employment: in addition to the increased skills of the working-age population, the high labour productivity growth recorded in the 1980s and at the start of the 1990s was partly attributable in a number of EU countries to the massive unemployment of low-skilled workers. Conversely, the widening of the employment base (increasing employment among the low skilled) in the 1990s explained in part the slower productivity growth in some countries, such as Spain, compared to the previous decades. Thus, high productivity growth can mirror underemployment and slack in the labour market.
Capital deepening: apart from labour inputs (quality and quantity), the second main channel which can account for labour productivity gains is the accumulation of physical capital. For instance, the high level of investment in the new Member States (public infrastructure, private investment) following the restructuring and privatisation of state owned-companies as well as the stimulus provided by large FDI inflows has contributed to the relatively high productivity growth rates in these countries. This fast capital deepening corresponds to the transition phase of these economies, which is somewhat similar to the reconstruction period in Western Europe after the Second World War, characterised by a fast physical capital accumulation. As regards recent trends in productivity growth, and in particular the divergence in growth rates between the EU and the US since the mid-1990s, the following issues related to capital accumulation appear to have played an important role :
- the role of information and communication technology (ICT) in the process of accumulation of physical capital should be emphasised, as it could explain a part of the productivity gap between the US and the EU. Two effects can be identified: capital accumulation in ICT-producing sectors (of which the size increased fastest in the US, Ireland, Finland and Sweden in the 1990s) and capital accumulation across the whole economy through large investments in ICT. These two mechanisms are (at least partly) responsible for the marked divergence between the US and the EU over the second half of the 1990s.
- lack of non-ICT productive investment: the lack of such investment, especially relative to the US in the second half of the 1990’s, may have also led to the EU’s disappointing productivity performance. Indeed, the investment rate in the EU displayed a clear and worrying downward trend in the 1990s.
- capital-labour substitution towards more employment intensive growth: the smaller non-ICT capital accumulation in the EU appears to be also due to a
3
reversal of the employment-unfriendly capital/labour substitution of earlier periods. This move towards more employment may entail a temporary reduction in measured productivity growth, but this should not be regarded as a trade-off, since a higher employment rate implies an unambiguous increase in GDP per capita with no negative implications for long-run productivity growth in the existing workforce. In neoclassical economic growth theory,
this long-run neutrality proposition is embodied in the concept of
labour-augmenting technical progress4.
Technological progress, embodied by Total Factor Productivity (TFP) growth. TFP
is conventionally calculated as the Solow's residual, which corresponds to the component of productivity growth which cannot be explained by changes in the quality and quantity of labour and capital. Three stylised facts can be mentioned. First, the slowdown of TFP growth in most OECD economies since 1973 to half the levels observed in the 1950-1973 period is still largely unexplained. Second, higher TFP growth in Europe vis-à-vis the US in the period 1973-1995 probably reflects convergence towards the leading economy. Third, TFP growth in the US has been strong compared to the EU since the mid-1990s. Strong ICT investment is only part of the story since US productivity growth persisted during the most recent downturn when ICT investment and demand fell dramatically. The combination of ICT investment and organisational changes (new processes, corporate culture, better knowledge and information dissemination, etc) could explain the good TFP performance in the US. There are however still many open questions regarding long-term trends and prospects for TFP. Will the “new economy” be sustainable in the US in the long-run and will the EU catch up towards the US in the coming decades?
Other factors (e.g. changes in the sectoral composition of the economy). The shift
of OECD economies towards larger service sectors mechanically induces a decline in the overall labour productivity growth rate, as on average services display lower productivity gains compared with the manufacturing sector (mainly due to lower capital-intensity). However, the growing share of ICT-producing sectors (both in manufacturing and services) may better explain the productivity results in some OECD countries.
2.3.
Issues to be considered when thinking about long-term productivity projections
2.3.1. Economic convergence : theoretical and empirical Evidence
Various theories abound concerning the speed with which less developed economies develop over time, and whether if, or when, they converge to the income levels of the most advanced economies. Some economists, such as Romer (1986) and other advocates of the new endogenous growth theories, are quite pessimistic regarding the
4
likelihood of convergence occurring even over long periods of time since productive technology is, in their view, of the increasing, as opposed to the more normally assumed decreasing, returns to scale variety and consequently once a country becomes a global technology leader it tends to remain so over extended periods of time due to knowledge spillovers or learning-by-doing effects. At the other end of the scale are economists such as J. Sachs and A. Warner (1995), who are quite optimistic concerning the potential for catching-up, with in their view an adequate policy framework being a sufficient condition for that to occur.
For Sachs et al.(1995) those countries which consistently implement efficient economic policies, including adherence to an open trading regime which is attractive to FDI flows and technology transfers, as well as establishing the normal institutions of a market economy, such as a properly functioning legal system with adequate protection for private property rights, will over time experience convergence. This view consequently stresses the importance of efficient economic institutions in ensuring growth and convergence. On this view of the world, if countries do not succeed in growing it has probably more to do with poor policy choices rather than technology deficiencies or low initial endowments of human capital.
Between these two extreme views is the one which is the most followed in empirical analysis and the one used in the EPC-AWG approach to make long-run projections, namely the Solow neoclassical growth framework, which predicts what is referred to as "conditional" convergence. The theory suggests that convergence does occur but not necessarily to the same higher level of income, since the growth potential of countries differs essentially because of differences in respective savings rates and population changes. When one allows for these differences in terms of the long run growth potential of countries, then one finds that poorer countries do in fact grow relatively faster and consequently do converge over time, but not necessarily to the same steady state standard of living. Furthermore, studies have found that the greater the gap between the present income levels of countries and their future potential, the faster they will grow. According to this line of reasoning, which has been termed "the "convergence clubs" hypothesis, in the long-run the per capita incomes of countries that are similar in their structural characteristic converge only if their initial conditions (their initial per capita output levels) are similar as well. Countries with different structural characteristic converge to different steady state. The theoretical support is provided by the endogenous models and in particular by models of poverty trap5.
Given the wide choice of models to choose from, it is clear that the empirical evidence becomes a major deciding factor in terms of which model to use for any long run growth analysis. In overall terms, it would appear that the approach which has enjoyed the greatest degree of support in the literature is the neoclassical view. There is in fact now widespread empirical acceptance that "conditional" convergence does occur across countries. Typical of this line of research is a 1992 study by Mankiw, Romer and Weil which showed, using cross-country regression analysis, that the neoclassical growth model could explain nearly 80% of the differences in
5
international standards of living, using just three explanatory variables, namely population growth rates, savings rates and an indicator of human capital.
In addition, papers by Barro and Sala-i-Martin (1991), Islam (1995) and Sala-i-Martin (1996), amongst many others, all found evidence for ‘conditional convergence’ for ‘developed economies’ including the EU, with rates of convergence of 2% per annum being typical for these studies. With regard to the debate on openness and growth, a number of studies, such as Sachs and Warner (1995) and Ben-David (1996), using a modified neoclassical framework, found strong evidence of per-capita income convergence for open economies with strong trading links, a scenario which is typical of the EU, Japan and a number of the fast ageing economies.
In this regard, while the analysis undertaken in the present paper is predicated on the conditional convergence thesis, the importance of an appropriate policy framework is also stressed, including the role of policy institutions, along the lines of the arguments put forward by Sachs and Warner. In overall terms, the key points to be retained from the convergence literature are the following.
• Convergence is not assured – it is conditional on rates of capital accumulation
and population growth and, at a wider level, on appropriate and efficient policy making institutions. As the experiences of Japan and the EU show, effective economic policies and institutions have an important role to play in the growth and convergence processes of these countries.
• The speed with which countries grow is dictated by their own long-run growth
potential and their own initial conditions. While fast rates of growth can be achieved, countries should be realistic about the speed with which convergence will take place – in fact that process normally occurs at a much slower pace than most countries assume.
• On the basis of the empirical evidence presented above, it would appear that the
road to prosperity is more difficult and the role of savings and investment, both in physical and human forms of capital, is more important in determining steady state income levels than originally thought back in the 1950s, with the accumulation of all forms of capital, including knowledge, being crucial to the relative growth performance of countries.
As an operational consequence for the projections, we will refrain from assuming the
existence of convergence in levels. As a much weaker form of convergence, we
however make country–specific TFP converge in growth rate, allowing for some
degree of technology diffusion. By contrast, labour input developments will remain
2.3.2. What impact is ageing likely to have on long run labour productivity trends in general and on capital deepening and TFP developments specifically ?
Direct compositional impact on overall labour productivity levels: Population ageing is often said to lead to a deterioration in the average quality of labour input and thereby to lower aggregate productivity: as the productivity of individuals is alleged to decline with age, the rising share of older workers should reduce overall productivity, even though age specific productivity remains constant. However, the profile of productivity by age is a complex issue since the identification of the age effect is blurred by cohort and selection effects6.
On the basis of a survey of human resource executives, Barth et al. (1993) finds that older workers were seen as being more reliable, having better skills and adopting better work-friendly behaviour than their younger counterparts. Using an employer-employee dataset for the US, Hellerstein et al. (1999) shows that prime-age workers (aged 35-54) are equally as productive as younger workers. However, those aged 55 and over are less productive than younger workers. Surveying supervisors’ ratings, work-sample tests, analyses of employer-employee datasets and other approaches assessing individual productivity across age groups, Skirbekk (2003) finds evidence suggesting “that productivity tends to follow an inverted U-shaped profile, where significant decreases take place from around 50 years of age. An important cause of these age-related productivity declines is likely to be reductions in cognitive abilities across the life span. Some abilities, such as perceptual speed, show relatively large decreases from a young age, while others, like verbal abilities, show only small changes throughout the working life. Although older individuals have longer experience, they learn at a slower pace and have reductions in their memory and reasoning abilities”. Prskawetz et al. (2005) also argue that the analysis should not only consider the age variation in individual skills (supply for abilities), but also the changing importance of these skills in the labour market (shifting demand for abilities). For instance, cognitive abilities seem to have gained much prominence in firms' needs compared with physical strength, especially in services-based economy.
This bell-shaped relationship between age and individual productivity is broadly confirmed by Kotlikoff and Wise (1989) and Hansen (1993) for the US and Meghir and Whitehouse (1996) for the UK, which find that younger workers with little experience and older workers are both less productive than prime-age staff. However, Borsch-Supan (2003) shows that, even when assuming a pronounced bell shaped relationship, the projected fall in aggregate labour productivity remains fairly small. Borsch-Supan (2006) also argues that there is no evidence of dramatic productivity decline in the 45-60 age bracket, as the negative effect of age is offset by the positive effect of experience, which becomes more important in a service and knowledge society7.
6
An additional problem arises from the fact that the age-profile of productivity is deduced from that of hourly earnings, although some gaps between wages and productivity might occur especially for the older age cohorts (Hellerstein et al. 1999).
7
Effects on total factor productivity : One of the critical assumptions to be made in relation to assessing the long-term economic impact of demographic change is the extent to which increased labour efficiency can offset the reduction in the rate of growth of the labour supply. This is a highly complex issue and one which has received a lot of attention in the empirical literature. From a review of the latter it would appear difficult to establish with any certainty whether demographic change will be positive or negative for productivity. According to one strand of research it could be detrimental to productivity growth if an ageing labour force turns out to be less dynamic and innovative (e.g. Barrel 2005) whereas other researchers take the alternative view that technological change may be boosted to offset the negative implications of the ensuing relative scarcity of labour.
Simon (1986), Wattenberg (1987), Romer (1990) and Jones (2002)8 take the former
view and argue that technical progress is slowed down by the anticipated ageing of the population because of the above mentioned loss of dynamism and since declining markets for capital goods ensures that innovation is less profitable. Barth et al. (1993) also shows that, notwithstanding their greater dedication at work, as well as their longer experience and better skills, older workers are considered by a panel of employers to be less flexible in accepting new assignments and less receptive to training, which may hamper innovation and the full exploitation of technical progress. Skirbekk (2003) and Prskawetz et al.(2005) note that older workers are likely to show less adaptability to changing working methods and less ability to learn in general. Denis, Mc Morrow and Röger (2004b) show that TFP growth could slow down substantially given the lesser human capital accumulation (embedded in a skrinking young population) and a lower labour amount devoted to R&D activities.
Disney (1996) takes the opposite view that ageing will have no adverse effects on productivity growth. In addition, in earlier research by Cutler et al (1990), empirical evidence was presented to support the contention that labour scarcity induces increased innovation i.e. the “scarcity is the mother of invention” argument. This scarcity view assumes that in a situation of relatively slow population growth, there is an acceleration, on a per capita basis, in human capital accumulation. In their cross-national analysis of 29 non-OPEC countries for the period 1960-1985, Cutler et al estimate that a decline in the annual labour force growth rate of 1 percentage point is associated with about a 0.5 percentage point increase in productivity growth. Furthermore, this view of Cutler et al. is supported in the context of ongoing research in relation to endogenous growth rate theories. For example, Fougère and Mérette (1997) suggest that investment priorities may change with population ageing, with the latter phenomenon increasing the incentive for human capital investment, resulting in a redistribution of investment away from physical towards human capital, with potentially favourable long-run effects in terms of the rate of economic growth. The empirical interest in this whole area of endogenous growth theory has been enormous in recent years, with the latter stressing that the total factor productivity (TFP) element of economic growth partially emanates from sources which are amenable to policy influence. If it is accepted that the behaviour of economic agents is susceptible to productivity enhancing policy interventions, then this would represent a major
8
departure from the standard neo-classical view which postulates that technical progress is exogenously determined.
Capital accumulation:One can assess whether the option is available of reducing the
impact of ageing on potential growth and living standards via capital accumulation alone ? On the negative side, from a capital widening perspective, with the expected slowdown in GDP growth rates, due to falls in labour force growth, investment should be negatively affected. This was the historical pattern, with the productivity-induced slowdown in GDP growth over the last number of decades resulting in less investment opportunities in relative terms. On the other hand, savings and investment have a potentially important role to play in helping to offset the effects of rising dependency burdens, via capital deepening9, with policies aimed at generating greater levels of savings leading to lower real interest rates, additional productive investment and stronger long-run growth. The negative impact on living standards due to the reduced rate of growth of the labour supply could in this way be potentially offset by higher rates of labour productivity growth emanating from a rising capital stock. However, this investment route to boosting output appears somewhat unrealistic, since not only is the national savings rate not expected to rise to finance the required higher investment rate, the most likely outcome, especially if one subscribes to the life cycle hypothesis, is for a fall in national savings, with the latter fall again largely
demographically induced10. Moreover, capital accumulation may have feed-backs on
Total Factor Productivity: If “vintage” effects are allowed for, the role of investment in the overall growth process over the next 50 years is greatly enhanced, with investment not only adding to the technical capacity of the economy via increases in the capital stock but also impacting on productivity via embodiment effects, with new “vintages” of capital adding to overall efficiency levels.
Consequently, prudence demands action to boost national savings rates over the medium to long run, with action in terms of government savings / dissaving allied to incentives to boost private sector retirement savings, being the most effective avenues to be explored. Since savings and investment coupled with technical progress are the key ingredients that influence long-term living standards, it is important to stress not only their individual contributions but also the possible links between investment and productivity developments.
9
The future evolution of the capital to labour ratio depends crucially on real interest rates. Two offsetting factors are at work in terms of ageing – declining labour forces require less investment but the savings rate of an ageing population is going down. Which effect dominates is controversial. The majority of models predict a slight decline in real interest rates. However, work by Kotlikoff et al (2001) suggests the opposite conclusion of an increase in interest rates.
10
To conclude this section, therefore, the empirical evidence linking ageing directly to productivity trends is far from convincing, with even doubts regarding whether the association or direction of any effect is positive or negative. In these circumstances it seems prudent to take a rather “middle of the road” view with regard to future efficiency gains in terms of the projections work to be described in sections 4 and 5.
3. EVALUATION OF THE DIFFERENT APPROACHES FOR MAKING LONG-RUN
PRODUCTIVITY PROJECTIONS
3.1. Purely mechanical projections
This section intends to provide a brief survey of the current state of practice. It describes the two main approaches that can be used for projecting labour productivity growth, that is a “purely mechanical” approach and an economic approach. Within the first approach there are two main methodologies which are the extrapolation of past/recent trend growth and convergence to a benchmark.
3.1.1. Extrapolation of past/recent trend growth
An approach consisting of extrapolating past trend growth has the merit of being simple and reasonable if the growth rate of productivity is computed over a long and fairly homogeneous time period, e.g. the period starting from the first oil shocks of 1973, rather than the very recent past which has been very heavily affected by the business cycle. Past experience has also shown that annual productivity growth varies quite a lot from one decade to another and that extrapolating the trend labour productivity in the first half of the 1990s to the second half of the 1990s would have led to large forecasting errors (around -0.8 p.p. per year for the whole EU), which cannot be explained fully by changing cyclical conditions.
This simple approach has been used by several public and private bodies involved in pension projections. One of these, for example, is the Board of Trustees in the U.S., which reports each year on the current and projected financial condition of the Social Security program, which is financed through the Old-Age and Survivors Insurance
Trust Funds. This was also the de facto approach followed by the AWG in the
previous exercise. In the 2001 projection exercise11, labour productivity growth
(measured by GDP per worker) for each country converges towards an annual rate of 1¾ per cent between 2020 and 2030. Some catch-up is allowed for initially low-productivity countries such as Portugal, although in this case the assumptions for productivity growth were very high. Although this was not explicitly mentioned, this rate is very close to that recorded between 1973-2003 for the EU as a whole (around 1.7%) and corresponds to the median of the bracket 1.4%-1.9% in which most annual productivity growth averages of highly developed EU countries are contained (Belgium, Denmark, Germany, Spain, France, Italy, Luxembourg, the Netherlands, Sweden and the United Kingdom). Small countries such as Portugal, Finland and Ireland displayed much higher rates, which may reflect the "new economy" phenomenon and/or convergence processes. In the sensitivity analysis, labour productivity growth was assumed to be 0.5% lower/higher than in the baseline
11
scenario, which roughly corresponds to the standard deviation of productivity growth across EU countries in the 1990s (+0.6%).
3.1.2. Convergence to a benchmark
This alternative approach could be particularly useful with a view to projecting productivity growth in the catching-up countries, for example in some of the acceding countries which are going through a process of real economic convergence. This approach allows one to take into account the fact that some countries may be far from the steady state and that trend (medium-term) productivity may strongly differ from long-term productivity. Moreover, it tackles a shortcoming of slavishly extrapolating past trends, as the latter may lead to some incoherence, such as assuming growing divergence in absolute levels of productivity between OECD countries. In an increasingly integrated global economy, with free movement of capital and transfers of technology, sustained divergences in levels of productivity seem unlikely.
In this setting, the choice of the benchmark (US, EU as a whole, EU excluding some catching-up countries, etc.) and the horizon of convergence are crucial. However, this method can appear too mechanical, as specific factors may hinder the convergence in some countries. Moreover, the process of convergence may be even unexpectedly reversed (for example, Japan vis-à-vis the US in the second half of the 1990s).
3.2.
Economic approaches : considering the determinants of productivity
By taking stock of the upward and downward risks, an economic approach is often used to allow the productivity forecast to deviate from the trend labour productivity or trend TFP seen over past periods.
3.2.1. Judgmental approach: balance of upward and downward risks
A judgemental approach would involve the introduction of deviations from past trend productivity growth based on an assessment of the upside/downside risks for the productivity growth facing each country. Table 3 lists the main downward and upward risks associated with productivity developments that could be taken on board in such an assessment. Although this approach is interesting, it remains highly speculative given the high level of uncertainty and the problem of quantification. It cannot justify per se a strong deviation from the past trend.
Based on the factors outlined in Table 3, it is very hard to draw clear cut conclusions on the prospects facing most EU countries in the coming decades as there are risks on both sides. A major uncertainty over the long-run emanates from the effect of ageing
populations per se on productivity growth. The theoretical and empirical literature
does not reach firm conclusions about the magnitude of the effect, although on balance the overall impact might be rather negative (see Annex 2). Several effects on TFP are at play. It has been argued that the marginal productivity of workers tends to start to decline when they reach their early fifties12.
12
Table 3 . Balance of risks for productivity growth in the EU
Nature of the risks Component of productivity affected Horizon of the
effect
Downward risks
Further increases in the part-time employment rate (especially in countries where the participation rate is low) + continuation of long-lasting trend towards lower collective working hours.
Decreasing average hours worked per person employed
Medium-run (effect not negligible in some countries)
Labour market reforms and continued wage moderation should foster labour deepening.
Decreasing capital intensity (K/L) Medium-run (fairly important effect)
Labour market reforms helping the low-skilled to join the labour market.
Decreasing the average skill of those employed (lower human capital)
Medium-run
Growing share of services sector (displaying relatively low productivity growth compared to manufacturing).
Decreasing capital intensity (K/L). Long-run (small effect)
Impact of an ageing population on innovation and entrepreneurship.
Decreasing TFP through a less dynamic and innovative society + potential impact on capital intensity due to the disinvestment of the elderly (life cycle theory).
Long-run
Upward risks
Product market reforms (including increasing R&D and deepening the connections between academia and firms) and increasing competition, in particular in the new and acceding Member States.
Increasing TFP by stimulating innovation (strengthening innovative capacity) + possible accumulation of physical capital induced by the short-term efficiency gains (dynamic efficiency)
Long-run/Medium run
Positive technology shock (ICT revolution): slow catching-up towards the US level of productivity through an increase in the share of the ICT sector plus greater use of ICT in the rest of the economy.
Increasing both TFP and capital intensity Long-run/Medium run
Some labour market reforms, such as the reduction of adjustment rigidities and the promotion of flexible working time arrangements, may further increase innovative capacity by favouring organisational change.
Increasing TFP by stimulating organisational innovation and via the circulation/utilisation of innovative techniques within firms.
Long-run/Medium run
Increasing the average educational attainment of the working-age population
Increasing the average skill of those employed (higher human capital)
Long-run
The enthusiasm for reform and overall levels of dynamism and innovation in an economy may be detrimentally affected by having an older labour force. Moreover, when this ageing of the labour force is combined with the much slower rates of capital accumulation which are expected to occur, leading in turn to an increase in the mean age of the capital stock, the outlook for TFP could be significantly worse. An increase in the average age of the capital stock in an economy is generally considered to be negative for labour productivity since continuing investment in new equipment is essential for incorporating labour-embodied technical progress into the production process (i.e. “vintage” effects).
3.2.2. Partial equilibrium analyses: estimating the effects of different factors on productivity.
examination of productivity determinants, other things remaining equal, in a partial equilibrium framework. In essence, this approach assesses the relative merits of the major hypotheses for explaining productivity: the role played by the regulatory environment (product, labour and financial markets); the degree of openness of economies; the efficiency of knowledge production (R&D and education); the determinants of physical investment levels; and finally the role played by demographics. More specifically, ageing is expected to operate through the following main channels: expenditure pressures on the public finances; “life-cycle” effects on private savings behaviour, as well as Ricardian equivalence effects operating through
the deterioration in public savings; labour supply implications; potential impact on
capital accumulation; effects on total factor productivity and finally, the equilibrating role of interest rates and exchange rates and shifts in external balances. While this approach is interesting and elucidating in terms of highlighting the key influences at work, it suffers from the fact that it excludes the crucial systemic effects of ageing, such as behavioural changes and shifts in financial market variables, which ideally must be taken into account in determining the final economic impact of ageing.
A similar method has been used by the OECD (2003), and Bassanini et al.(2001)13 to
estimate the long-run effects on productivity (output per working-age person). The OECD ran pool-time series regressions including macroeconomic variables, the tax burden, business R&D, tax expenditure, etc.
3.2.3. General equilibrium approach
An alternative to the partial equilibrium analysis is found in the general equilibrium approach, such as the one developed in the European Commission’s (DG ECFIN) “Ageing” model, which provides estimates for the EU15 aggregate. This type of model, including several cohorts, is part of the family of “overlapping generations models” which have been made popular by the work of Auerbach and Kotlikoff. It allows one to simulate the impact of ageing, taking due account of various economic interactions, often neglected by partial equilibrium approaches. It rests on an analytical framework which combines standard growth regressions with recent developments in endogenous growth theory. A general equilibrium approach is generally regarded as the most complex but comprehensive methodology for predicting the long run effects of ageing populations since it overcomes a number of the key limitations of static, partial equilibrium, analyses. The latter fail to take into account the effect of important systemic, dynamic, forces that will undoubtedly kick into action once ageing starts to impact on the economic system.
DG ECFIN has already produced a global growth scenario up to 2050 using such an approach, where the worldwide economic and financial market effects of ageing populations over the next 50 years are presented on the basis of a five region,
overlapping generations, model14. DG ECFIN regards this global ageing scenario as
the benchmark against which the estimates produced within the framework of the EPC-AWG budgetary projection exercise (and presented in this paper) should be compared.
13 OECD (2003). See also Bassanini et al.(2001).
14
However, one of the drawbacks of the general equilibrium approach is that the estimates produced are often too complex to be carried out for each EU Member State in a comparable manner. The effect of each determinant might not be the same across countries and consequently they might require a specific projection for each contributory factor. Moreover, the cross-country comparability cannot fully be guaranteed given the large number of parameters used and assumptions required.
3.3.
The merit of a “hybrid” approach: a “statistical” method embedded in a production function framework
This third approach, and the one adopted for the present paper, is to calculate
potential output using a combination of reasonable ad hoc assumptions for the long
run and established time series methods to extrapolate short-term developments. In this approach, ageing is mainly taken into account to the extent that it is already influencing developments in the labour force (projected through a cohort method approach)15.
Although this approach does not model nor take into account all relevant age-related factors, it is a clear improvement compared with the purely mechanical approach consisting in setting a common convergence target in labour productivity at the end of the projection horizon. The approach based on a production function is fairly standard in mainstream macro-models and is often used to make short-term (2-3 years) forecasts of productivity by international institutions16 (OECD, ECB, IMF, EC, etc). This methodology provides a sound economic basis and takes into account the interactions of labour force and employment projections on medium run productivity trends. An additional advantage is that it takes into account the slow convergence to the steady state from the initial conditions. This makes the projections in the short and medium run much more realistic (because of the “Keynesian” dynamics and the impact of capital or labour deepening). However, in the longer run (say 10-20 years), the model should converge to the neoclassical equilibrium conditions.
Moreover, while clearly less comprehensive from an economic standpoint compared with the general equilibrium method, the statistical approach has nevertheless advantages in terms of conceptual simplicity; in terms of its greater flexibility in taking more country-specific factors into account; and finally in its ability to focus on the medium term effect of the demographic slowdown on productivity. For all these reasons, this statistical method based on a production function framework was chosen by the EPC-AWG to project labour productivity and GDP until 2050. In the rest of the paper we will present the methodology and the main results of the projections.
15
For details on the methodology used and of the major results from the labour force projections see Carone (2005).
16
Institutions such as the OECD, ECB and IMF used such a framework in their model. Moreover, medium-term
4. OVERVIEW OF THE METHODOLOGY ADOPTED FOR THE PRESENT PROJECTIONS
The “statistical / production function (PF)” approach was the preferred option of the EPC-AWG given its flexibility and sound analytical basis, especially in terms of understanding the main components driving labour productivity developments. The production function framework is presented in section 4.1. The adoption of the production function framework requires the making of some specific assumptions regarding developments in specific labour productivity components, namely TFP and capital deepening in the medium run (section 4.2) and in the long-run (section 4.3).
4.1. The production function (PF) framework
As shown in graph 1, within the analytical framework of a (Cobb Douglas) production function, potential GDP can be represented by a combination of factor inputs, multiplied with the technological level or total factor productivity (TFP). The parameters of the production function essentially determine the output elasticities to the individual inputs.
C a p i t a l S t o c k
W o r k i n g A g e P o p u l a t i o n
T r e n d P a r t i c i p a t i o n
R a t e
L a b o u r F o r c e
P o t e n t i a l E m p l o y m e n t
N A I R U
L a b o u r P o t e n t ia l T o t a l F a c t o r P r o d u c t iv it y
G R A P H 1 : M E A S U R I N G P O T E N T I A L
O U T P U T U S I N G A P R O D U C T I O N F U N C T I O N A P P R O A C H
C O B B - D O U G L A S P R O D U C T I O N F U N C T I O N
E X T R A C T I N G T H E S T R U C T U R A L C O M P O N E N T
T O T A L F A C T O R P R O D U C T I V I T Y E M P L O Y M E N T
S t a t i s t i c a l T r e n d M e t h o d
Total output can be expressed more formally using a Cobb-Douglas production function with constant returns to scale:
( )
β ββ β β β
β − − = −
⎟ ⎟ ⎠ ⎞ ⎜
⎜ ⎝ ⎛ =
= 1 1
1 1
K . L . E K
. L . TFP K
. L . TFP
Y (2.1)
where:
L is the supply of labour, i.e. total employment (in number of persons employed if
there is no change in hours worked per person);
K is the stock of capital;
E is the labour-augmenting technical progress (i.e. Harrod-neutral technical progress);
E.L is then interpretable as total employment in efficiency units. TFP and
labour-augmenting technical progress are linked with a simple relationship: TFP=(E)β;
β is the labour share, i.e. the share of labour costs in total value-added. It’s value in the projection exercise is set at 0.65.17
However, as all these variables can be influenced by the business cycle in the short term, it is safer to project potential output, i.e. the output adjusted for cyclical movements in the economy. This requires estimating the trend components for the individual production factors, except for the capital stock, which can only adjust in the long run. Estimating potential output therefore amounts to removing the cyclical component from both TFP and labour input. Trend TFP is modelled as the HP Filtered Solow Residual. Potential employment is the total employment obtained when the unemployment rate equals the structural unemployment rate (NAIRU). It
equals LF*(1-NAIRU), where LF stands for the total labour force. Therefore, if we
assume a stable NAIRU in the medium/long term as predicted, potential employment
growth coincides with labour force growth. The potential output denoted Ypcan be
expressed in logarithms as the sum (in logarithms) of trend TFP18, potential
employment weighted by the labour share in total value-added and the total capital stock multiplied by 1 minus the labour share. More formally, we get:
Log(Yp)=Log(trendTFP)+βLog(LF*(1-Nairu))+(1-β)logK (2.2)
As a result, potential labour productivity growth comes down to the following
expression (where Y, L, E and TFP denote here “potential” output, potential
employment, trend labour-augmenting technical progress and trend TFP):
17
Although there was some debate about the possibility of a further decline in the labour share, most economists assume that it should remain broadly constant in the long run. The EPC-AWG agreed to assume that real wages will grow in line with labour productivity and, thus, the wage share will be constant over the projection period. This simple rule is uniformly applied to all Member States in order to allow for consistent cross-country comparisons of the results. The assumption is also well-founded in economic theory. If the real wage is equal to the marginal productivity of labour it follows that under the standard features of the production function, real wage growth is equal to labour productivity growth and real unit labour costs remain constant.
18
• • • • • ⎟ ⎠ ⎞ ⎜ ⎝ ⎛ − + = ⎟ ⎠ ⎞ ⎜ ⎝ ⎛ − + = ⎟ ⎠ ⎞ ⎜ ⎝ ⎛ L K E L K TFP L Y ) 1 ( ) 1
( β β β (2.3)
Thus, the projection of TFP growth and the growth in capital per worker, so called
capital deepening, are the key drivers of projected labour productivity over the medium run.
In the long-run, according to the neo-classical growth model (Solow model), the
economy should reach its equilibrium (also called steady state or balanced growth
path), where both the ratio of the capital stock to labour expressed in efficiency units, K/(L.E) and output to labour expressed in efficiency units (or output per effective worker), remain constant over time. As a result, both the capital stock per worker and productivity per worker grow at the same pace as labour augmenting technical progress E. Therefore, the growth rate of both coincides with TFP growth divided by the labour share β:
β • • • • = = ⎟ ⎠ ⎞ ⎜ ⎝ ⎛ = ⎟ ⎠ ⎞ ⎜ ⎝ ⎛ TFP E L K L Y (2.4)
It should also be noted that, in the steady state, the contribution of capital deepening
to output growth is a simple function of TFP19, which becomes the single driver of
labour productivity20.
• • • − = ⎟ ⎠ ⎞ ⎜ ⎝ ⎛ − = ⎟ ⎠ ⎞ ⎜ ⎝ ⎛ TFP ) 1 ( L K ) 1 ( L K contrib β β
β (2.5)
19
As the labour share β is set equal to 0.65, the long-run contribution of capital deepening to labour productivity growth is 0.54 times TFP growth rate and, under the assumption of a long-run TFP growth equivalent to 1.1% (see section 4.3), this implies a long-run contribution of capital deepening to labour productivity growth equal to 0.6%. 20
BOX 1- Further possible refinements of the production function
In this paper, we will use a simple form of the production function. However, we can refine its specification to take into account various factors which are not modelled in the baseline but are tackled in the sensitivity tests at the end of the paper.
The key formula (2.3) can be augmented so as to separate out the effect of average annual hours worked per person denoted h and the enhancement in capital human HC (e.g. the relative productivity across age groups). If we denote N the number of persons employed and L the total labour input (skill-adjusted hours worked in the economy), we obtain the following relationship:
L= h.HC.N (2.6)
Using (2.6), we can rewrite (2.3) in the following way:
• • • • • + + ⎟ ⎠ ⎞ ⎜ ⎝ ⎛ − + = ⎟ ⎠ ⎞ ⎜ ⎝ ⎛ h HC N K TFP N Y . . ). 1
( β β β (2.7)
Therefore, labour productivity growth as measured by the growth in GDP per worker is the weighted sum of the increase in TFP, the stock of physical capital per worker, a human capital indicator and average annual hours worked per worker. The effect of sectoral reallocations can be incorporated in the impact on TFP growth and the accumulation of capital.
However, in the long run, according to the Solow neoclassical model, output per effective worker (or skill-augmented hourly labour productivity growth) and capital per effective worker are constant. This implies that labour productivity growth should equal the growth in TFP (divided by the share of labour in output) in the steady state, when the stock of capital adjusts.. In other words, we get in the long run:
• • • • • • • + + = + + = ⎟ ⎠ ⎞ ⎜ ⎝ ⎛ h HC E h HC TFP N Y β 1 (2.8)
This means that productivity growth measured as GDP growth per person employed coincides with total factor productivity weighted by the labour share β in total value added, if there is no change in human capital and hours worked per person.
4.2.
Short-to-medium term projections (2005-2009): underlying assumptions
For the short-to-medium term the EPC-AWG decided to use the same approach as that used to estimate potential output and thus the output gap. These estimates are used in the assessment of the cyclical budgetary position of Member States, within the surveillance framework of the Stability and Growth pact (SGP)21. The statistical approach used by DG ECFIN and the Output Gap Working Group (OGWG) is applied to historical (starting in the mid-1960’s) and forecast data. For the historical period the series at hand are taken from DG ECFIN’s AMECO databank, with the Commission services final Spring 2005 forecasts for the years 2005-2006 being used. A “Medium Term Extension” model is used to cover a period of 3 years from the end of the short-term forecasts i.e. in this case to run estimates from 2007-2009. It is important to stress that this technical extension is in no way a forecast for these years. It is simply an attempt to illustrate what would happen if the trends of the most recent years were to continue on, using established and transparent ARIMA procedures. The
21
potential growth rates for the three extension years are calculated using the standard key inputs, calculated using the methodology presented below.
4.2.1. Trend Total Factor Productivity (TFP)
Trend TFP is modelled as the Hodrick-Prescott (HP) filtered Solow Residual. TFP is calculated until the end of the short term forecast horizon, using the forecasts for GDP, employment and the capital stock. For the medium term extension, a TFP forecast is generated with a simple autoregressive model, where the log of current TFP is explained by a constant, a time trend and lagged values of TFP. Lags up to three years are allowed such as to render the residual white noise. This is the simplest time series representation and is likely to provide smooth projections. The HP trend is then calculated on the whole series.
4.2.2. Kalman filter generated NAIRU
The trend specification chosen for the NAIRU implies that the best prediction for the change in the NAIRU in future periods is the current estimate of the intercept. This basically implies that the slope of the NAIRU in 2006 should be used for the projection until 2009. Such a specification seems problematic for longer-term projections since it will eventually violate economic constraints (such as non-negativity of the NAIRU, for example). An alternative specification which is more consistent with the common notion of the NAIRU as a stable long run level of the unemployment rate would be a random walk without drift. This specification would imply a flat extrapolation of the last NAIRU value. Though this specification does not work well in estimation for European data where persistent trend changes of the unemployment rate can be observed, it may be a more plausible specification for the projections. The final methodology for the medium term NAIRU agreed by the OGWG represents a compromise between the preceding two concepts. It was decided that the NAIRU would be projected according to the following simple rule:
) (
* 5
. 1
1 −
+ = t + t − t
t NAIRU NAIRU NAIRU
NAIRU
In forecasting the NAIRU, while taking into account possible lagged effects of recent reforms, 50% of the most recent decline is allowed for. This implies that the NAIRU is practically stable in 2009, because after 3 years the change in the NAIRU only amounts to 12.5% of the decline in 2006.
4.2.3. Population of working age
In terms of a projection for the population of working age for the three years 2007-2009, Eurostat’s most recent population projections are used.
4.2.4. Participation rates
A “cohort component” approach is used to project participation rates by different age
groups and gender on a single year basis22. In essence, this cohort methodology has
the following features:
22
• Entry and exit rates calculated, by single age and sex, as an average over the period 1997-2003.
• Entry rates are assumed to be constant throughout the whole forecasting
period with no projected decline in participation rates in the age brackets 15-20.
• Adjustments to exit rates for persons aged 55 to 64 are made to take into
account the effects of recent pension reforms in 18 countries.
Moreover, for several Member States (in particular Germany, Belgium and Luxembourg) labour force (and unemployment) figures projected using the labour force survey have been converted into national accounts or administrative data equivalents23.
4.2.5. Capital formation: fixed investment-to-GDP ratio
Since the purpose of the short-run exercise is to get an estimate for potential output up to 2009, the investment to potential GDP series is used as an exogenous variable. Its projection for the period 2007-2009 is based on an autoregressive (AR) process allowing for a constant and a time trend estimated until 2006. Notice, this makes investment endogenous. For a constant investment to GDP ratio, investment responds to potential output with an elasticity equal to one. Simple investment projections are consistent with the efficient use of physical capital (see BOX 2).
23