Munich Personal RePEc Archive
Integratation of Tradable Green
Certificate Markets: What can be
expected?
Amundsen, Eirik S. and Nese, Gjermund
2006
Online at
https://mpra.ub.uni-muenchen.de/10628/
Integration of Tradable Green Certificate Markets: What can
be expected?
by
Eirik S. Amundsen1 and Gjermund Nese2
Abstract:
Recently, many countries have introduced systems of tradable green certificates
(TGCs) in order to increase the proportion of their electricity supply obtained from
renewable sources. The main objective of this paper is to investigate the analytics of a
TGC system of the Nordic type when integrated within several countries and to
determine what can be expected from the system when applied in a real world setting.
Both an analytical and a partial equilibrium version of the model are applied. In
particular, we ask whether it is possible to derive analytically clear cut results with
respect to how the system affects generation of electricity from renewable resources,
and from carbonemitting resources, in the same way as it is possible for other known
policy instruments such as an emission permit system or a plain carbon emission tax. A
key result is that TGCs may be an imprecise instrument for regulating the generation of
green electricity and that the combination of TGCs with a system of tradable emission
permits may yield outcomes contrary to the intended purpose.
JEL classifications: C7; Q28; Q42; Q48
Key words: Renewable energy, electricity, green certificates, emissions trading
1
Professor, Department of Food and Resource Economics, University of Copenhagen , Rolighedsvej 25, 1958, Frederiksberg C, Denmark, tel: +45 35 28 68 28, fax.: +45 35 28 68 01, e-mail: [email protected]
2
1. Introduction3
Many countries pursue policies to increase the share of renewable energy in their total
energy consumption. For example, the EU has an explicit target to increase its share of
"green" electricity, generated from renewable energy sources, from its current level of
14% to 22% by 2010 (EU/COM, 2000). Similar targets exist for the USA (e.g., see
EPA, 2003). Until recently, the generation of green electricity had been stimulated by
various subsidy schemes, including subsidized investments, tax relief, and direct
subsidies per unit of green electricity generated. However, with the liberalization of
electricity markets, interest has shifted towards other subsidy measures. One
proposition that has become popular is to introduce systems of tradable green
certificates (TGCs). Such systems tend to have different designs in different countries,
but a common feature is that they seek to replace direct public subsidies for renewable
energy with incentive systems that use the market mechanism. More precisely, the
objective is to create a market where various kinds of green electricity compete on
equal terms to relieve the government of the burden of direct involvement in the
electricity sector's investment decisions.
Since 1998, the Netherlands has applied a system of "green labeling", which is a
voluntary system of green certificates. The UK and Sweden have compulsory systems
that use the market mechanism more directly for TGC trading. These systems differ
significantly from the more established feed-in tariff subsidy schemes that exist in
countries such as Germany (see Butler and Neuhoff, 2004). Many European countries
participate in the Renewable Energy Certificate System (RECS) that, although not a
support scheme itself, facilitates many support schemes for green energy.4 In addition,
several countries outside the EU have shown an interest in introducing TGC systems,
including Australia, USA, China, and India (see Giovinetto, 2003).
In 2002, the UK introduced a TCG system called the UK Renewables Obligation
Certificate (ROC) Market. Sweden introduced its system in 2003. The Norwegian
Parliament has not yet decided but plans exist that Norway and Sweden will start
3
Financial support from SNF's Energy Research Program (financed by Gassco, Statkraft, Statnett and Statoil), the Norwegian Research Council (RENERGI), and the Nordic Energy Research Program (NEECI) is gratefully acknowledged.
4
trading TGCs at some future date, thus creating the first integrated TGC market
involving several countries.5 As well as analyzing the general functioning of a TGC
market of the Nordic type,6 this paper discusses how a TGC market is expected to
perform when it expands to include several countries.
As in any other market, the markets for TGCs consist of suppliers and buyers.
Suppliers are the producers of green electricity who receive an amount of TGCs
corresponding to the amount of green electricity they generate. The suppliers may sell
these TGCs on the TGC market. In this way, the producers receive both the wholesale
price and the TGC price per MWh of green electricity generated. Buyers of TGCs are
the retailers or consumers, who are obliged by the government to keep a certain amount
of TGCs in relation to the total amount of electricity they consume (i.e., both green and
"black" electricity). This requirement is referred to as the "percentage requirement".
Thus, the demand for TGCs is derived simply as a percentage of the total end use
demand for electricity. Based on supply and demand, a single TGC price may then be
established. The percentage requirement is the primary policy instrument7 that the
government may use in order to attain the targets for green electricity generation and
for the mix of black and green electricity. Both Sweden and the UK have specific plans
for escalating their percentage requirements.
Along with the development of the TGC markets in Europe, a more general and
comprehensive system of emission permits trading (ETS)8 is about to emerge in the
EU. The simple idea underlying the ETS is that the emission permit price will add to
5
In 2004, Nord Pool began trading TGCs on the Swedish market. TGC prices are posted on the Nord Pool web page at www.nordpool.no.
6
One particular characteristic of the Nordic system is that only small new hydro power plants qualify for TGCs, whereas existing large hydro power plants do not. Hence, even though electricity generation in a country like Norway is based on almost 100% waterpower, only electricity generated by biomass, wind, and new small hydro power plants' biomass will count as green electricity in the TGC system. For this reason, it is likely that the percentage requirement will be set at a rather low level (i.e., 2–5%).
7
As the UK system the Nordic TGC system sanctions retailers/ consumers for not complying with the system. Hence, in the Swedish system the retailers have to pay a penalty for not having sufficient TGCs. The penalty is set equal to 150% of the annual average price for the period in question. One basic difference between the UK system and the Nordic system is that the former allows recycling of revenues from the buy-out payments required of electricity companies that do not obtain sufficient ROCs. These buy-out payments are recycled to suppliers that have presented ROCs. By contrast, the Norwegian system does not involve any recycling of the corresponding penalty payments.
8
the cost of using a carbon emitting resource, the cost increment being in proportion to
the emissions per unit of the resource used. As a result, input substitution in the long
run is expected to take place in electricity generation, away from coal and gas power
towards hydro, wind, and nuclear power.9 Hence, even though this system is not
directly targeted at increasing the share of renewables in electricity provision, clearly
the system will have an influence on the relative cost of providing green electricity. In
order to take account of this influence we investigate how the TGC market and the
electricity market are affected by a carbon emission permit price or alternatively a
carbontax. 10
The main objective of this paper is to investigate the analytics of a TGC system of the
Nordic type when integrated within several countries and try to determine what can be
expected from the system when applied in a real world setting. In particular, we ask
whether it is possible to derive analytically clear cut results with respect to how the
system affects generation of electricity from renewable resources, and from carbon
emitting resources, in the same way as it is possible for other known policy instruments
such as an emission permit system or a plain carbon emission tax.
To some extent similar problems have been investigated earlier. Amundsen and
Mortensen (2001) investigated aspects of the percentage requirement for domestic TGC
and electricity markets. TGC price volatility and banking were dealt with by Amundsen
et al. (2006). Also, numerical models of TGC and electricity markets have been
formulated and analyzed (e.g., Bergman and Radetzki, 2003; Bye 2003; Nese, 2003).
Furthermore, the relationship between TGCs and carbon emission permits have been
addressed earlier; e.g., in Finon and Menanteau (2003), Jensen and Skytte (2003), and
Unger and Ahlgren (2003). However, unlike these papers, our focus is on the
integration of domestic TGC markets into a joint TGC market and on the analytics of
the effects of the major policy measure, the percentage requirement, and of a carbon
emission permit price/ carbontax.
9
Short run input substitution will be limited by available technological possibilities. Therefore, the immediate short run effect will probably be substitution from e.g. coal towards natural gas.
10
In the following we formulate both an analytic model to derive general results and a
numerical model to assess the functioning of the combined TGC and electricity markets
for Norway and Sweden in particular. The paper proceeds as follows. First, we consider
the joint functioning of a TGC market and an electricity market under autarky, focusing
on questions such as how the generation of green electricity is affected by the
percentage requirement, or by an emission permit price or an emission tax. Then, we
analyze the case where two countries trade in electricity, but not in TGCs. This
situation may be considered an interim case before a complete set of markets is in
place. We then proceed to analyze cases involving both a common TGC market and a
common electricity market. Thereafter, results from the numerical model are presented.
Finally, we discuss the analytical and numerical results obtained and conclude the
paper.
2. The model under autarky
In order to analyze the interplay between the electricity market and the TGC market
under autarky, we apply the following symbols and functional relationships.
=
p End-user price of electricity
=
s Price of TGCs
=
q Wholesale price of electricity
=
x Total consumption of electricity
=
y Production of "black" electricity
=
z Production of "green" electricity =
α Green electricity required as a proportion of total electricity consumption ("percentage requirement")
τ =Parameter representing a carbon emission permit price or a carbontax =
d
g Demand for TGCs
=
s
g Supply of TGCs
) (x
( ; )
c=c yτ : Industry cost function11 for black electricity with emission constraints. We
assume >0 ∂ ∂
y c
, 2 0
2
≥ ∂ ∂
y c
, and
2
0
c y τ
∂ >
∂ ∂ .
12
: ) (z h
h= Industry cost function for green electricity, where >0 ∂ ∂ z h
and 2 0
2
> ∂ ∂
z h
(.) Π =
Π : Profit function
2.1. First-order conditions and the equilibrium
In this model, the electricity producers supply a common wholesale market within
which a single wholesale electricity price is established. Retailers purchase electricity
on the wholesale market and TGCs on the TGC market. The electricity is distributed to
end users and a single end-user price is established. It is assumed that perfect
competition prevails in all markets, with many producers of both black and green
electricity, many retailers, and many end users. Hence, all agents treat the various
prices as given by the market.
The producers maximize:
[
]
( )y qy q s z c y( ; )τ h z( )
Π = + + − − .
The first-order conditions for black, respectively, green electricity generation are:
( , )
c y q
y
τ
∂ =
∂ , z
z h s q
∂ ∂ =
+ ( ).
For each unit of electricity (i.e. MWh) purchased in the wholesale market and sold on
to end users, retailers have to pay the wholesale price plus a share α of the TGC price.
11
The industry cost function is derived by "horizontal addition" of the individual cost functions; i.e., the cost of aggregate market supply is minimized. Using the industry cost function avoids using messy notation to describe individual decisions and our prime interest is in the equilibrium market solution, not individual decisions. However, little detail is lost by this approach as individual first-order conditions for electricity producers correspond directly to those derived in the analysis; e.g., conditions 3) and 4) in the main text.
12
For simplicity, electricity distribution is assumed costless.13 With a large number of
retailers, the competitive equilibrium established by the market must be characterized
by:p= +q αs. Otherwise, we assume that the amount of TGCs is measured in the same unit as the amount of green electricity. Thus, the demand for TGCs is given by
x
gd =α and the supply bygs = z.
Denoting equilibrium prices and quantities by starred symbols, the equilibrium of the
two markets is characterized by:
1) p(x*)=q* +αs* ;
2)
α * * *
* z
z y
x = + = ;
3) q* c y( *, ) y
τ
∂ =
∂ ;
4)
z z h s q
∂ ∂ =
+ * ( *)
* .
Inserting 2), 3), and 4) into 1), we find that the end-user price in equilibrium may be
written as a linear combination of the marginal costs of black and green electricity:
5) * ( *, ) ( *)
( ) (1 ) c y h z
p x
y z
τ
α ∂ α ∂
= − +
∂ ∂ .
From 2), we see that z* =αx*andy* =(1−α)x*.
2.2. The effects of the percentage requirement
In the TGC systems, the percentage requirement is perceived as a policy instrument to
determine the amount of green electricity in end-use consumption. However, because
the requirement is set as a percentage and not as a specific quantity, it is not necessarily
true that an increase of the percentage requirement leads to an increase of green
electricity generation. The share of green electricity generation in total electricity
13
consumption may well increase even if green electricity generation declines, if there is
a sufficient reduction of electricity consumption and of black electricity generation.14 In
the following section, we study these effects in more detail.
To examine the effect of an increase in the percentage requirement15 (i.e., )
*
α
d dz
on the
generation of green electricity, we substitute
α *
* z
x = and
α
α *
* (1 )z
y = − into (5) and
take the implicit derivates. Hence, omitting the starred symbols for the sake of simplicity, we obtain:
D y c x p x s d
dz
∂ ∂ − − ∂ ∂ + = 2 2 ) 1 ( α α
α ,where
∂ ∂ − ∂ ∂ − − ∂ ∂
= 2 22
2 2 2 ) 1 ( z h y c x p
D α α .
An inspection of the signs shows that the denominator is negative, whereas the
numerator is indeterminate. Hence, the effect on green electricity generation is
indeterminate.
With respect to the effect on black electricity generation we obtain:
0 ) 1 ( 2 2 < ∂ ∂ − ∂ ∂ + − = D x p z h x s d
dy α α
α .
Inspection of signs shows that the numerator is positive, whereas the denominator is
negative. The generation of black electricity is reduced as the percentage requirement
increases.
With respect to the total electricity consumption, we find:
14
In the Swedish system, however, there is no doubt that the intention of the TGC market is to stimulate an increase of capacity for generating green electricity. For this reason, our focus throughout the paper will be on how the absolute generation of green electricity is affected.
15
D
y c z
h x s
d
dx
∂ ∂ − − ∂ ∂ +
= 2
2
2 2
) 1 ( α
α
α .
Inspection of signs shows that this expression is generally indeterminate. However, if
the marginal cost of black electricity is constant (i.e., 2 0
2
= ∂ ∂
y c
), we easily see that
0 <
α
d dx
. Thus, an increase of the percentage requirement will lead to a reduction of
total electricity consumption. However, the impact on green electricity generation
remains indeterminate. In addition, the effects depend on the level of the percentage
requirement, α .16 For example, if α =0, then >0
α
d dz
, whereas α
d dx
is indeterminate.
Hence, in conclusion, the introduction of a TGC system of the Nordic type does not
necessarily lead to greater green electricity generation, but it does lead to a reduction of
black electricity generation. Furthermore, the effect on total electricity generation is
indeterminate.
2.3. The effects of the emission permit price/emission tax
In order to investigate the equilibrium effects of increased emission permit
price/emission tax on green electricity, we take the implicit derivate of 5) with respect
toτ and obtain:
2
(1 )
0
c
dz y
d D
α α
τ τ
∂ −
∂ ∂
= < .
With the assumed cross effects of the marginal cost function of black electricity it
follows that the numerator is positive so that the total effect is negative. Hence,
increased emission permit price/emission tax will not lead to an increase in the
generation of green electricity. On the contrary, generation of green electricity will
16
decline.17 Asz* =αx* =α(1−α)y*, both the generation of black electricity and the
total consumption will also decline.
It may seem paradoxical that an increased emission price can actually lead to a
reduction in the generation of green electricity, as this normally is supposed to
advantage the producers of green electricity. However, due to the interplay of the
emission constraints with the TGC market, this will not be the case despite the fact that,
viewed in isolation, both systems work towards the same end of reducing carbon
emissions. The reason for this lies in the specific construction of the TGC system. An
increase of an emission permit price/ emission tax implies an upward shift of the
marginal cost function for black electricity.18 Recalling that the marginal cost function
for electricity generated in the required proportion of green and black electricity is a
linear combination of the marginal cost functions for green and black electricity,
respectively, it follows immediately that the marginal cost function for electricity in the
required proportion also must shift upwards. Consequently, in equilibrium, the end user
price must be higher, consumption must be lower, and so must the generation of both
green and black electricity in order to preserve the proportion given by the percentage
requirement.
3. Trade in electricity only
In this section, we investigate how a TGC system functions in an open economy by
expanding the model to include simultaneously functioning markets for electricity and
TGCs in two countries, country A and country B. The variables involved are the same
as those under autarky, but there is one set of variables for each country, denoted by
subscript, i = A, B. In addition, we introduce the "trade variables", m and n,
representing imports of electricity and TGCs, respectively. Demand may differ between
17
In general, any positive shift of the marginal cost function for black electricity (e.g. resulting from an increase of input prices of black electricity generation) will induce a reduction in the generation of green electricity.
18
the two countries, but the demand functions have the same mathematical characteristics
as the demand function in the previous section. Furthermore, we assume that the
technologies applied in generating black and green electricity may differ between the
two countries. This implies that comparative advantages and disadvantages may exist
in the generation of black and green electricity of the countries. We assume that the
cost functions for black and green electricity have the same mathematical
characteristics as above.
3.1. First-order conditions and the equilibrium
First, we assume that cross-border trade takes place only for electricity, not for TGCs.
Furthermore, for simplicity, we assume that there are no transaction costs involved and
that there are no transmission constraints between the countries.19 For these reasons, we
can consider the electricity markets of countries A and B to be a single market with a
common wholesale price; i.e., qA =qB =qM. As there are only two countries involved,
one country's imports must equal the other country's exports. Therefore, in equilibrium,
it must be the case that * *
B A m
m =− . The equilibrium conditions for each of the markets
in each of the countries can be expressed as follows:
6) pi
( )
xi* =q*M +αisi*;7)
i i i i i i
z m z y x
α * * * *
* = + + =
;
8)
i i i i M
z z h s q
∂ ∂ =
+ * ( *)
*
;
9)
*
* i( i, )
M
i
c y q
y
τ
∂ =
∂ .
Inserting 8) and 9) into 6), we find as under autarky:
10)
( )
(
)
* *
* ( , ) ( )
1 i i i i , ,
i i i i
i i
c y h z
p x i A B
y z
τ
α ∂ α ∂
= − + =
∂ ∂ .
19
3.2. The effects of the percentage requirement
In this section, we assume that the percentage requirement may be different between
the two countries and focus on the effects of an increase in the percentage requirement
in one of the countries, e.g. country A.
Taking the implicit derivate of 10) with respect to αA,we find that the only signs that
can be determined with certainty are those belonging to the effects on total combined
black electricity generation for countries A and B, and the effects on country B's green
electricity generation and electricity consumption. These effects follow from the
expression below:
(
)
A B B A B A A A A A A A AA D E D E
E x p z h x s d dY + ∂ ∂ − ∂ ∂ + − = 2 2 *
1 α α
α ,
whereY = yA +yB,
(
1)
2 02 2 2 2 2 < ∂ ∂ − ∂ ∂ − − ∂ ∂ = i i i i i i i i i z h y c x p
D α α and
2 2 2 2 2 i i i i i i i i y c x p z h E ∂ ∂ ∂ ∂ − ∂ ∂
= α , for i= A,B
Inspection of signs shows that the numerator is positive and the denominator negative.
Hence, the effect on the aggregate generation of black electricity in the two countries is
negative.
Furthermore, it can be shown that:20
A B A B A A A B A A d dz sign d dx sign d dm sign d dy sign d dy sign α α α α
α = = = − = − .
As <0 ∂
∂ A Y
α , it follows that ∂ <0 ∂
A A
y
α and ∂ <0
∂
A B
y
α . Furthermore, it must be the case
that >0
A B
d dx
α and A >0
B
d dz
α . In other words, somewhat surprisingly, the increase of the
percentage requirement in country A leads to an increase in both electricity
20
consumption and green electricity generation in country B while these effects are
indeterminate for country A.21
In order to explain these effects, we first recall that an increase in the percentage
requirement will necessarily lead to a reduction in the wholesale price of electricity.
For country A, the effects on electricity generation and consumption are the same as
those under autarky. However, in this two-country model with a common electricity
market, the reduction of the wholesale price will imply that electricity becomes cheaper
in country B, thus leading to increased demand in this country. However, in order to
satisfy the percentage requirement, the demand for TGCs will have to increase in
country B. As there is no trade in TGCs, the increase in demand for TGCs can only be
satisfied by a corresponding increase of the TGC supply in country B. Hence, the
generation of green electricity will have to increase in country B. Therefore, we arrive
at the somewhat counterintuitive result that an increase of the percentage requirement
in country A may lead to a reduction of green electricity generation in country A, but
will definitely lead to an increase of green electricity in country B.
3.3. The effects of the emission permit price/emission tax
In this case an increase of the carbon emission permit price/ carbon tax implies a
reduction of green electricity generation in both countries, i.e. dzA 0
dτ < and 0 B dz
dτ < , a
reduction of total generation of black electricity, i.e. Y 0
τ
∂ <
∂ , and a corresponding
increase of the wholesale price, i.e. qM 0
τ
∂ <
∂ . (Proof is given in Appendix A). The
intuition behind these results is the same as the intuition for the autarky case.
4. Trade in both electricity and TGCs
In this section both electricity and TGCs are traded. This implies that both the
wholesale price of electricity and the price of TGCs are common for the countries.
21
Hence, sA and sB are replaced by sM in the objective functions and first-order
conditions below. Otherwise, the model specification is as in the previous case.
4.1. First-order conditions and equilibrium
TGCs will be imported if the domestic demand for certificates exceeds the domestic
supply. In equilibrium, the imports of one country will be equivalent to the exports of
the other country; i.e. n*A =−n*B. The trade in TGCs implies that the relative share of
green electricity generated in one country may be different from the percentage
requirement. The equilibrium can be expressed as follows:
11) pi
( )
xi* =q*M +αisM* ;12) i i i i i i i n z m z y x α * * * * * * = + + = + ; 13) i i i M M z z h s q ∂ ∂ = + * ( *) * ; 14) *
* i( i, )
M i c y q y τ ∂ = ∂ .
Inserting 13) and 14) into 11), we find again.
15)
( )
(
)
* *
* ( , ) ( )
1 i i i i , ,
i i i i
i i
c y h z
p x i A B
y z
τ
α ∂ α ∂
= − + =
∂ ∂ .
4.2. The effects of the percentage requirement
The analysis shows that it is possible to determine only the effect on black electricity
generation of an increase in the percentage requirement. Again, this effect is negative
i.e. <0
A d
dY
α . To realize this, assume the opposite i.e. A 0 dY
dα ≥ . This implies an
increase in green electricity generation in order to fulfill the percentage requirement in
both countries. Hence, in equilibrium, the consumption of green electricity must
increase in both countries, as we now have a common market for both electricity and
TGCs. Constant or increased generation of black electricity implies that the wholesale
green electricity to increase, the price of green electricity, qM +sM, must increase. From
11), this implies an increase in the end-user price of electricity in both countries. This is
not compatible with an increase in the consumption of electricity. Thus, we have a
contradiction, which leads to the result that <0
A
d dY
α . Furthermore, as in the case of
trade in electricity only, it can be shown that
A B A
A
d dy sign d
dy sign
α
α = . Hence, we must
have <0
A A
d dy
α and A <0
B
d dy
α .
Furthermore, the analysis shows that the effect on total green electricity generation of
increasing the percentage requirement in country A is indeterminate. As we now have a
common market for TGCs, it can be shown that:
A B A
A
d dz sign d
dz sign
α
α = . Thus, in
contrast to the case of trade in electricity only, an additional opportunity for trading
TGCs implies that we no longer obtain the unambiguous result that an increase of αA
leads to an increase in green electricity generation in country B. The change in green
electricity generation must now occur in the same direction in both countries.22 Finally,
the results show that the effect on electricity consumption is indeterminate in both
countries.
4.3. The effects of the emission permit price/ emission tax
In this case, increased emission permit price/emission tax implies a reduction of green
electricity generation in both countries i.e. dzA 0
dτ < and 0 B dz
dτ < , a reduction of total
generation of black electricity, i.e. Y 0
τ
∂ <
∂ , and a corresponding increase of the
wholesale price, i.e. qM 0
τ
∂ <
∂ . (Proof is given in Appendix A). The intuition behind
these results is the same as the intuition for the autarky case.
22
5. Numerical analysis and discussion
The results from the analytical model investigated above are somewhat discouraging.
Indeed, as can be seen from Table 1 that summarizes the results, not very much can be
said about the effects of increasing the percentage requirement that is the main policy
instrument of the TGC system. In fact, with trade in both electricity and TGCs the only
clear cut result is that the generation of black electricity will be reduced in the
participating countries, and there is no guarantee that generation of green electricity
will be stimulated. Also, nothing precise can be said about the effect on total electricity
generation. However, an increase of the emission permit price/emission tax will
definitely reduce green electricity generation which may seem somewhat surprising. In
view of these results it may be of some interest to investigate how the TGC system will
function when applied to a real world case. For that purpose we apply a partial
equilibrium model for Norway and Sweden using realistic parameter values.
Table1. Effects of the percentage requirement (α ) and of the emission permit
price/emission tax (τ )
A A
d dz
α A
B
d dz
α A
A
d dy
α A
B
d dy
α A
A
d dx
α A
B
d dx
α
A dz
dτ
B dz
dτ
Autarky ? - ? -
Trade in electricity only
? + - - ? + - -
Trade in electricity and TGCs
? ? - - ? ? - -
The model is based on the principles of the analytical model developed above and is
designed to take care of trade in both electricity and TGCs between the two countries in
2010.23 It determines equilibrium prices and quantities on, and cross border tariffs
between, the electricity markets as well as equilibrium prices and trade on the markets
for TGCs in Norway and Sweden. Basic features of the model are described in
Appendix B.
23
First we consider the effects of introducing a TGC system with a percentage
requirement of 5% for Norway and 12.7% for Sweden.24 Thereafter we consider the
effects of changing the carbon emission tax. We follow the general structure of the
analytical part of the paper and consider three scenarios for each of these two cases: i)
Autarky, ii) Trade of electricity only and iii) Trade in electricity and TGCs.
5.1 The effects of introducing a TGC system
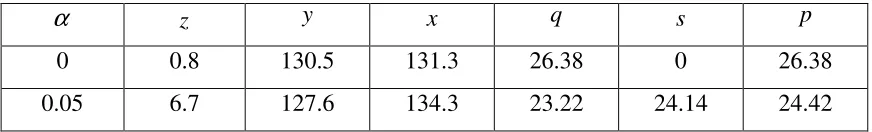
The effects of introducing a TGC system for Norway are summarized in Table 2.
Technically this has been achieved by increasing the percentage requirement from zero
to 5%.
Table 2. Effects of introducing a TGC market for Norway. Figures in TWh and
EUR25/MWh
α z y x q s p
0 0.8 130.5 131.3 26.38 0 26.38
0.05 6.7 127.6 134.3 23.22 24.14 24.42
As can be seen from Table 2, we have the expected effects of reduced wholesale price
of electricity and reduced generation of black electricity. Also, there is an increase of
green electricity as well as of total electricity generated and a reduction of the end user
price. Basically what is happening in this case is that revenues (hydro rents) are
transferred from hydro power producers as subsidies to the producers using new green
generation capacity. Hence, for this numerical case, the indeterminate effects on green
electricity generation and total electricity consumption from the analytical model have
been determined.
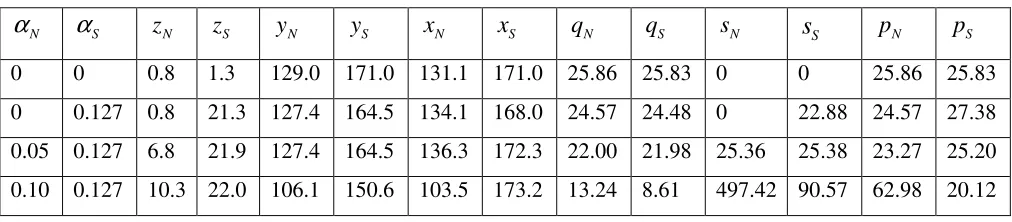
Table 3 displays the effects of introducing TGC markets in both countries but allowing
for trade in electricity only. The Table shows three features. Firstly, it shows that the
effects of introducing a TGC market in Sweden are similar to those in Norway.
24
For Sweden this percentage corresponds to the escalation plan for 2010. For Norway a percentage requirement of 5% has been proposed but not decided.
25
[image:18.595.102.538.365.431.2]Table 3. Effects of introducing TGC markets for Norway and Sweden with trade in
electricity only. Figures in TWh and EUR/MWh
N
α αS zN zS yN yS xN xS qN qS sN sS pN pS
0 0 0.8 1.3 129.0 171.0 131.1 171.0 25.86 25.83 0 0 25.86 25.83
0 0.127 0.8 21.3 127.4 164.5 134.1 168.0 24.57 24.48 0 22.88 24.57 27.38
0.05 0.127 6.8 21.9 127.4 164.5 136.3 172.3 22.00 21.98 25.36 25.38 23.27 25.20
0.10 0.127 10.3 22.0 106.1 150.6 103.5 173.2 13.24 8.61 497.42 90.57 62.98 20.12
Secondly, Table 3 shows the effects of introducing a TGC market in Norway in
addition to that in Sweden. In this case the generation of green electricity as well as
total electricity consumption increase in both countries. Furthermore, the wholesale
prices fall in both countries but due to the assumed stepwise linear marginal cost
functions the generation of black electricity is not affected in any of the countries.
Thirdly, Table 3 shows what is happening as the percentage requirement increases in
Norway (from 5 to 10 percent) but remains the same in Sweden. One effect of this
change is a reduction of black electricity generated in each of the countries and a
corresponding reduction of wholesale prices (that are not completely equalized due to
transmission constraints). Also we see that the generation of green electricity increases.
This is as expected for Sweden according to the analytical model. However, even the
green electricity generation in Norway increases. This effect was indeterminate in the
analytical model. Furthermore, it turns out that total electricity consumption falls in
Norway while it increases in Sweden. Also, Table 3 shows that this change has very
strong effects on the TGC prices and end user prices in both countries.
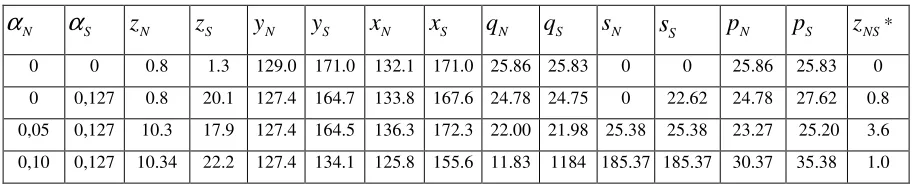
Table 4 displays the effects of introducing TGC markets in Norway and Sweden and
allowing for trade in both electricity and TGCs. We observe that the generation of
green electricity is increased in both countries. In Norway the increase is larger in the
case of a common TGC system between Norway and Sweden, than in the case of
separate TGC systems. In both the cases, the generation of black electricity is reduced.
This reflects a competitive advantage for generation of green electricity in Norway.
Thus, TGCs are exported from Norway to Sweden. As expected, Norway and Sweden
[image:19.595.72.578.129.240.2]Table 4. Effects of introducing TGC markets for Norway and Sweden with trade in both
electricity and TGCs. Figures in TWh and EUR/MWh
N
α αS zN zS yN yS xN xS qN qS sN sS pN pS zNS*
0 0 0.8 1.3 129.0 171.0 132.1 171.0 25.86 25.83 0 0 25.86 25.83 0 0 0,127 0.8 20.1 127.4 164.7 133.8 167.6 24.78 24.75 0 22.62 24.78 27.62 0.8 0,05 0,127 10.3 17.9 127.4 164.5 136.3 172.3 22.00 21.98 25.38 25.38 23.27 25.20 3.6 0,10 0,127 10.34 22.2 127.4 134.1 125.8 155.6 11.83 1184 185.37 185.37 30.37 35.38 1.0
* This variable reflects the net export of TGCs from Norway to Sweden
The last row of Table 4 illustrates a situation in which Norway increases its percentage
requirement from 5 to 10 per cent, while Sweden continues on 12.7 per cent. In
accordance with the theoretical results we note that the positive effect on the generation
of green electricity is significantly stronger in Sweden than in Norway, even as the
Swedish percentage requirement is unchanged, while the Norwegian percentage
requirement is increased. In this case, the consumption of electricity is, however,
reduced in both countries.
5.2 The effects of the emission permit price/ emission tax
From Table 5 we see that the effects of increasing the emission permit price/ emission
tax for Norway under autarky are rather small. The reason is that electricity in Norway
is mostly generated from hydro which causes no carbon emissions. However, as can be
seen from Table 5, the wholesale price of electricity increases, thus leading to a little
less black electricity generated. Otherwise, there is no noticeable effect on green
electricity generation, but the price of TGCs falls in accordance with the analytical
results.
Table 5. Effects of changing the emission permit price/ emission tax for Norway under
autarky. Figures in TWh and EUR/MWh
τ z y x q s p
0 6.7 127.6 134.3 23.22 24.14 24.42
4,2 6.7 127.4 134.1 23.25 24.11 24.46
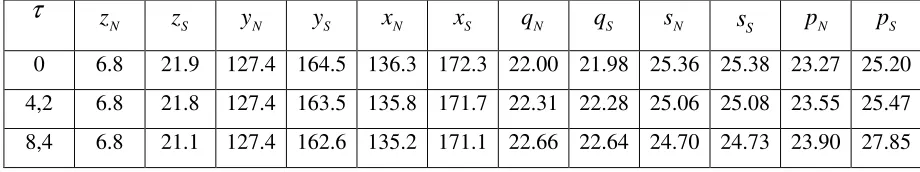
Table 6 displays the effects of increasing the emission permit price/ emission tax for
Norway and Sweden with trade in electricity only. Again, the effects of changing the
carbon tax are relatively modest as both Norway and Sweden have little emission of
carbon in electricity generation. Sweden does, however, have some generation coming
from combined heat and power plants. This appears to be the marginal technology for
generation of black electricity in the simulations. Thus, this is the reason why the
generation of black electricity in Sweden is reduced as the emission permit price/
emission tax is increased, while Norway is not affected at all. Furthermore, we notice
that raising the emission permit price/ emission tax leads to a higher wholesale price of
electricity and a lower TGC-price. Our result from the theoretical analysis thus seems
to be confirmed by the numerical simulations, i.e. increasing the emission permit price/
emission tax in a system which also includes TGCs may have an adverse effect on the
generation of green electricity; although, the effect is not very strong.
Table 6. Effects of changing the emission permit price/ emission tax for Norway and
Sweden with trade in electricity only. Figures in TWh and EUR/MWh
τ
N
z zS yN yS xN xS qN qS sN sS pN pS
0 6.8 21.9 127.4 164.5 136.3 172.3 22.00 21.98 25.36 25.38 23.27 25.20
4,2 6.8 21.8 127.4 163.5 135.8 171.7 22.31 22.28 25.06 25.08 23.55 25.47
8,4 6.8 21.1 127.4 162.6 135.2 171.1 22.66 22.64 24.70 24.73 23.90 27.85
Finally, Table 7 shows the effects of changing the emission permit price/ emission tax
for Norway and Sweden with trade both in electricity and TGCs. We notice that
opening of trade in TGCs does not affect the results, other than for the domestic
generation of green electricity. The effects of changing the emission permit price/
emission tax are similar to the case in which only electricity is traded.
Table 7. Effects of changing the emission permit price/ emission tax for Norway and
Sweden with trade both in electricity and TGCs. Figures in TWh and EUR/MWh
τ zN zS yN yS xN xS qN qS sN sS pN pS zNS*
0 10.3 17.9 127.4 164.5 136.3 172.3 22.00 21.98 25.38 25.38 23.27 25.20 3.6
4,2 10.3 17.8 127.4 163.5 135.8 171.7 22.30 22.28 25.08 25.08 23.56 25.47 3.6
[image:21.595.97.557.402.488.2] [image:21.595.85.556.676.768.2]6. Summary and concluding remarks
The main objective of this paper is to investigate the analytics of a TGC system of the
Nordic type when integrated within several countries and try to determine what can be
expected from the system when applied in a real world setting. In particular, we ask
whether it is possible to derive analytically clear-cut results with respect to how the
system affects generation of electricity from renewable resources, and from carbon
emitting resources, in the same way as it is possible for other known policy instruments
such as an emission permit system or a plain carbon emission tax. In particular, the
paper addresses the role of policy measures in TGC markets, the integration of
country-specific TGC markets, and compatibility issues between TGC markets and an emission
permit system/ emission tax system. Both an analytical model and a partial equilibrium
model for Norway and Sweden are applied.
One of the main conclusions of this paper is that the percentage requirement is not a
very precise policy measure for stimulating green electricity generation. Thus, an
increase of the percentage requirement will not necessarily lead to an increase of green
electricity generation in the long run, though it will lead to less generation of black
electricity. It guarantees only an increase in green electricity's share of total
consumption. These results are shown to be valid for all the cases investigated; i.e.,
under autarky and when electricity, or both electricity and TGCs, are traded between
two countries. However, it should be noted that a larger percentage requirement may be
compatible with more green electricity generation over time if there is a general
increase of demand. Still, the immediate effect of a higher percentage requirement on
green electricity generation cannot be guaranteed.26 Hence, if the objective is to achieve
a given target of new green generation capacity, a TGC system may not be the best
system to use. Other systems, such as a tendering or auction system, or a system of
plain subsidies, may work better in this respect. On the other hand, the TGC system
does provide a strong role for market forces and do take account of consumers'
willingness to pay for electricity via the effects on demand and the end-user price. In
26
addition, the TGC system allows for voluntary purchases of TGCs by consumers who
wish to support green electricity generation.27
Furthermore, as both the theoretical and numerical analysis show, an increase of the
percentage requirement will have an indeterminate effect on total electricity
consumption under autarky. Also, in the case where one country implements a TGC
system and trades electricity with another country, the effect of an increase of the
percentage requirement on total consumption will be indeterminate in the country
implementing the TGC system. However, as confirmed in the numerical analysis, the
other country will experience an increase in both the total electricity consumption and
green electricity generation. Still, allowing for trade of TGCs between the countries
leads to an indeterminate effect on both these variables in the country that does not
implement the TGC system.
Another main conclusion of the paper is that an increase of an emission permit price/
emission tax will push the price of TGCs downwards, lowering the profits of the green
electricity producers and thus lead to a reduction of green electricity generation. This
result was shown to be valid in all specified cases as well as in the partial equilibrium
model. This also raises the question as to why two policy measures are needed to
achieve what seems to be a common goal (i.e. emission reduction), as in the case of the
European ETS and TGC systems. Presumably, the answer is that the aims of the two
systems are somewhat different. The ETS system is targeted at reducing global
emissions of carbon and says nothing about that this must be achieved through
increased generation of green electricity. The TGC system, on the other hand, is
targeted directly at achieving an electricity supply from renewable sources. Clearly, the
TGC system may achieve a reduction of carbon emissions, but it also reduces the use of
nonrenewable sources, notably crude oil and natural gas, that are in scarce supply and
used at the expense of future generations.
Additional problems associated with the TGC systems need to be resolved. One
problem relates to TGC price volatility. If the green generation technologies in a
country largely consist of wind or water power, sizable and erratic variations of green
27
electricity generation may occur, owing to natural annual variations of wind or
precipitation. Therefore, there may be similar variations in the numbers of TGCs for
sale. This in turn will give rise to a high volatility of TGCs prices. Hence, potential
investors in green electricity capacity face a highly uncertain rate of return on their
investments and therefore require high expected rates of return to be willing to invest.
To some extent, however, the problem of price volatility may be resolved by the
introduction of permit banking (see Amundsen et al., 2006).
Another problem related to the TGC market is the potentially high market power that a
producer of green electricity may possess. The reason for this is that the percentage
requirement implies that one TGC counts for a multiple of MWh in consumption.
Hence, by withholding TGCs, a green producer may significantly reduce consumption
and increase the end-user price, even though the producer's own power generation is
not that large.
Along with the other potential problems discussed above, the problems revealed in this
paper clearly call for caution in the design and implementation of TGC systems, not
least when they are put into place on top of emission trading systems.
References
Amundsen, E.S. and J.B. Mortensen (2001): "The Danish green certificate system: Some
simple analytical results", Energy Economics, 23, 489–509.
Amundsen, E.S., F. M. Baldursson, and J.B. Mortensen (2006): "Price Volatility and Banking in Green Certificate Markets", Environmental and Resource Economics,35:259-287 (DOI 10.1007/s10640-006-9015-1.
Amundsen, E.S. and L. Bergman (2002)”Will Cross-Ownership Reestablish Market Power in
the Nordic Power Market”, The Energy Journal, 23 (2):73-95
Andersson, B and L. Bergman (1995): “Market Structure and the Price of Electricity: An ex
Ante Analysis of the Deregulated Swedish Electricity Market”, The Energy Journal, 16
(2): 97-109
Bergman, L. and M. Radetzki (2003): "Global klimatpolitik (Global climate policy)", SNS
Förlag, Stockholm.
Butler, L. and K. Neuhoff (2005): "Comparison of Feed in Tariff, Quota and Auction
Mechanisms to Support Wind Power Development", Cambridge Working Papers in
Bye, T. A. (2003): "On the price and volume effects from green certificates in the energy
market", Discussion paper 351/2003, Research Department, Statistics Norway.
European Commission (2003): "Greenhouse gas emissions trading: Commissioner Wallstrøm
hails final agreement on climate change breakthrough", Press Release IP/03/931.
EPA, (2003): “EPA Strategic plan: Direction for the future. U.S. Environmental Protection
Agency.”
EU/Commission, (2000): Directive of the European Parliament and of the council on the
promotion of electricity from renewable energy sources in the internal electricity
market. Com(2000) 279 final, Brussels.
Finon, D. and P. Menanteau (2003) "The Static and Dynamic Efficiency of Instruments of
Promotion of Renewables", Energy Studies Review, 12(1): 53–83.
Giovinetto, Anna, (2003). On the track of green certificates. Environmental Finance,
September 2003.
Jensen, S.G. and K. Skytte (2003): "Simultaneous Attainment of Energy Goals by Means of
Green Certificates and Emission Permits", Energy Policy, 31(1), 63–71.
Nese, G. (2003): "Essays in Liberalized Energy Markets", Doctoral dissertation, Department of
Economics, The University of Bergen.
Unger, T. and E.O. Ahlgren (2003): "Impacts of a common green certificate market on
electricity and carbon emission markets in the Nordic countries", Energy Policy,
33(16), 2152- 2163.
Appendix A
i) Proof of the effects of the emission permit price/emission tax as there is trade in electricity
only
To verify that dzA 0
dτ < and 0 B dz
dτ < , rearrange 10) to obtain:
( )
(
)
i i i i M i i
i
z z h q
x p
∂ ∂ + −
= 1 ( )
*
* α α
.
which upon differentiation gives:
A1)
2
2 (1 ) , ,
i i i i M
i i
i i
p dx h dz dq
i A B
x dτ α z dτ α dτ
∂ − ∂ = − =
From 7), we have zi =αixi. Therefore, we may write:
A2)
2 2
2 2
1 1 1 1
1 1
A A A M B B B
A B
A A A A B B B B
p h dz dq p h dz
x α z d d x α z d
α α τ τ α α τ
∂ ∂ ∂ ∂
− = = −
− ∂ ∂ − ∂ ∂ .
To prove the above claim by contradiction, assumedzA 0
dτ ≥ . Inspecting the signs of A2), we
see that this impliesdzB 0
dτ ≥ , 0 A dx
dτ ≥ , 0 B dx
dτ ≥ , and 0
M dq
dτ ≤ . From 9), we see
thatdqM 0
dτ ≤ implies 0 A dy
dτ < and 0 B dy
dτ < . Upon applying 7) and eliminatingmi, we find:
A3)
(
1)
A(
1)
B A BA B
dx dx dy dy
d d d d
α α
τ τ τ τ
− + − = + .
Inspection of the signs of A3) reveals that the left-hand side is nonnegative, whereas the
right-hand side is negative. Hence, there is a contradiction. Therefore, it follows that the generation
of green electricity and the consumption of electricity must fall in both countries. Furthermore,
from A3), it is apparent that the total generation of black electricity must be reduced, whereas
A2) makes it clear that the wholesale price of electricity will have to go up.
ii) Proof of the effects of the emission permit price/emission tax as there is trade in both
electricity and TGCs
To verify that dzA 0
dτ < and 0 B dz
dτ < first observe from 12) that:
A4) A B A B
A B
dx dx dz dz
d d d d
α α
τ + τ = τ + τ and
A5) (1 ) A (1 ) B A B
A B
dx dx dy dy
d d d d
α α
τ τ τ τ
− + − = + .
To prove the above claim by contradiction, assume that the generation of green electricity in
country A is not reduced; i.e. dzA 0
dτ ≥ . From 13), it follows that if one country does not reduce
green electricity generation, this implies that the other country will not reduce its green
change in qM +sM. From A4), we observe that this means that the consumption of electricity
in at least one of the countries must either increase or remain constant. Assume that country A
does not reduce its consumption of electricity; i.e., dxA 0
dτ ≥ Differentiating 15) in the same
way that we found A2), we find:
A6)
2 2
2 2
1 1
1 1
A A A A M B B B B
A B
A A A B B B
p dx h dz dq p dx h dz
x d α z d d x d α z d
α τ τ β α τ τ
∂ ∂ ∂ ∂
− = = −
− ∂ ∂ − ∂ ∂ .
As dzA 0
dτ ≥ and 0 A dx
dτ ≥ , we observe from A6) that 0 M dq
dτ ≤ , which implies 0 A dy
dτ < and
0
B dy
dτ < . Therefore, the right-hand side of A5) is negative, whereas the right-hand side of A4)
is nonnegative. For this to happen, we must have dxB 0
dτ < and in additionαA >αB. As we
have assumed that green electricity generation does not decline and we havedqM 0
dτ ≤ , it
follows thatdsM 0
dτ ≥ . From A2), we see that for green electricity generation to decrease in
country A, we must haveαA <αB. This contradicts thatαA >αB. Hence, the conclusion is
that green electricity generation will be reduced in both countries.
Appendix B: Some basic features of the partial equilibrium model
The model applied depicts the behavior of individual power producing firms on the Norwegian
– Swedish electricity market. In addition there is an independent grid operator that owns and
operates an inter-connector between the two countries. The flow of power across the national
border is constrained by transmission capacity. Each firm, fd has a country location, d and
operates a set of generating units, all located in the home country. Firms may be of different
sizes, and may have different “portfolios” of generating units. These are divided into three
categories, i j, andg. Category i consists of existing hydro-, existing nuclear- and existing
wind power plants. Category jconsists of condensing and combined heat (CHP) power plants
considered “black”, whereas gis considered “green”28. Quantities produced in
categoriesi, j,g and total quantity produced in firm fd are denoted
d
f i Y
d
f j Y
d
f g Z and
d
f X ,
respectively. Hence,
3 2 3
1 1 1
d d d d
f f i f j f g X =
∑
Y +∑
Y +∑
Z .Cost functions
For each given level of output the individual firm allocates production between the different
generating units in order to minimize cost. The solution of this cost minimization problem
defines the cost function of the individual firm. Hydro-, nuclear-, wind- and bio power plants
are assumed to be homogenous, i.e., for each type of plant the marginal cost is independent of
the level of capacity utilization and equal toci, (for existing hydro-, existing nuclear- and
existing wind power), and hg, (for new hydro-, new wind- and bio power). The total available
capacity in plants of typei, jand gin firm fdare denoted
d
f i K ,
d
f j K and
d
f g
K , respectively.
Condensing and CHP generating units are assumed to be heterogeneous (due to differing fuel
input and thermal efficiency). Heterogeneity is reflected in the marginal cost function of
condensing and CHP plants, respectively. These functions are written
d d
d
f j f j j j
f j
Y
C a b
K ρ
= +
Here, ajrepresents the marginal cost of the least expensive unit of type j , while
j j
a +b represents the marginal cost of operating the most expensive generating unit of type
j close to full capacity. Furthermore, ρ is a (positive) technological parameter. All
parameters are estimated on the basis of engineering data, whereas capacity data are obtained
from published reports.
The solution to the cost minimization problem is captured in the marginal cost function
denoted ( , , , )
d d d d d d
f f f f i f j f g
C =C X K K K . The function includes a tax on carbonemission and takes into account that the net cost of generating a unit of green electricity is equal tohg−sd , where sdis the TGC price.
28
Demand function
The demand for electricity by consumers in countryr,Er, depends only on the area price, Pr.
The price elasticity of demand in country r is denoted ηrand is assumed to be constant. Thus,
the inverse demand function for consumers in country rbecomes
1 0
0
( r) r
r r r
E
P P
E η
=
Where Pr0is the base year price and Er0the base year consumption in countryr.
Equilibrium on the electricity market
The spatial allocation of generation and consumption, in conjunction with inter-connector
capacity limitations29, makes it important to distinguish between the amount of electricity
generated and the amount of electricity supplied in different regions by a given firm. Letting Q
denote supply we thus have
d dr
f f
r
X =
∑
Q . The total supply of power in countryr, Qr isdefined by
d d
r f r
d f
Q =
∑ ∑
Q . In equilibrium it holds thatQr =Er. When the inter-connectorcapacity is not congested (or in autarky) there is a single equilibrium price, otherwise not.
Equilibrium on the TGC market
The demand for TGCs in country ris equal to αrEr where αris the percentage requirement.
The generation of TGCs by firm fd is equal to
d
f g
Z . Denoting supply of TGCs by
dr
f N we
have
d dr
f g f r
Z =
∑
N . The total supply of TGCs in countryr, Nr is definedby
d d
r f r
d f
N =
∑ ∑
N . In equilibrium it holds thatNr =αrEr. With a common TGC market, asingle TGC price,sris established, otherwise separate TGC prices are established.
29