http://dx.doi.org/10.4236/me.2015.610105
How to cite this paper: Chen, M.-C. and Yen, Y.-S. (2015) Determinants of Usage Intention of LINE Users in Taiwan. Modern Economy, 6, 1090-1100. http://dx.doi.org/10.4236/me.2015.610105
Determinants of Usage Intention of LINE
Users in Taiwan
Mei-Chun Chen1, Yung-Shen Yen2*
1Department of Information Management, Vanung University, Taiwan
2Department of Computer Science and Information Management, Providence University, Taiwan
Email: *[email protected]
Received 20 September 2015; accepted 24 October 2015; published 27 October 2015
Copyright © 2015 by authors and Scientific Research Publishing Inc.
This work is licensed under the Creative Commons Attribution International License (CC BY).
http://creativecommons.org/licenses/by/4.0/
Abstract
With the huge user base, LINE has become an important medium of mobile communications in the world. This study attempts to explore the factors influencing usage intention for LINE users. Drawing on the theory of planned behavior (TPB), this study adds three antecedents, including perceived enjoyment, perceived critical mass, and self-efficacy into the TPB model, and further examines the moderating effect of frequent users on the causal relationships. A structural equa-tion modeling is used and 458 LINE users in Taiwan are investigated. The results reveal that per-ceived enjoyment and perper-ceived critical mass are positively associated with behavioral attitude. Also, self-efficacy is positively associated with perceived behavioral control. Moreover, behavioral attitude, subjective norms, and perceived behavioral control are positively associated with usage intention, and the causal relationships are significantly varied between frequent and infrequent users.
Keywords
The Theory of Planned Behavior, Perceived Enjoyment, Perceived Critical Mass, Usage Intention, LINE
1. Introduction
Nowadays, people would like to connect mobile friends through social networking sites, such as LINE, WeChat, WhatsApp, Facebook, etc. In particular, LINE is one of the popular and heavily used by mobile users in the spe-cific countries, such as Japan, Chinese Taipei, Thailand, etc. In Taiwan, LINE user enrollment has 17 million, over the half of 23 million of Taiwan’s population [1]. With the huge user base, LINE has become an important
medium of mobile communications. Thus, the understanding of the factors influencing usage intention of LINE users is important for practitioners to manage the relationship with customers.
The theory of planned behavior (TPB), an extension of the theory of reasoned action (TRA), is a behavioral theory regarding the individual’s intention to perform a given behavior. Behavioral attitude, subjective norms, and perceived behavioral control are three determinants influencing intention and actual behavior [2]. Specifi-cally, subjective norms are similar to social influence, meaning that individuals adapt their attitudes and beha-viors to their social situations [3]. Perceived behavioral control affected by self-efficacy is the confidence in one’s ability to make a purchase decision [4]. Behavioral attitude refers to the way that individuals respond to and are disposed towards an object [5]. The antecedents of behavior attitude may be varied, depending on the service settings. For example, technology acceptance model posits that perceived ease of use and perceived use-fulness are two antecedents influencing behavior attitude. However, according to the characteristics of LINE service, it is assumed that perceived enjoyment and perceived critical mass are the key antecedents influencing usage intention because its mechanism is for social communication [6]. Moreover, the causal relationship of in-fluencing usage intention may be varied between frequent and infrequent users. Therefore, we may ask “How do the antecedents influence usage intention for LINE users?”, and “Is the causal relationship among the variables varied between frequent and infrequent users?”. The field has not yet provided direct investigation.
To fill the research gap, we investigate the behaviors of a selected group of LINE users in Taiwan. It thereby contributes a few significant theoretical results to the field: extending the previous understanding of the TPB model for LINE users; and formulating a research framework to explain the causal relationships for usage inten-tion across frequent and infrequent users. Moreover, it can also help practiinten-tioners to manage customer relainten-tion- relation-ships in context of LINE service.
[image:2.595.141.482.465.708.2]2. Research Framework and Hypotheses Development
Figure 1depicts the research framework of this study, in terms of the above arguments. According to the research framework, this study proposed:
H1: Perceived enjoyment is positively associated with behavioral attitude;
H2: Perceived critical mass is positively associated with behavioral attitude;
H3: Self-efficacy is positively associated with Perceived behavioral control;
H4: Behavioral attitude is positively associated with usage intention;
H5: Subject norms are positively associated with usage intention;
H7
H5(+) H2(+)
H1(+)
Moderators:Frequent users
H6(+) H4(+) Perceived
enjoyment
Usage intention Perceived critical
mass
Behavioral attitude
Subjective norm
Perceived behavioral control Self-efficacy
H3(+)
H6: Perceived behavioral control is positively associated with usage intention;
H7: The causal relationship among the variables is moderated by frequent users.
3. Research Method
3.1. The Instrument of the Study
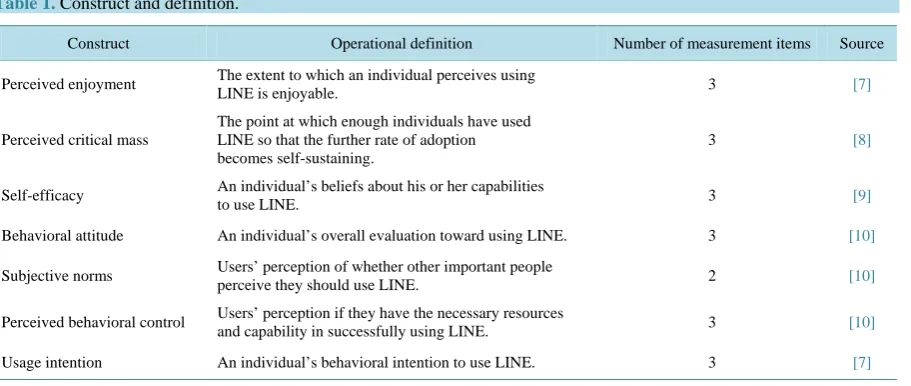
The design of the instrument is adopted from previous results in the literature with appropriate modifications for LINE users (e.g. terminologies). The scale of perceived enjoyment was revised from Moon and Kim [7], which includes three items. The scale of perceived critical mass was revised from Ellison et al. [8], which includes three items. The scale of self-efficacy was revised from George [9], which includes three items. The scales of behavioral attitude and subjective norms were revised from Taylor and Todd [10], which includes two items and three items respectively. The scale of usage intention was revised from Moon and Kim [7], which includes three items. All of the items were measured on a 7-point Likert-type scale, where possible answers ranged from strongly disagree (1) to strongly agree (7). The instrument of the study is shown in Table 1.
3.2. Subjects
The sample of this study is from Taiwan. The main reason is that LINE is up to a total of 230 million registered users in August 2013 [11]. In terms of the use proportion of population, Chinese Taipei obviously is the biggest country to use LINE in the world. Thus, it has representative to investigate the LINE users in Taiwan.
This study conducted an online survey. The questionnaire was translated by a language professional to ensure that the wording used in the Chinese and English versions were consistent. In the announcement, we declared the purpose of the study and the qualifications for participating in the survey. The respondents were informed that their responses are anonymous and only for academic purposes. The questionnaire was posted in the Google online survey system, which links to PTT (ptt.cc) website, the largest bulletin board system in Taiwan. The res-pondents who have the experience of LINE were invited to participate in the survey. To increase the sample re-turn rate, this study offered gifts to the respondents for increasing the participation to the survey.
The questionnaires were collected for one month. A total of 470 respondents were received, of which 12 cop-ies were deleted due to regular or incomplete data. The valid respondents totaled 458. The demography of the respondents is shown inTable 2. Females (52.8%) surpass males (47.2%). The largest age group is 40 - 49 years (32.3%), and the largest education group is undergraduate (62.2%). Regarding the frequency of using LINE in the past three months, most of the respondents use LINE every day or almost every day (36.5%).
[image:3.595.90.546.525.718.2]In addition, the measurement of frequent users in the study was revised from Johnson [12], which classified the frequent user group as the users who use the Internet a few times a week or every day or almost every day, and the infrequent user group as the users who never or rarely use the Internet. As thus, frequent users in this study totaled 270 (58.9%), whereas infrequent users totaled 113 (24.7%).
Table 1. Construct and definition.
Construct Operational definition Number of measurement items Source
Perceived enjoyment The extent to which an individual perceives using
LINE is enjoyable. 3 [7]
Perceived critical mass
The point at which enough individuals have used LINE so that the further rate of adoption becomes self-sustaining.
3 [8]
Self-efficacy An individual’s beliefs about his or her capabilities
to use LINE. 3 [9]
Behavioral attitude An individual’s overall evaluation toward using LINE. 3 [10]
Subjective norms Users’ perception of whether other important people
perceive they should use LINE. 2 [10]
Perceived behavioral control Users’ perception if they have the necessary resources
and capability in successfully using LINE. 3 [10]
3.3. Reliability and Validity Test
[image:4.595.114.539.409.714.2]This study employed Cronbach’s alpha (α) for examining the internal consistency of the constructs [13][14]. The α inTable 3indicates the reliability of the measurement constructs: perceived enjoyment is 0.92, perceived critical mass is 0.91, behavioral attitude is 0.90, subjective norms are 0.83, perceived behavioral control is 0.84, and usage intention is 0.95. These numbers satisfy the general requirements in the field (e.g. [13]) suggest a re-liability coefficient above 0.7, and Robert and Wortzel [14] want the number to be between 0.70 and 0.98. Therefore, we content that this study carried good reliability.
Table 2.Demography of the respondents.
Variables Items N Percent (%)
Gender Male
Female 216 242 47.2 52.8 Age
20 - 29 30 - 39 40 - 49 >49 117 131 148 62 25.5 28.6 32.3 13.6 Education
Senior high school Undergraduate Graduate 38 285 135 8.3 62.2 29.5
Frequency of using LINE in the past three months
Never Rarely A few times a month
A few times a week Every day or almost every day
42 71 75 103 167 9.2 15.5 16.4 22.4 36.5
Note:valid samples = 458.
Table 3.Model of research construct.
Construct and observable variable Mean (SD) SFL CR AVE α
Perceived enjoyment (PE) 0.92 0.80 0.92
PE1 4.16 (1.76) 0.84
PE2 4.31 (1.78) 0.96
PE3 4.45 (1.70) 0.88
Perceived critical mass (PCM) 0.91 0.78 0.91
PCM1 5.66 (1.45) 0.87
PCM2 5.67 (1.44) 0.91
PCM3 5.54 (1.39) 0.87
Behavioral attitude (ATT) 0.72 0.88 0.90
ATT1 5.40 (1.32) 0.89
ATT2 5.39 (1.38) 0.88
ATT3 5.28 (1.52) 0.77
Subjective norms (SN) 0.85 0.74 0.83
SN1 4.48 (1.65) 0.97
SN2 4.67 (1.72 0.73
Perceived behavioral control (PBC) 0.85 0.66 0.84
PBC1 5.33 (1.52) 0.64
PBC2 5.42 (1.48) 0.91
PBC3 5.76 (1.59) 0.86
Usage intention (UI) 0.94 0.85 0.95
UI1 5.44 (1.49) 0.91
UI2 5.39 (1.50) 0.96
Confirmation factor analysis (CFA) was performed for scale validity assessment [15]. Convergent validity was measured by average variance extracted (AVE) in each construct. The criterion of AVE should be greater than 0.5 [16]. The evidence showed in Table 3 reveals that all constructs were satisfied. Thus, this study pos-sessed adequate convergent validity.
Discriminate validity was also tested. The result shows that the AVE square root of each research variable is larger than the related coefficients of the variables, as shown in Table 4. This is a clear case of positive proof
[16]. Thus, this study had adequate discriminate validity.
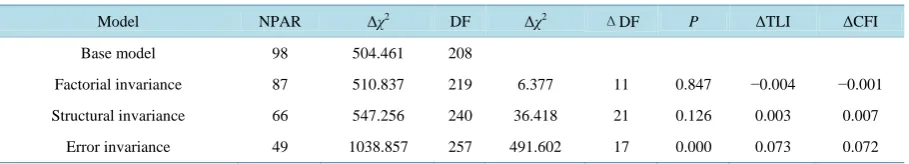
3.4. Measurement Invariance Tests
In order to compare the causal relationship of the variables between frequent and infrequent users, this study conducted multiple-group confirmatory factor analysis for testing measurement invariance across gender. The degree of invariance is frequently assessed by the differences in χ2 between the models [17]. If Δχ2 is not statis-tically significant, then the invariance exists. Table 5shows the results of measurement invariance tests. The evidence reveals that factorial invariance (i.e. same factor loadings across gender) and structural invariance (i.e. same factor loadings and factor covariance across gender) both are not significant between frequent and infre-quent users (Δχ2
(11) = 6.377, p > 0.05; Δχ2 (21) = 36.418, p > 0.05), but error invariance (i.e. same factor load-ings, factor covariance, and error variance across gender) is significant (Δχ2
(17) = 491.602, p < 0.05). This re-sult implies that factorial invariance model and structural invariant model are invariant, but error invariance model is non-variant. However, it is widely accepted that the test of error variance and their covariance represents an overly restrictive test of the data [18]. Thus, we believe that measurement invariance does exist in this study.
4. Analysis of Empirical Results
4.1. Verification of the Hypotheses
A structural equation modeling using AMOS 20.0 was conducted to test the postulated hypotheses. Figure 2 presented the estimation results. From the model fitness indexes, χ2 = 289.560, DF = 114, χ2/DF = 2.54, GFI = 0.938, AGFI = 0.913, CFI = 0.962, RMSEA = 0.067, showing the collected data fits the postulated model. The estimated structural coefficients were used to test each hypothesis. Results in Table 6 showed that the model explained 57.9%, 42.6% of the variance in behavioral attitude and perceived behavioral control, and 67.5% of
Table 4.Correlation between constructs.
Construct PE PCM ATT SN PBC UI
PE 0.89
PCM 0.37 0.88
ATT 0.29 0.56 0.94
SN 0.31 0.48 0.37 0.86
PBC 0.34 0.30 0.31 0.26 0.81
UI 0.42 0.45 0.63 0.43 0.46 0.92
[image:5.595.86.541.635.717.2]Note: Diagonal elements in boldface represent the square root of AVE.
Table 5.Results of measurement invariance tests.
Model NPAR Δχ2 DF Δχ2 ΔDF P ΔTLI ΔCFI
Base model 98 504.461 208
Factorial invariance 87 510.837 219 6.377 11 0.847 −0.004 −0.001
Structural invariance 66 547.256 240 36.418 21 0.126 0.003 0.007
0.436***
(R2=0.675)
0.226*** 0.138*** 0.535***
0.302*** Perceived
enjoyment
0.590****
Usage intention (R2=0.579)
Perceived critical
mass
Behavioral attitude
Significant path Subjective norm
Perceived
behavioral control Self-efficacy
[image:6.595.64.514.83.315.2](R2=0.426)
Figure 2.Results of structural modeling analysis. Note: ***means significant at the level of 0.001.
Table 6. Results of estimated structural coefficients.
Relationship Estimate SE CR P Result
H1. PE → ATT 0.302 0.038 7.857 *** Support
H2. PCM → ATT 0.535 0.047 11.312 *** Support
H3. SE → PBC 0.436 0.037 9.472 *** Support
H3. ATT → UI 0.590 0.040 14.650 *** Support
H4. SN → UI 0.138 0.036 3.881 *** Support
H5. PBC → UI 0.226 0.047 4.810 *** Support
Note: Estimate is unstandardized; *** means significant at the level of 0.001.
the variance in usage intention. All paths in the research model were statistically significant at the level of 0.001. Perceived enjoyment and perceived critical mass are positively associated with behavioral attitude (Estimate = 0.302, SE = 0.038, CR = 7.857, p < 0.001; Estimate = 0.535, SE = 0.047, CR = 11.312, p < 0.001). Self-efficacy is positively associated with perceived behavioral control (Estimate = 0.436, SE = 0.037, CR = 9.472, p < 0.001). Moreover, behavioral attitude, subjective norms, and perceived behavioral control are positively associated with usage intention (Estimate = 0.590, SE = 0.040, CR = 14.650, p < 0.001; Estimate = 0.138, SE = 0.036, CR = 3.881, p < 0.001; Estimate = 0.226, SE = 0.047, CR = 4.810, p < 0.001). Thus, H1, H2, H3, H4, H5, and H6 are supported.
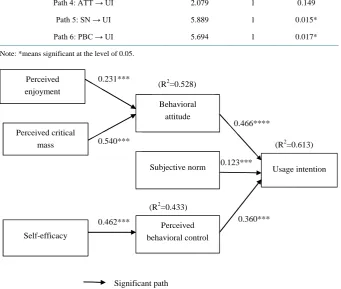
Multiple group structural equation modeling was conducted to test the differences of the causal relationships across two groups. Yang and Lee [19] suggested that significant differences in two groups were determined by using a χ2 difference test. As thus,Table 7 showed that full constrained model with limited the same path coef-ficients between frequent users and infrequent users is significant (Δχ2
/6 = 12.262, p = 0.031). In addition, the path between subjective norms and usage intention, and the path between perceived behavioral control and usage intention all are significant (Δχ2
[image:6.595.89.541.355.478.2]Table 7. The moderating effect of frequent users.
Path χ2 DF P
Full constrained model 12.262 6 0.031*
Path 1: PE → ATT 2.683 1 0.101
Path 2: PCM → ATT 2.081 1 0.138
Path 3: SE → PBC 1.653 1 0.225
Path 4: ATT → UI 2.079 1 0.149
Path 5: SN → UI 5.889 1 0.015*
Path 6: PBC → UI 5.694 1 0.017*
Note: *means significant at the level of 0.05.
0.462***
(R2=0.613)
0.360*** 0.123*** 0.540***
0.231*** Perceived enjoyment
0.466****
Usage intention (R2=0.528)
Perceived critical mass
Behavioral attitude
Subjective norm
Perceived behavioral control Self-efficacy
Significant path
(R2=0.613)
0.123*** 0.540***
0.231*** Perceived
enjoyment
0.466****
Usage intention (R2=0.528)
Perceived critical mass
Behavioral
attitude
Subjective norm
Perceived behavioral control Self-efficacy
(R2=0.433)
Figure 3.Results of structural modeling analysis for frequent users. Note: *** means signif-icant at the level of 0.001.
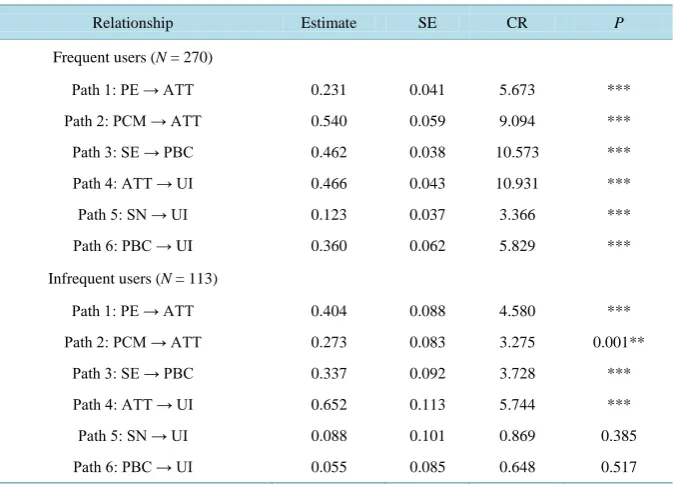
= 0.360, SE = 0.062, CR = 5.829, p < 0.001), but insignificant for infrequent users (Estimate = 0.088, SE = 0.101, CR = 0.869, p = 0.385; Estimate = 0.055, SE = 0.085, CR = 0.648, p = 0.517), as shown in Table 8. Thus, H7 is supported.
4.2. Discussion
0.337***
Significant path Non-significant path
(R2=0.607)
0.055 0.088 0.273**
0.404*** Perceived
enjoyment
0.652****
Usage intention (R2=0.514)
Perceived critical mass
Behavioral attitude
Subjective norm
Perceived behavioral control Self-efficacy
[image:8.595.141.484.83.343.2](R2=0.402)
Figure 4.Results of structural modeling analysis for infrequent users. Note: **means signif-icant at the level of 0.01; ***means signifsignif-icant at the level of 0.001.
Table 8. Results of coefficients between frequent users and infrequent users.
Relationship Estimate SE CR P
Frequent users (N = 270)
Path 1: PE → ATT 0.231 0.041 5.673 ***
Path 2: PCM → ATT 0.540 0.059 9.094 ***
Path 3: SE → PBC 0.462 0.038 10.573 *** Path 4: ATT → UI 0.466 0.043 10.931 ***
Path 5: SN → UI 0.123 0.037 3.366 ***
Path 6: PBC → UI 0.360 0.062 5.829 ***
Infrequent users (N = 113)
Path 1: PE → ATT 0.404 0.088 4.580 ***
Path 2: PCM → ATT 0.273 0.083 3.275 0.001**
Path 3: SE → PBC 0.337 0.092 3.728 ***
Path 4: ATT → UI 0.652 0.113 5.744 ***
Path 5: SN → UI 0.088 0.101 0.869 0.385 Path 6: PBC → UI 0.055 0.085 0.648 0.517
Note: Estimate is unstandardized; **means significant at the level of 0.01; ***means significant at the level of 0.001.
[image:8.595.146.484.396.638.2]Second, this study also finds that the effect of behavioral attitude on usage intention (Estimate = 0.590) is stronger than the effects of subjective norms and perceived behavioral control (Estimate = 0.138; Estimate = 0.226). This finding implies that behavioral attitude is a major determinant influencing usage intention for LINE users. The possible reason is that users may likely enjoy the communication with many friends to enhance usage intention in LINE service, followed by the effects of perceived behavioral control and subjective norms.
Third, interestingly, this study found that the causal relationship is varied between frequent and infrequent ers. In particular, the intention is only influenced by behavioral attitude for infrequent users, but for frequent us-ers, usage intention is affected by behavioral attitude, subjective norms and perceived behavioral control. The possible reason is that users who are infrequent use of LINE service may lack of interactive targets and the abil-ity of self-efficacy to user the services. Thus, they may passively use the services when some people “line” them.
5. Conclusions
In conclusion, the findings of the study provided both theoretical and practical benefits. From a theoretical pers-pective, this study affirmed the effects of perceived enjoyment, perceived critical mass, and self-efficacy on the relationships of the TPB model. We verified that attitudinal beliefs regarding perceived enjoyment and per-ceived critical mass, as well as subjective norms and perper-ceived behavioral control influenced usage intention in LINE service. Therefore, this study advanced the previous understanding of usage intention in the context of LINE service.
From a practical perspective, this study suggested that practitioners should provide the effective communica-tion tools for helping users to establish the relacommunica-tionships with their friends. They needed to design the funny stickers for users to increase the enjoyment with friends in LINE service. With respect to perceived critical mass, practitioners shall promote LINE service in the countries that people who was the less or never use of LINE ser-vice. In terms of infrequent users, practitioners shall encourage users to invite their friends to participate in the mobile community, as well as bring forth the self-efficacy in LINE service.
Along with these important findings, this study had some limitations. First, bias might exist due to the sam-pling taken through an online survey on a specific website. Second, the research model used in this study was intentionally simplified. The constructs in the proposed model accounted for only approximately 67.5% of the variance of usage intention, indicating that some of the important predictors might be missing. Excepting for in-ternal and exin-ternal motivations, security of personal data might be important to influence the use of LINE. Thus, subsequent studies might add security as a control variable in the model to further enhance the variance of usage intention in LINE service. Third, this study used a cross-sectional data to analyze the causal relationships for usage intention in LINE service. The results would only be inferred rather than proven [21]. Thus, subsequent studies might conduct a longitudinal approach to identify the dynamic change of the relationships in the TPB model.
References
[1] Tsao, W.Y. (2014) Enhancing Competitive Advantages: The Contribution of Mediator and Moderator on Stickiness in the LINE. Journal of Retailing and Consumer Services, 21, 933-941. http://dx.doi.org/10.1016/j.jretconser.2014.08.011
[2] Ajzen, I. (1991) The Theory of Planned Behavior. Organizational Behavior and Human Decision Processes, 50, 179- 211. http://dx.doi.org/10.1016/0749-5978(91)90020-T
[3] Salancik, G.R. and Pfeffer, J. (1978) Social Information-Processing Approach to Job Attitudes and Task Design. Ad-ministrative Science Quarterly, 23, 224-253. http://dx.doi.org/10.2307/2392563
[4] Bandura, A. (1986) Social Foundations of Thought and Action. Prentice-Hall, Englewood Cliffs.
[5] Teo, T. and Lee, C.B. (2010) Explaining the Intention to Use Technology among Student Teachers: An Application of the Theory of Planned. Campus-Wide Information Systems, 27, 60-67. http://dx.doi.org/10.1108/10650741011033035
[6] Ball, P. (2004) Critical Mass: How One Thing Leads to Another. Farrar, Straus and Giroux.
[7] Moon, J.-W. and Kim, Y.-G. (2001) Extending the TAM for a World-Wide-Web Context. Information & Management,
38, 217-230. http://dx.doi.org/10.1016/S0378-7206(00)00061-6
[8] Ellison, N., Steinfield, C. and Lampe, C. (2006) Spatially Bounded Online Social Networks and Socialcapital: The Role of Facebook. The Annual Conference of the International Communication Association, 36, 1-37.
http://dx.doi.org/10.1108/10662240410542634
[10] Taylor, S. and Todd, P.A. (1995) Understanding Information Technology Usage: A Test of Competing Models. Infor-mation Systems Research, 6, 144-176. http://dx.doi.org/10.1287/isre.6.2.144
[11] Millward, S. (2013) Line Reveals latest User Numbers in Japan, Thailand, Chinese Taipei, Indonesia.
https://www.techinasia.com/line-user-numbers-thailand-indonesia-japan-taiwan-august-2013/
[12] Johnson, G.M. (2008) Cognitive Processing Differences between Frequent and Infrequent Internet Users. Computers in Human Behavior, 24, 2094-2106. http://dx.doi.org/10.1016/j.chb.2007.10.001
[13] Nunnally, J.C. (1978) Psychometric Theory. 2nd Edition, McGraw-Hill, New York.
[14] Robert, M.L. and Wortzel, L.H. (1979) New Life-Style Determinants of Women’s Food Shopping Behavior. Journal of Marketing, 43, 28-39. http://dx.doi.org/10.2307/1250144
[15] Anderson, J. and Gerbing, D.W. (1988) Structural Equation Modeling in Practice: A Review and Recommended Two-Step Approach. Psychological Bulletin, 103, 411-423. http://dx.doi.org/10.1037/0033-2909.103.3.411
[16] Fornell, C. and Larcker, D.F. (1981) Evaluating Structural Equations with Unobservable Variables and Measurement error. Journal of Marketing Research, 18, 39-50. http://dx.doi.org/10.2307/3151312
[17] Cheung, G.W. and Rensvold, R.B. (2002) Evaluating Goodness-of-Fit Indexes for Testing Measurement Invariance. Structural Equation Modeling: A Multidisciplinary Journal, 9, 233-255.
http://dx.doi.org/10.1207/S15328007SEM0902_5
[18] Byrne, B.M. (2010) Structural Equation Modeling with AMOS. Routledge, New York.
[19] Yang, K. and Lee, H.-J. (2010) Gender Differences in Using Mobile Data Services: Utilitarian and Hedonic Value Ap-proaches. Journal of Research in Interactive Marketing, 4, 142-156. http://dx.doi.org/10.1108/17505931011051678
[20] Maddux, J.E. (1995) Self-Efficacy, Adaptation, and Adjustment: Theory, Research, and Application. Plenum Press, New York. http://dx.doi.org/10.1007/978-1-4419-6868-5
[21] Fang, Y.-H., Chiu, C.-M. and Wang, E.T.G. (2011) Understanding Customers’ Satisfaction and Repurchase Inten-tions—An Integration of IS Success Model, Trust, and Justice. Internet Research, 21, 479-503.
Appendix 1. The Instrument of the Study
Perceived enjoyment (PE) (adapted from [7]) PE1: Using LINE gives enjoyment to me; PE2: Using LINE gives fun to me; PE3: Using LINE keeps me happy.
Perceived critical mass (PCM) (adapted from [8]) PCM1: Many people I communicated with use LINE;
PCM2: Among the people I communicated with regularly, many use LINE; PCM3: The people I communicated with will continue to use LINE in the future.
Self-efficacy (SE) (adapted from [9])
SE1: I would feel comfortable using LINE on my own; SE2: If I wanted to, I could easily use LINE on my own;
SE3: I would be able to use LINE even if there was no one around to show me how to is.
Behavioral attitude (ATT) (adapted from [10]) ATT1: Using LINE is a good idea;
ATT2: I like using LINE;
ATT3: Using LINE is a wise idea.
Subjective norms (SN) (adapted from [10])
SN1: People who are important to me think that I should use LINE; SN2: People who influence me think that I should use LINE.
Perceived behavioral control (PBC) (adapted from [10]) PBC1: Using LINE is entirely within my control;
PBC2: I have the knowledge and ability to use LINE; PBC3: I am able to skillfully use LINE.