http://dx.doi.org/10.4236/ajac.2015.613096
How to cite this paper: Gao, X., Guo, T.T., Han, F., Tian, Y. and Zhang, Z.H. (2015) Rheological and Sensory Properties of Four Kinds of Dark Chocolates. American Journal of Analytical Chemistry, 6, 1010-1018.
http://dx.doi.org/10.4236/ajac.2015.613096
Rheological and Sensory Properties of
Four Kinds of Dark Chocolates
Xin Gao, Tongtong Guo, Fei Han, Yu Tian, Zhaohui Zhang
*College of Food Science and Engineering, Ocean University of China, Qingdao, China
Received 7 November 2015; accepted 8 December 2015; published 11 December 2015
Copyright © 2015 by authors and Scientific Research Publishing Inc.
This work is licensed under the Creative Commons Attribution International License (CC BY). http://creativecommons.org/licenses/by/4.0/
Abstract
The rheological properties of four kinds of chocolates (Dove, Leconte, Toblerone and Cote Dor) are determined by the rheometer of MCR101. The result shows that the melt samples have shear thin-ning behavior and thixotropic. The chocolates’ viscosities decrease with temperature increasing. The flow of melt chocolates follows Casson equation. The whole tanδ of chocolate is greater than 1, which indicates that the viscous composition is more than the elastic elements. The stress of Dove and Leconte changes rapidly compared with that of Toblerone and Cote Dor. Dove and Leconte have higher yield stress and anti-deformation ability than Toblerone and Cote Dor. The tanδ of Toblerone and Cote Dor is higher than that of the other two chocolates. This result shows that Toblerone and Cote Dor have a higher proportion of sticky ingredients. By the sensory properties, Dove and Leconte have higher overall acceptability.
Keywords
Chocolates, Rheological Properties, Viscosity, Storage Modulus, Loss Modulus, tanδ
1. Introduction
Chocolate is a complex rheological system with solid particles such as cocoa, milk and sugar dispersed in cocoa butter [1]. Chocolates are divided into three kinds (milk, dark and white) according to the composition of cocoa solids, milk fat and cocoa butter [2]. Dark chocolate has no milk, little sugar fat content and high cocoa solids. Although annual consumption of chocolate in central Europe (approximately 10 kg/head) [3] did not change significantly in the past years, there is a continuous and increasing trend towards high-priced dark chocolate and delicacies without milk solids and a high cocoa content. For processed food the composition and the addition of ingredients to obtain a certain food quality and product performance require profound rheological understanding
of individual ingredients related to food processing, and final perception [4]. The mouth feel can be influenced by the texture of product. The consumer evaluates the food quality (fresh, stale, tender and ripe) according to the physical sensations (hard, soft, crisp, moist and dry) of the food produced in the mouth [5]-[7]. Chocolate’s consumption is closely associated with rheological properties. Therefore the controlling of chocolate’s rheolog-ical properties is important.
Rheological properties of chocolate are important in manufacturing process for obtaining high-quality prod-ucts with well-defined texture [8]. Chocolates with high viscosity have a pasty feel, persisting in the mouth [9]. As viscosity relates to composition, processing strategy and particle size distribution [10], the rheological beha-vior is affected by the composition of chocolate samples such as fat, nonfat cocoa solids and sugar content [11]. One study of note was conducted in 2013 by Glicerina et al.[12]. Frequency sweep tests of chocolate were car-ried out. However, these researches lack comprehensive study of rheological properties of chocolate such as frequency sweep and temperature sweep. This might be due to the fact that current methods can’t capture the detailed rheological properties.
This article comprehensively studies the composition of four kinds of dark chocolates. The rheological prop-erties such as shear stress, effects of temperature on viscosity, flow curves, frequency sweep, temperature sweep time dependent behavior and sensory evaluation are also investigated. The aim of this research is to demonstrate the different rheological and sensory properties between Dove, Leconte and Toblerone, Cote Dor.
2. Materials and Methods
The following four brands of dark chocolates were purchased from JUSCO Supermarket in Qingdao, China. They were preserved in refrigerator at 4˚C. Before the test, the chocolates were placed in the container and then were placed in 70˚C hot water to be heated. The melted chocolates were placed in the rheometer for 5 min to keep a rest before shearing. The commercial chocolates were used to guarantee the repeatability and standardi-zation [13]. The four dark chocolates used are as following:
1) Dove: The dark chocolate of Dove was manufactured by MARS Food Corporation in American, produced in China.
2) Leconte: The dark chocolate of Leconte was manufactured by Zhong Liang Food Corporation in China. 3) Toblerone: Toblerone of Switzerland was produced in France.
4) Cote Dor: The dark chocolate of Cote Dor Noir Brut 70% was produced in Belgium.
2.1. The Composition of Chocolates Samples
The soluble solid contents of the chocolates samples are determined by using a refractometer, while the moisture content of the chocolates samples are measured by drying the samples in a oven at 105˚C. The ash contents are determined in a muffle furnace at 600˚C.
2.2. Rheological Measurements
Rheological properties of the four chocolates are measured using MCR101 (Austria) rheometer with parallel plate measurement system. The diameter is 50 mm. The rheological measurements include steady-state rheology analysis, effects of temperature on viscosity and dynamic rheological experiment. Three replicates are carried out in the experiments.
2.2.1. Steady-State Rheology Analysis
The flow curves of the four chocolate samples are studied at 25˚C, the shear rate increases linearly from 0.1 to 150 s−1. The steady-state relationship between shear stress and shear rate of food materials is expressed in terms of Casson equation:
1 2 1 2 1 2
0 a
τ =τ +η ε (1)
where, τ0 is Casson yield value (Pa),τ is shear stress (Pa), ηais viscosity (Pa∙s), ε is shear rate (s−1).
2.2.2. Effect of Temperature on Viscosity
( )
0
Ea RT
e
η η
= (2)where, η0 is the frequency factor (Pa∙sn), Ea represents the activation energy (kJ/mol), R is the gas law constant
(R = 8.314 J/mol∙K), and T is the absolute temperature (K). The flow activation energy is calculated using the Arrhenius-type equation.
2.2.3. The Dynamic Rheological Experiment
The viscoelastic properties of food are determined by the dynamic rheological experiment. G' is storage mod-ulus expressing the elastic of food, loss modmod-ulus G" expresses the viscous of food. The experiment is performed at least in triplicate. Loss tangent tanδ= G"/G'.
2.3. Sensory Evaluation
Double blind are used to reduce errors. The evaluated indexes include taste, color, texture, odor and overall ac-ceptability of the four chocolate samples. In summary, 12 subjects (6 males and 6 females), with an age range between 21 and 35 years (mean age: 24 years) participated in the study. Before evaluating, the stored chocolates at 4˚C are placed for 1 hour at room temperature. Each piece of chocolate for sensory evaluation weight 10 g. The samples are assessed by nine-full-mark criterion (9 = like extremely, 8 = like very much, 7 = like mod-erately, 6 = like slightly, 5 = neither like nor dislike, 4 = dislike slightly, 3 = dislike modmod-erately, 2 = dislike very much, 1 = dislike extremely) [14].
2.4. Data Analysis
The experiment data are analyzed by using SPSS software. The difference analysis is used with the S-N-K me-thod. The different Lowercase letters indicates significant differences between the same column (P < 0.05). The parameters of each equation are obtained by linear regression using SPSS software.
3. Results and Discussion
3.1. The Composition of Chocolate Samples
The main compositions of the four chocolate samples are shown in Table 1. It can be seen from Table 1, the four samples all have low moisture content, the reason may be that water molecules can hydrate with the colloid of other materials in chocolate. After water swells, the materials become sticky which make it harder to process chocolate. Leconte not only has low fat content, but also has lower moisture content and ash content than the others. Compared with Dove and Leconte, Toblerone and Cote Dor have higher fat content because westerners prefer high-calorie and high-fat food.
3.2. Steady-State Rheology Analysis
The steady flow curves of the four molten chocolates are shown in Figure 1. The four samples all have yield stress. The stress increases linearly as the shear rate increases. So the flow of molten chocolates belong Bing-ham’s model [15]. The stress of Dove and Leconte changes rapidly compared with those of Toblerone and Cote Dor.
[image:3.595.89.538.624.710.2]The experimental values of the shear stress and the shear rate are fitted with Casson equation, τ1 2 =τ01 2+η εa 1 2. Casson model is the official method for interpretation of flow data on chocolates. The Casson yield stress
Table 1. Main composition of chocolate samples.
Samples Moisture content (%) Ash content (%) Fat content (%)
Dove 0.60 ± 0.06a 2.00 ± 0.01b 36.54 ± 1.10a
Leconte 0.35 ± 0.05b 1.62 ± 0.03c 39.75 ± 0.20a
Toblerone 0.55 ± 0.01a 3.22 ± 0.16a 50.70 ± 0.50a
Cote Dor 0.57 ± 0.00a 1.75 ± 0.05c 53.26 ± 0.96a
is calculated as the square of the intercept. However, yield stress calculated by this method isn’t the actual value [10]. The rheological parameters τ0 of four molten chocolates are calculated and shown in Table 2. Dove and
Leconte have higher yield stress, while Toblerone and Cote Dor have lower yield stress. This result means that Dove and Leconte need to overcome higher stress before they can flow.
The relationship between temperature and viscosity of the chocolates samples is shown in Figure 2. The temperature dependence of chocolates is well described by Arrhenius relationship
η η
= 0e(Ea RT). The flow ac-tivation energy (Ea) is calculated by the equation logη = logη0 + Ea/RT. Ea and R2 are showed in Table 3. The [image:4.595.88.536.221.294.2]flow activation energies of the chocolate samples are almost same. Because the sensitivity of viscosity to tem-perature (SVT) is proportional to the flow activation energies, the four molten chocolates have same SVT.
Table 2. Casson’s equation parameters of chocolate samples.
τ0/Pa R2
Dove 38.50 0.9991
Leconte 29.35 0.9978
Toblerone 3.22 0.9994
[image:4.595.146.537.271.712.2]Cote Dor 1.91 0.9990
Table 3. Arrhenius relationship parameters of chocolate samples.
Dove Leconte Toblerone Cote Dor
Ea (K∙J∙mol−1) 24.99 23.17 24.49 —
[image:4.595.94.539.311.519.2]R2 0.9947 0.9775 0.9929 —
Figure 1. Changes of the shear stress with the shear rate increasing of chocolate samples.
[image:4.595.186.525.539.706.2]The viscosity of the chocolate samples decreases with close rate as the temperature increased. The viscosities of Toblerone and Cote Dor chocolates are lower than Dove and Leconte chocolates at the same temperature. The reason may be the imported chocolates have higher fat content. As the material of Chocolate is a kind of disper-sion system, the viscosity of chocolate depends on the ratio of the dispersed phase and the dispersing medium [16]. Generally, the viscosity of chocolate will increase obviously if the fat content bellows a certain limit.
Molten chocolate is a suspension with sugar, cocoa and other solid particles in the continuous fat phase. Dif-ferent from Newtonian flow, molten chocolate contains solid particles and has the properties of non-Newtonian flow. It is shown in Figure 3 that melt samples exhibit shear thinning behavior and thixotropic. The hysteresis loop shows that the structure of chocolate will be damaged after shearing occurs. The hysteresis area which represents the size of thixotropic is the area between two curves [17]. When the shear rate is same, the viscosity of Dove and Leconte are higher than that of Toblerone and Cote Dor. The viscosity of chocolate depends on cocoa butter content at a certain temperature range. The increasing of cocoa butter can cause viscosity decrease. Toblerone and Cote Dor have low viscosity because they contain rich cocoa butter.
3.3. Dynamic Measurement Analysis
The region that complex modulus G* does not vary with the oscillation changes is called linear viscoelastic re-gion (LVR) [18]. 3% strain at is used to determine the rheological properties of chocolate samples.
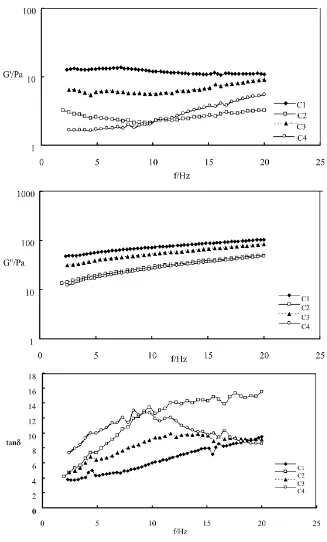
It is shown in Figure 4 that the frequency sweeps at 37˚C. Storage modulus G' and loss modulus G" increase gradually with the increase of frequency. At the same frequency, the value of G' is higher than that of G". This result shows that the chocolate samples have more elastic than viscous. The elastic of the chocolate suspension is determined by the degree of particles network structure’s deformation recovery. G' reflects not only the ability of elastic deformation recovery but also the value of the elastic potential energy [19]. The small value of G' in-dicates that the network structure of chocolate is difficult to be formed. Loss factor, tanδ = G"/G', is a dimension less value that compares the amount of energy lost during a test cycle to the amount of energy stored during the same time. As shown in Figure 4, that the value of tanδ for the chocolate samples is more than 1, which shows that the chocolate samples have a larger proportion of sticky ingredients.
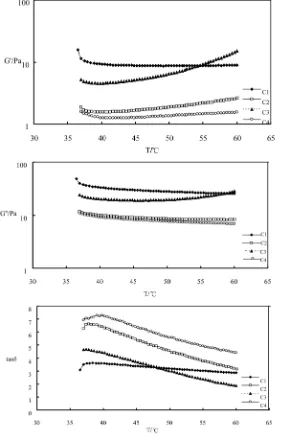
Figure 5 shows the variation of storage modulus G' and loss modulus G" with temperature. It can be seen that as the temperature increases, the value of G' increases while that of G" decreases. And the value of tanδ for the molten chocolates also decreases. The tanδ of Toblerone and Cote Dor are higher than that of Dove and Le-conte, which shows that Toblerone and Cote Dor have higher proportion of sticky ingredients than Dove and Leconte.
[image:5.595.154.473.513.705.2]When time increases, the complex modulus G* is basically unchanged, this result shows the samples have good stability (Figure 6). The complex modulus G*s of Dove and Leconte are higher than those of Toblerone and Cote Dor, which show Dove and Leconte chocolates have higher anti-deformation ability.
Figure 4. Frequency sweep (G', G", G*) of four chocolates samples at 37˚C.
3.4. Sensory Evaluation
Figure 5. Temperature sweep (G', G", G*) of different chocolate samples.
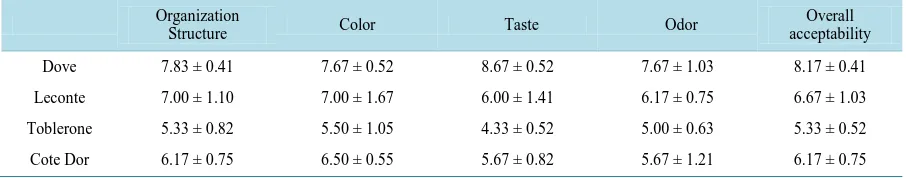
[image:7.595.176.447.554.704.2]Table 4. Sensory evaluation of the chocolate samples.
Organization
Structure Color Taste Odor
Overall acceptability
Dove 7.83 ± 0.41 7.67 ± 0.52 8.67 ± 0.52 7.67 ± 1.03 8.17 ± 0.41
Leconte 7.00 ± 1.10 7.00 ± 1.67 6.00 ± 1.41 6.17 ± 0.75 6.67 ± 1.03
Toblerone 5.33 ± 0.82 5.50 ± 1.05 4.33 ± 0.52 5.00 ± 0.63 5.33 ± 0.52
Cote Dor 6.17 ± 0.75 6.50 ± 0.55 5.67 ± 0.82 5.67 ± 1.21 6.17 ± 0.75
4. Conclusions
The present work evaluates the dynamic and steady-state shear rheological properties of chocolates. The ob-tained data can be used in chocolate processing and storage. The four chocolate samples all exhibit pseudo plas-tic and thixotropic property. The pseudo plasplas-ticity and yield stress of Dove and Leconte chocolates are higher than Toblerone and Cote Dor. The four chocolates are all fit for Casson equation. The flow activation energies of Dove, Toblerone and Leconte are 24.99, 24.49 and 23.17 kJ/mol, respectively. This result indicates that these four molten chocolates have same sensitivity of viscosity to temperature.
The viscosity of the chocolate sample decreases as the temperature of the chocolate increases. According to the oscillatory test data, the value of tanδ for the chocolate samples is greater than 1, which shows that the choc-olate samples have a larger proportion of sticky ingredients.
Acknowledgements
This work was supported by the National Natural Science Foundation of China (No. 31571865, 31272705) and Qingdao Science and Technology Project (2011-5-028-QT).
References
[1] Pajin, B., Dokic, L., Zaric, D., Šoronja-Simovic, D., Loncarevic, I. and Nikolic, I. (2013) Crystallization and Rheolog-ical Properties of Soya Milk Chocolate Produced in a Ball Mill. Journal of Food Engineering, 114, 70-74.
http://dx.doi.org/10.1016/j.jfoodeng.2012.06.024
[2] Fernandes, V.A., Müller, A.J. and Sandoval, A.J. (2013) Thermal, Structural and Rheological Characteristics of Dark Chocolate with Different Compositions. Journal of Food Engineering, 116, 97-108.
http://dx.doi.org/10.1016/j.jfoodeng.2012.12.002
[3] Alberts, H.C. and Cidell, J.L. (2006) Chocolate Consumption, Manufacturing and Quality in Western Europe and the United States. Geography, 91, 218-226.
[4] Glicerina, V., Balestra, F., Rosa, M.D. and Romani, S. (2014) Effect of Manufacturing Process on the Microstructural and Rheological Properties of Milk Chocolate. Journal of Food Engineering, 145, 45-50.
http://dx.doi.org/10.1016/j.jfoodeng.2014.06.039
[5] Szczesniak, A.S. (1963) Objective Measurement of Food Texture. Food Science, 28, 410-420. http://dx.doi.org/10.1111/j.1365-2621.1963.tb00219.x
[6] Kokini, J.L. and Cussler, E.L. (1987) The Psycho Physics of Fluid Texture. In: Moskowitz, H.R., Ed., Food Texture, Marcel Dekker, New York.
[7] Kokini, J.L. and Plutchok, G.J. (1987) Viscoelastic Properties of Semisolid Foods and Their Biopolymers Components.
Food Technology, 41, 89-95.
[8] Servais, C., Ranc, H. and Roberts, I.D. (2004) Determination of Chocolate Viscosity. Journal of Texture Studies, 34, 467-497. http://dx.doi.org/10.1111/j.1745-4603.2003.tb01077.x
[9] Beckett, S.T. (2000) The Science of Chocolate. Royal Society of Chemistry Paperbacks.
[10] Rao, M.A. (2014) Rheological Behavior of Processed Fluid and Semisolid Foods. In: Rheology of Fluid, Semisolid,
and Solid Foods (pp. 231-330). Springer, US. http://dx.doi.org/10.1007/978-1-4614-9230-6_5
[11] Fernandes, V.A., Müller, A.J. and Sandoval, A.J. (2013) Thermal, Structural and Rheological Characteristics of Dark Chocolate with Different Compositions. Journal of Food Engineering, 116, 97-108.
http://dx.doi.org/10.1016/j.jfoodeng.2012.12.002
Dark Chocolate during Process. Journal of Food Engineering, 119, 173-179. http://dx.doi.org/10.1016/j.jfoodeng.2013.05.012
[13] Augusto, P.E.D., Falguera, V., Cristianini, M., et al. (2012) Rheological Behavior of Tomato Juice: Steady-State Shear and Time-Dependent Modeling. Food and Bioprocess Technology, 5, 1715-1723.
http://dx.doi.org/10.1007/s11947-010-0472-8
[14] Gao, X., Yu, T., Zhang, Z.H., Xu, J.C. and Fu, X.T. (2011) Rheological and Sensory Properties of Four Kinds of Jams.
Journal of Stored Products and Postharvest Research, 2, 227-234.
[15] Paterson, A. (2009) Comparison of Rheological Models for Determining Dark Chocolate Viscosity. International Journal of Food Science and Technology, 44, 162-167. http://dx.doi.org/10.1111/j.1365-2621.2008.01710.x
[16] Afoakwa, E., Paterson, A., et al. (2007) Factors Influencing Rheological and Textural Qualities in Chocolate: A Re-view. Trends in Food Science & Technology, 18, 290-298. http://dx.doi.org/10.1016/j.tifs.2007.02.002
[17] Koilparambil, S.G. and Bhattacharya, S. (2014) Fermentation of Blackgram Paste: Time-Dependent Rheological Cha-racteristics, Modelling and Quality Attributes of a Traditional Snack. International Journal of Food Science and Tech-nology, 49, 2214-2222. http://dx.doi.org/10.1111/ijfs.12534
[18] Graef, V., Depypere, F., et al. (2011) Chocolate Yield Stress as Measured by Oscillatory Rheology. Food Research In-ternational, 5, 6-11.
[19] Ahmed, J. and Ramaswamy, H.S. (2006) Viscoelastic Properties of Sweet Potato Puree Infant Food. Journal of Food Engineering, 74, 376-382. http://dx.doi.org/10.1016/j.jfoodeng.2005.03.010