Network Pattern Analysis based Vulnerability
Measurement using Attack Graph Hierarchical
Visualization Approach
Abhishek Pipliya
PG Scholar, Computer Science & Engineering, Oriental University, Indore, India
Sachin Chirgaiya
Asst. Professor, Computer Science & Engineering, Oriental University, Indore, India
ABSTRACT
Network is growing very fast in terms of their users, technologies and devices integrated together for delivering the demanded communication services effectively. Such process requires lots of policies and configurations arrangements to improve availability and reliability of data. Most of the times these changes are performing the desired action but sometime the action or event is uncertain which let the systems performance down. These uncertain affects are due to sudden attack occurrence and cause degradations in service. These attacks are prevented using forecasting process by which attack pattern and impact are analysed. It is known as vulnerability assessment and attack removal. Larger is the data more accurate will be the attack patters detection from the data. Existing approaches and tools generates the weak and delayed output without any forecasted behaviours. This paper proposes a novel model NPA-VM approach for network vulnerability assessment using attack graphs and network metrics. The approach is capable of achieving its goal in real time. At the preliminary level of evaluation, proposed method is showing its strong holds in the area of attacks predictions.
Keywords
Network, Security Situation Awareness, Vulnerability Assessment, Attack Graphs, Configuration and Security Metrics, Forecasting, NPA-VM (Network Pattern Analysis Based Vulnerability Measurement).
1.
INTRODUCTION
In the modern world the computer technologies and solution categories are varying frequently and provided with numerous changes for accessing the user owned data. The way of getting the content by correct process is termed as secure authentication and is useful for various areas such as banking, transportation, military, communication and emergency services. These sectors are having abrupt growth in number of users desiring those services with newer technologies and networking devices. Thus to make the operation secure in such heavy interaction between the users and devices is a critical task. The outside attackers are trying to break the security constraints for acquiring the complete control without any permission. Thus probability of attack occurrence on such random changing environments of network is more as compare to normal network. Some attack resistant services needs to be designed on the basis of which trust of security can be increased on the systems. Attacks can be of insider or outsider might be known or unknown, try to destroy the actual process or triggered some uncontrolled actions, anything which is undesired and planned to affect the actual working of the system is taken as attacks.
Attack resistant system is required to increase the reliability over the system and provides the high availability of data to end user. To prevent the system from the affections of attack events a prevention scheme should be designed after analysis of the system’s basic characteristics. Attacks are always applied n a fixed structure following similar pattern always for same category of attacks. Although various security tools such as firewalls and intrusion detection systems have been deployed in the detection and prevention of attacks, these security tools often generate huge reports as well as numerous false positives and false negatives [1]. Thus if this pattern is analyzed and identified their prevention mechanisms can be designed. In a network attack can be formed by various devices such as system, node, router, switches, software’s, protocols, interrupts, firewalls, servers etc. For proper identification of attack and its pre-emption mechanism the basic functionalities, operations, transformation, activities and characteristics of these systems needs to be monitored. The current focus is on qualitative aspects rather than a quantitative study of network security [2]. If the devices are deviating from their actual working properties then it must be showing the attack initiations and might affects some of the correctly working systems. Thus it needs to be analyzed before taking certain decisions of shutting or rebooting these devices.
Following the above critical issue of security the network analyst develops a mechanism for allotting a attack occurrences probability value to each device and software from which it is measured that on which end the attack is more desired to affects. These analysts perform effective monitoring of each network component to identify the unusual behavior for measuring the attack occurrences probability which is named as situational awareness. Existing network measurement tools is not having such functionalities and they only visualize the network patterns. Network security situational awareness and intimation mechanism fetches the current conditions, configurations with respect to a system having ideal conditions and gives the responses in terms of changes which make the functionalities and performance of system down. For this the process uses a generalize creation of attack graph in which the devices and components are placed in tree hierarchical structure for showing the most and least vulnerability by a specific values.
2.
BACKGROUND
Situational awareness is applied in distinguishing the discrete characteristics and behaviour of network to analyse the event which makes the attack pattern identification accurate and in real time. The method fetches various types of information from the network and applied them on some static and dynamic measurement scales. Measurement scales are based on metrics used to transform the network specific formats to some user readable data for analysis and assessment process. It is used for criticality classification, asset relationship changes discovery and location findings in various areas such as IT infrastructure, military, emergency; etc which depends upon the needs of the system [4]. There is a need to design some process and specialized components and placed them at different points on network by which effective analysis can be performed which gives precise and accurate information for real time detection of attacks.
The existing solution to these dynamic issues of change tracking is applied through various metrics creation and measurement operations sing quantitative assessments rather than some qualitative values. This predicting information is operated in terms of objects, space used and time required to perform an operation. There are various data oriented metrics is suggested over the last few years which are achieving their goals and standardizing the identification process. Network situation assessment involves multi-structure process which includes following operations:
(i) Vulnerability Calculation Using Design Identification (ii) Active Response Measurement
(iii) Attack Interconnectivity and dependencies modifications analysis [5]
(iv) Threat mapping and evaluation (v) Positive and negative change detections
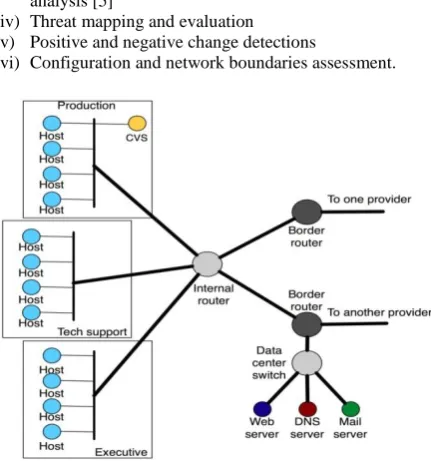
[image:2.595.57.273.411.642.2](vi) Configuration and network boundaries assessment.
Fig 1: Sample End Topology Devices and Host Arrangements for Situation Awareness
All the above information can be evaluated from different networking devices and software’s which generates a massive amount of data as shown in figure 1. This data needs to be processed after transferring the values to desired formats and inputs states of metrics from which some decisions is taken. Larger are the values more accurate will be assessment always. Moreover the vulnerability analysis metrics are continuously expanding their capabilities by supporting the
wide variety of applicability. It aims towards accurate and quantitative assessment for timely measurement of faults generating locations and attacks identity [6]. Network assessment regarding capacity may specify network capacity and its capability to provide certain interactions services orientations in promiscuous environment. Occasionally reflection of development and change that indicates structural modifications applied for network planning’s and needs. Situation understanding concerning data security comprises information with reference to threats targeting the networks and services points [7].
Network assessment must contain the overall operational details of communications and changes applied to measure and provide security and risk handling process. Normally, its representation includes all the parameters in quantifiable and measurable manner for less complex and timely detections. They have to be considered as a reference point which allows the admiration of the systems quality points. This term is very often used to describe the concepts of metric, measure, score, rating, rank or assessment. But for the most important objective of the information security metrics is being developed and specify a useful decision support reporting security system. Thus this work presents a novel model for effective and real time analysis of existing network components behavior to take a decision of vulnerability of attack according to their ran and impacts.
3.
LITERATURE SURVEY
As after the study of several articles and papers related to situational assessment for network in real time various authors had worked to make the process improved. Among them few are representing their approach which is in affect related with the suggested study are taken here as a survey for this work. These are:
In the paper [8], security metrics based network situational awareness method is been suggested to facilitate the decision making. It is been applied form improvement of existing configuration by detecting the changes in type of data and behaviour of devices. The approach is collecting various records and processed them for reporting the relevant performance factors using quantitative approach. The methods are also capable of controlling the operation by using some additional parameters of adequacy analysis of security process improvements. Some of approach also suggests passive mechanisms based monitoring tools for studying the network requirements and named as Panemoto (Passive Network Monitoring Tool) [9]. The implemented tool measures the frequently updating characteristics using connections detection and representing the structure in a graph view. Some real example of tools output is taken in which the network information is presented in two distinct but related formats: as a clickable network diagram and as statically linked HTML pages, viewable in any standard web browser. Simultaneously, a technique enables a quite effective implementation of improved assessment process.
The construction measures the behaviour of existing attacks and the generating nodes for accurate evaluation through common attack graph generator. It uses various security metrics for providing accurate risk analysis during attack modeling security component (AMSEC) executions phase. The paper also presents an prototype model for result evaluation.
In the paper [12], an analytical intrusion detection framework (AIDF) using probabilistic determination theory is proposed. The approach is formed by tow basic steps; a probability model discovery approach, and probabilistic inference mechanism for generating the most probable attack occurrence factors. The concepts are practically implemented using an open source tool Snort for network data simulations and analysis.Later on some more analysis based tools are given such as SiLK [13]. The tool is highly-scalable low-data capture and analysis system applied in the area of network forensics, worm behaviour, vulnerability exploits, identifying artefacts of intrusions etc. Some other related visualization tools and their structured analysis is given in [14]. These are NVisionIP and VisFlowConnect-IP used for large volume complex data transparently to system administrators in simple intuitive visual interfaces that support human cognitive processes required to take the vulnerability decisions. The tools are effective in their visualization orientations and also the generated data analysis is very effective and applies time saving approaches. The visualization makes the user easily understand the actual view of network. NVisionIP and VisFlowConnect-IP can be used individually or in unison for correlating events. This work is distinguished from others in that these are the first Internet security visualization tools to be freely available on the Internet and deployed in large production environments.
Multi visualization design is been proposed over the last few years to enhance the ability of an administrator to detect and investigate anomalous traffic between a local network and external domains. Central to the design is a parallel axes view which displays Net Flow [16] records as links between two machines or domains while employing a variety of visual cues to assist the user. The tools have several filtering options that can be employed to hide uninteresting or innocuous traffic such that the user can focus his or her attention on the more unusual network flows. Such effective designing resolves various runtime configuration and management issues through real time administrative controls.
The precise and real-time forecast of network protection situation is the foundation and basis of prevent intrusions and attack in a extensive network. In categorization to expect the security condition more accurately, a quantitative calculation method of complex security condition based on Wavelet Neural Network with Genetic Algorithm (GAWNN) is proposed in [17]. After analysing the past and the recent network security condition in detail, it builds a network security situation prediction model based on wavelet neural network that is optimized by the improved genetic algorithm and then adopt GAWNN to predict the non-linear time series of network security situation. After analysing various simulation experiments it proves that the proposed method has advantages over Wavelet Neural Network (WNN) method and Back Propagation Neural Network (BPNN) method with the same architecture in convergence speed, functional approximation and prediction accuracy.
4.
PROBLEM STATEMENT
Network security situational awareness is a data analysis based approach requires a massive processing of information. It varies according to different devices, their transformations and integrations in the network. The aim is to increase the data availability by making the system more robust and reliable. In such scenarios, information processing is based on fusion of network factors and parameters which is used to make the preventive assessment of situation [18]. Aim is to detect the unusual patterns and from this predict the future affects of the attacks on mentioned devices. After studying the various existing approach in the different areas of network used for predictions and forecasting, this work had identify that analyst have to know the patterns in a restricted manner and the detection is totally based on logical capabilities of few of those. Thus some automation is required for better understanding of vulnerabilities and affects of attacks. Here are the some identified issues in existing approaches for resolving the issues of vulnerability analysis.
Problem 1:
All the existing system will consider vulnerability in a qualitative aspect rather than some quantitative aspects which mislead the analyst’s.Problem 2:
Real time measurement is not given by which losses are comparatively larger than others.Problem 3:
Massive data processing some time generates false alarm and incorrect predictions thus prediction accuracy needs to be considered as primary parameters for the work.Problem 4: The assessment used to classify network state
and the level of information required for optimal illustration is not complete always which misguide the prediction. Thus transformation of such information with certain attributes is not provided by any of the existing mechanism.All of the above mentioned issues are few of the many by which recommendation accuracy is not achieved. Thus this paper proposes a novel NPA-VM approach for further improvements over prediction accuracy and regular monitoring. The approach initially fetches the data, let it transformed to desired format, generates the graphs showing attack occurrences and finally forecast the behaviour which is more accurate and comes in real time.
5.
PROPOSED FBU-NDA APPROACH
This paper proposes a novel mechanism NPA-VM (Network Pattern Analysis Based Vulnerability Measurement) for effective quantitative analysis of various network situation. This can be taken as core component in network security situational awareness (NSSA) work in presence of which the data fetching and their processing is not compromised by the kind of changes occurring in the network. The work aims to identify the changes for detection of certain unusual behaviours which is been strictly followed by attack previously. Detection is not feasible in single or double data entries. For these thousands of records needs to be processed this evaluates the values on the basis of various metrics used for data transformations. These records and the generated data from different devices will show the misleading configuration information and exchanges. The work aims to identify the information required for measuring and assessing the probability of occurrence of attack on certain specific devices.
factor and must be monitored continuously. Network is a big working environment made from collection of various devices, protocols, servers and host parallel generating thousands of records per unit time. Processing of such huge amount of data is a complicated task and requires more efforts in terms of time and cost. Thus, this paper provides an alternative way of handling security by vulnerability assessment. According to the approach, network components are analyzed on their previous activities and changes accommodated. These factors should be permitted or rejected accordingly to their probability of attack vulnerable values called as assessment values.
Higher be the generated value larges be the attack occurrence probability and smaller be the value less probable to attack. Representation of component for this network pattern analysis based vulnerability measurement is given by attack graph. There are some benefits of using the metrics in this work given here as:
1) Improved performance and protection level of the system 2) Monitoring model which compares the current values with ideal values after which validation of operations and changes is measured.
Contribute to the enhancement of the existing security practices and to the integration of information security to its business processes values;
Description of the Approach
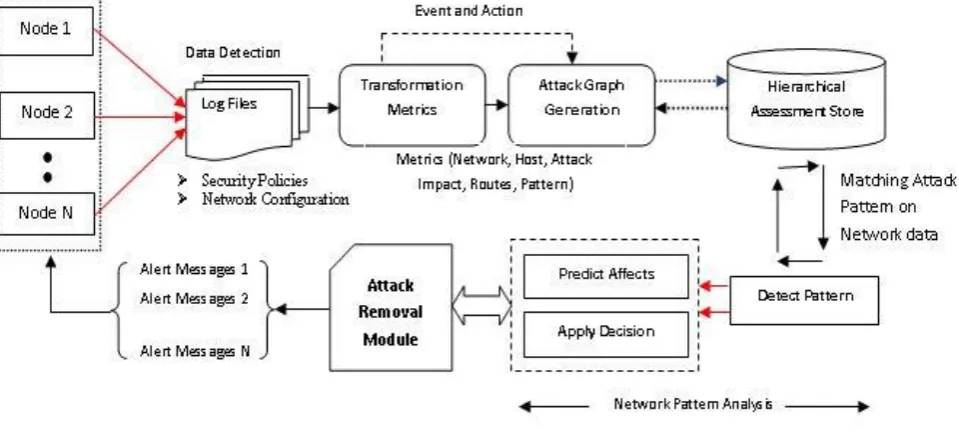
The proposed approach shown in figure 2 will works in three basic modules based on their functionalities given below as:
Module 1: Data Fetching and Visualization Module
Initially the node or network component performs regular operation or functionality whose final product for the suggested approach is data. The components regularly generate a data in a specific format taken in log files. This log will work as data fetching module. Mainly the log contains
two categorical data: Security Policies and Network Configurations which is used to detect the deflections from desired conditions. This data is tool generated and is different from different tool and need to be structured in a given format which justify the use of metrics fro transformations. This work takes the input in five categories of metrics: Network, Host, Attack Impact, Routes and Specific Patterns. It expresses the value on behalf qualitative evaluation (risk analysis) and converts them to certain quantitative measurement. From this different values attack graph is generated to visualize the attack impact probability and the values are stored onto a databases.
Module 2: Analysis Module
After the data is stored on to a databases the previously stored ideal conditions of system configurations and policies are matched with the newly generated patterns.
If the things are matched then the working is marked to be correct. And if the deviation is founded then its percent will be calculated and arranged in a higher to lower hierarchical structure for vulnerability assessment. Thus an attack graph created from the suggested metrics is going to calculate the types of response and action identification. Later on this response and actions is extracted as a utility entry and stored in vulnerability assessment database store. This store is used as a data access repository for the next step of assessment of network situations.
Module 3: Attack Prediction, Alert and Removal:
[image:4.595.58.538.470.686.2]This module works as a decision making process which includes the prediction of attack vulnerability on a specific device. The prediction shows that the attack pattern is completely matched by previously stored values and its impact is analysed. According to identified data the decision should be taken to inform the other nodes, by an alert message.
Fig 1: An Efficient Network Pattern Analysis Based Vulnerability Measurement (NPA-VM)
Thus by the above process it is measured analytically that the attack vulnerability will be detected more accurately in real time. Here the security situation of current communication and networked operations are analysed on the basis of previous participations and vulnerability measurement. For
Alerting mechanism will make the system updated about this attack occurrence and forecast their behaviours in near future by which their defending mechanism can be drafted. Evaluation of work on some preliminary analytical parameters will shows that the approach is proving its strong presence in terms of effective and accurate detection of uncertain conditions.
Application Areas
Most of these systems use flow traffic to provide network security situation information. Application of these mechanisms is as follows:
(i) Immune Network Security Situation Awareness Technology
(ii) Situation Forecast
(iii) Analytical Intrusion Detection Framework (AIDF)
6.
EXPECTED OUTCOMES
Situational awareness technique is used to measure eth behaviours of various networked components which create a boundary between the actual working and desired operations. If the working is deviated from the desired then it is assumed that some unwanted operations are performed on them by which attack probability and occurrence is confirmed. So an attack removal strategy is applied in near future on these resources. The system should have the ability to handle the data coming from different resources and makes certain process of transforming these records to desired format for pattern matching. It is having a wide variety of devices generating logs such as network configuration, vulnerabilities, system logs, network security device alerts, network traffic and so many others. Later on these records are processed and analysed to forecast the attack vulnerability. There are a number of system tools currently used in the field of network security situation awareness, such as NVisionIP and VisFlowConnect-IP. The expected benefits of these systems can be given as:
Better Security analysis process;
Easy adaptation of network configuration and security guidelines
Attacker activities and purpose analysis
Information grouping for network situation-awareness
Achieving self-awareness for network policy
Active and passive attack detection
Transmission intrusion detection
Deep Packet Inspection.
7.
CONCLUSION
Security is the basic requirement for today’s world whose aim is to make the system robust against the attacks. This can be achieved if the attack nature is completely analyses and predict the probability of striking those on to a specific device or network. It could be a kind of forecasting nature and can be generated by analysis of previous participation of devises and their changes. Due to horizontal and vertical growth in terms of networked devices and number of users such calculation is getting complex because of its massive data size. Network security vulnerability analysis is used to show the attack occurrence probability for any network. During the last few years various approaches is been proposed but not satisfying the user’s needs in terms of accuracy and performances. This
paper proposes a novel mechanism for network security situational assessment by network pattern analysis based vulnerability measurement (NPA-VM). The approach is using several metrics for data transformation which later on converts to decisions for attack behaviour and vulnerability predictions. At the initial level of work the suggested mechanism is proving its strong presence to its competitors.
8.
FUTURE WORK
Some problems and concepts that remain unaddressed might be solved in future. Such as some more metrics and vulnerability tools integration can simultaneously works as most effective component. The authors are also planning evaluate the tool and lets its open ended issues release for further research in the same domain.
9.
ACKNOWLEDGEMENT
The authors wish to acknowledge college administration for their support & motivation during this research. The authors would also like to thank anonymous referees for their many helpful comments.
10.
REFERENCES
[1] Rongrong Xi, Shuyuan Jin, Xiaochun Yun and Yongzheng Zhang, “CNSSA: A Comprehensive Network Security Situation Awareness System”, in International Joint Conference of IEEE TrustCom, ISSN: 978-0-7695-4600-1/11, doi: 10.1109/TrustCom.2011.62, 2011.
[2] Wang, C. Yao, A. Singhal and S. Jajodia, “Network Security Analysis Using Attack Graphs :Interactive Analysis of Attack Graphs using Relational Queries”, in proceedings of IFIP WG Working Conference on Data and Application Security (DBSEC), 11.3 pages 119-132, 2006.
[3] Mr. Marc Grégoire and Mr. Luc Beaudoin, “Visualisation for Network Situational Awareness in Computer Network Defence”, in proceedings of visualisation and the common operational picture meeting RTO-MP-IST-043, Paper 20. 2008.
[4] White Paper on, “Public Safety and Homeland Security Situational Awareness”, in ESRI, February 2008.
[5] P. Barford, M. Dacier, T. G. Dietterich, M. Fredrikson, “Cyber SA: Situational Awareness”, in Cyber Defense University of Wisconsin, 2009.
[6] Rostyslav Barabanov, Stewart Kowalski and Louise Yngström, “Information Security Metrics”, DSV Report series No 11-007, Mar 25, 2011
[7] Lingyu Wang, Tania Islam, Tao Long, Anoop Singhal, and Sushil Jajodia, “An Attack Graph-Based Probabilistic Security Metric”, in National Institute of Standards and Technology Computer Security Division; Concordia Institute for Information Systems Engineering, Montreal, Canada.
[8] Marianne Swanson, Nadya Bartol, John Sabato, Joan Hash, and Laurie Graffo, “Security Metrics Guide for Information Technology Systems”, in NIST Special Publication 800-55, July 2003.
Workshop on Information Assurance United States Military Academy, Proceedings of the IEEE, 2007.
[10]Rongzhen FAN, Mingkuai ZHOU, “Network Security Awareness and Tracking Method by GT”, in Journal of Computational Information Systems, Binary Information Press, and ISSN: 1043-1050, Vol. 9: Issue 3, 2013.
[11]Igor Kotenko and Andrew Chechulim, “Attack Modelling and Security Evaluation in SIEM System”, in International Transaction of System Science and Application, SIWN Press,, ISSN:2051-5642, Vol. 8, Dec 2012.
[12]Bon K. Sy, “Integrating intrusion alert information to aid forensic explanation: An analytical intrusion detection framework for distributive IDS”, in Elsevier Journal of Information Fusion, ISSN: 1566-2535, doi:10.1016/j.inffus.2009.01.001, 2009.
[13]Timothy Shimeall, Sidney Faber, Markus DeShon and Andrew Kompanek, “Using SiLK for Network Traffic Analysis”, in CERT R Network Situational Awareness Group, Carnegie Mellon University. September 2010.
[14]William Yurcik, “Visualizing NetFlows for Security at Line Speed: The SIFT Tool Suite”, in 19th Large
Installation System Administration Conference (LISA ’05), 2005.
[15] Xiaoxin Yin, William Yurcik and Michael Treaster, “VisFlowConnect: NetFlow Visualizations of Link Relationships for Security Situational Awareness”, in ACM, doi: 1-58113-974-8/04/0010, Oct 2004.
[16] Xiaoxin Yin, William Yurcik and Adam Slagell, “The Design of VisFlowConnect-IP: a Link Analysis System for IP Security”, in National Center for Advanced Secure Systems Research (NCASSR), 2010.
[17] Ji-Bao Lai, Hui-Qiang Wang, Xiao-Wu Liu and Ying Liang, “WNN-Based Network Security Situation Quantitative Prediction Method and Its Optimization”, in Journal of computer science and technology, Vol. 23, Issue 3, ISSN: 0222:0230, Mar 2008.