Cell Lineage Construction of Neural Progenitor Cells
N.Jayalakshmi
Professor, Department of computer Applications, Saveetha Engineering College, Thandalam,
Chennai, India
ABSTRACT
This study aims at automatic construction of cell lineage from time-lapse images of progenitor cells. In order to construct the cell lineage it is very useful to have an efficient cell tracking system. In this paper we have described a system for tracking neural progenitor cells in a sequence of images using multiple matching object method based on modified mahalanobis algorithm. This system produces the results including the position, shape, motility and ancestry of each cell in every frame, which helps in construction of cell lineage. The proposed method has been implemented to the sequence of image frames and the computational results of cell tracking are presented.
General Terms
Pattern Recognition, Image processing & Bioinformatics.
Keywords
Cell lineage, mapping, image segmentation, progenitor cell, tracking
1.
INTRODUCTION
Any cellular organism development starts from single cell. This cell divides into two cells and each of them divides into two and so on. The relationship of parent cells and their daughter cells is called cell lineage. Cell lineage helps to understand the behaviour of the cell, which in turn helps in understanding the tissue formation and in cell therapies. To find the cell behaviour over time, the cells are to be recorded in time-lapse images and then they have to be tracked.
Tracking refers to the process of identifying and linking segmented cells from frame to frame in the image sequence to obtain cell trajectories. The simplest approach is to associate each cell in any frame to the spatially nearest cell in the next frame within a predefined range. When dealing with many cells or rapid cell movements, this may lead to mismatches. In order to get better result, the definition of 'nearest' may be extended to include similarity in intensity, area, and perimeter or surface area, orientation of major and minor axis and other features [1].
This paper starts with image preprocessing using morphological techniques to remove non-uniform illumination effects. The cells are located using h-maxima transformation after removal of the blob-like objects, which does not belong to a cell. Then the individual cells in a cluster are segmented using watershed algorithm. This paper has adopted modified Mahalanobis algorithm for tracking the cells. The results of the tracking process help in construction of cell lineage, which in turn helps the researchers in identifying the stem cells with high quality to be suitable for experimental studies and therapeutic treatments.
2.
BACKGROUND
Medical researchers believe that stem cell therapy has the potential to change the treatment of human disease and reduce suffering [2]. They started using technologies derived from
adult and embryonic stem cell research to treat Cancer, Parkinson's disease, Huntington's disease, cardiac failure, muscle damage, neurological disorders and many others [3]. In stem cell treatments, the study says that the possible risk is that transplanted stem cells could form tumors and have the possibility of becoming cancerous, if cell division goes out of control [4]. So, it is understood that the study of cell lineage of stem/progenitor cells is essential before it is used for treatment. Many basic methods [5,6,7] for watching cells behaviour, are used to understand the tissue formation and how they are changed due to disease. These studies used manual lineage construction in which cells are treated by an observer and followed as they migrate, divide, differentiate, die and move out of the field.
Filtering in spatial domain performed in a controlled manner decreases the effect of noise on images. The non-uniform illumination present in the microscopic images is removed using homomorphic filter [8], anisotropic diffusion method [9], least square technique [10], Ridgelet transform method [11] and Gaussian filter [12]. L.B. Dorini et al [13] and Cecilia Di Ruberto et al [14] have suggested morphological operators for blood cell segmentation, which is adopted in this paper.
The difficulty of medical image segmentation has forced very specific segmentation algorithms for each task or image being analyzed [15] [16]. Kittler et al [17], Otsu et al [18] and Wu et al [19] used thresholding methods. Markiewicz et al [20] have used watershed for segmentation of the bone marrow cells. This segmentation algorithm has produced over-segmentation due to intensity variations within both object and background [21]. Comaniciu et al [22] proposed a mean shift method for cell image segmentation for diagnostic pathology. Geusebroek et al [23] introduced a method based on nearest neighbor graphs to segment the cell clusters. Meas-Yedid et al [24] proposed a method to quantify the deformation of cells using snakes (curve around the object). Degerman et al [10] and Ryoma Bise et al [25] used dynamic programming to segment the cells. Tscherepanow et al [26] and Ilker Ersoy et al. [27] adopted active contour and multi-feature level set methods respectively. Watershed segmentation is adopted in this paper by overcoming the over segmentation problem by region merging.
microscopic images of 'Swiss Webster mouse' at embryonic day 'E10-E12'. The tissue consisting of 95% single cells is processed and collected for plating. Plated cells are placed under an Olympus inverted microscope in a humidified chamber at 35oC with 6% CO2. Phase images were captured by CCD camera and recorded with a time-lapse video cassette recorder. There are three image sequences chosen for this study. Each one contains hundreds of image frames. For example, the sequence-1 contains a total of 700 frames and the size of each image is 480 X 640 pixels, and the depth of each pixel is 8 bits. Twelve progenitor cells are present in the first frame, which have divided into 42 cells by the last frame 65 hours later [35].
3.1 Preprocessing
Mathematical morphology [19] is well suited to biological and medical image analysis. This system uses morphological techniques for shape analysis and filtering. Mathematical morphology is a non-linear process that operates the image with a sub image called morphological structuring element [36]. The morphological operations realized in this study are
from a morphologically closed version of the image. The top hat and bottom hat filtering together enhances the image well. It is implemented by subtracting the bottom hat from the addition of top hat with the original image. The original image frame and the enhanced image are shown in Figure 1(a) and 1(b).
3.2 Cell Detection
The possible cell locations called seed points, in an image are found using extended h-maxima transform method [38]. The h-maxima transform suppresses all maxima whose height compared to the surrounding pixels are smaller than a given threshold h. The seed is expected to have the intensity above h, so that small and faint objects are eliminated [38]. A low h has shown the result with many seeds and a high h has left some cells without seeding. The value of h that has given satisfactory results is selected by visual inspection on some test data and is kept fixed for all the images. Fig. 2 shows the result of extended h-maxima transformation for different h values, where a low h value marks the low intensity objects as cells and high h value makes cell clusters.
( a) (b)
Figure1. Image Enhancement (a) Original Image (b) Enhanced image using morphological operators
Since the original image has many local maxima, there are numerous regions not belonging to a cell. Fixing the parameter for the cell size through trial and error method has eliminated the regions not belonging to a cell. All seeds are uniquely labeled by standard connected component labeling. The extended h-maxima binary image in Fig. 3(a) shows the places where the cells exist. Fig. 3(b) shows the centroid points of the regions on the original image [39].
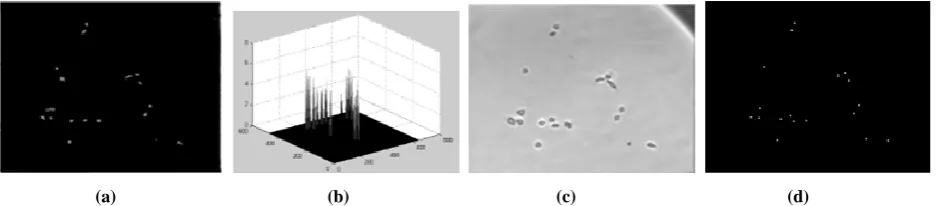
3.3 Cell Segmentation
Segmentation is the process of isolating objects in the image from the background. The distance-transformed image where the intensity of each object pixel corresponds to the distance to the nearest background pixel is taken as the input to watershed algorithm in order to divide the image into set of meaningful regions. The distance image and its landscape representation are shown in Fig. 4(a) and 4(b).The general idea is to consider the image as a topographic surface and the magnitudes of the pixels
are treated as valleys and mountains. It is assumed that there is a hole in each minima and the entire surface is submerged in water. To avoid the water from two different minima to meet a dam is built in between. These dams are the segmentation lines between the regions.
(a) (b) (c) (d)
Figure 2. Extended h-maxima transformation (a) Original Image (b) extended h-maxima transform with h =20
(c) extended h-maxima transform with h =30 (d) extended h-maxima transform with h =5.
[image:3.595.122.450.223.354.2]
(a) (b)
Figure 3. Cell Detection using extended h-maxima transform (a) Extended h-maxima transform (b) Centroids of
extended h-maxima regions marked as dots on the original image.
(a) (b) (c) (d)
Figure 4. Watershed Segmentation (a) Distance transformed image (b) The distance from each object to the imagebackground is displayed as height in landscape (c) Watershed ridges (d) Positions of detected cells after merging over
segmented cells
4.
CELL TRACKING
In the sequence of time-lapse microscopic images we have observed the appearance of new cells. There are different reasons for this and that has been recognized and dealt in our tracking process. The main reason is that there can be a biological cell division or the cells can be moved into the scene from outside. Cell splits are of biological interest and therefore some efforts have been made to identify when the cell split has occurred. This has been found by comparing the characteristics of consecutive images before and after the split occurred.
Different features of the segmented cells are computed and used for associating the cells between images. For each cell in image at time t, we compute the centroid, major and minor axis length, eccentricity and orientation. Area of the cell is not taken into consideration because when the cell splits the area of the parent cell is approximately equivalent to the addition of daughter cells area. This creates problem in cell mapping between images. The features of the cells are
collected and stored in a vector.
4.1 Cell Mapping
The distance measure for features is of critical importance for all kinds of classification methods. The Mahalanobis distance shows good performance for segmented images. Therefore the Mahalanobis distance is used as the basis for our distance metric. The modified Mahalanobis distance between the cells labelled as p in frame t with feature vector fpt and q in frame t+1 with feature vector fqt+1 with covariance S is found using
[image:3.595.56.525.393.496.2]
two-As a result of cell split, two daughter cells in image t+1 have one parent cell in image t. To find whether the new cell p of image t+1 has come from cell division, the distance is calculated between p and the other cells with the minimum expected difference between siblings. If any of the cells satisfy the condition for sibling distance and it is not mapped with any of the cell in the previous frame, it is considered as the sibling of p. Then the siblings are mapped with the parent cell in frame t. The mapping of individual cells in two consecutive images and also the splitting of cell 9 into 9.1 and 9.2 are shown in Fig. 5.
5.
RESULTS AND DISCUSSION
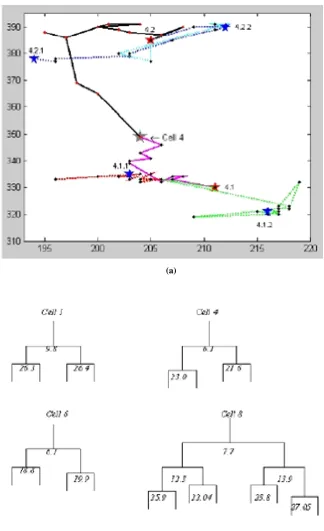
An evaluation of performance of detecting cell position using extended h-maxima transform and then segmenting the cells using watershed algorithms is analyzed and found 96% of cells are correctly located with 3.7% of false positive and 5% of false negative. When false negative cell of image t is identified in image t+1, it is considered as a new cell. This creates problem in tracking. The successful application of the system has created a complete trace of a single neural progenitor cell. It is observed that cell 4 divides into two cells 4.1 and 4.2. After some time 4.1 and 4.2 divide into 4.1.1, 4.1.2 and 4.2.1,
given at each branch represents the time of division in hours. The results of cell mapping and splitting obtained by different researchers is presented in Table 1.
Since the result of cell split is entirely based on segmented cells, it is important to improve the image capturing technique in order to avoid poor quality of image, which in turn reduces the number of false positives. The false negatives are due to the disappearance of cells into clusters. Though watershed algorithm handles cells in clusters, disappeared cells behind the group cannot be processed. Fig. 7 shows the consecutive images in which there are two cells in the frame at time t shown in Fig. 7(a) and in the next frame one cell is hiding behind the other shown in Fig. 7(b), which is taken at time t+1. Future work could solve this problem by back tracking the analysis.
[image:4.595.67.536.447.622.2]The cell mapping and splitting process proposed in this paper successfully works for the well segmented images. This system was implemented in Matlab 7 with image processing toolbox, which has been convenient for the experimental development.
(a)
[image:5.595.136.461.68.600.2](b)
[image:6.595.108.479.72.225.2]
(a) (b)
Figure 7. Two consecutive gray level images with one cell hiding behind the other.
(a) Image at time t. (b) Image at time t+1
Table 1. Comparison between tracking methods of stem cells.
S.No Author Tracking Method Cell type Result Size No. of
Samples
1 Althoff K. et al. Nearest neighbour and correlation matching technique
Neural stem progenitor cells
79% - cell split
95% cell to cell association
634x504 2592 images
2 Omar Al Kofahi et al. Gaussian classifier Neural stem progenitor cells
100% with some manual
intervention
480x640 4900 images
3 Yasuda.T et al. Euclidean method C-Elegans embryo More false positives were found
299x327 1780 images
4 Amalka
Pinidiyaarachchi et al.
Nearest neighbour and correlation matching technique
Neural stem progenitor cells
71.3% of correctly segmented cells
634x504 8190 images
5 Nizamoddin. N et al. Extended Hungarian method
Hematopoetic stem cells
95% of cell association.
Splitting is not identified.
Not Available
7000 images
6 Kirubarajan et al. Modified Probabilistic data association filter
Fibroblast tissue cells
95% - cell tracking 512x512 30 images
7 Ryoma Bise et al. Partial contour matching
DIC microscopic cell images
97% - cell tracking 640x512 800 images
8 Jayalakshmi.N et al. Modified Mahalanobis algorithm
Neural stem Progenitor cells
97.4% - Cell association 95.8%– Cell splitting
480x640 4900 images
6.
CONCLUSION
This study shows that the cell tracking can be automated with accurate pre-processing methods and segmentation. The effective algorithms for preprocessing, cell detection, segmentation and cell tracking identified in this paper are morphological techniques, h-maxima transform, watershed algorithm and modified Mahalanobis algorithm respectively. This approach can be used for examining very large amount of data needed for neural stem cell investigations without human intervention. The proposed approach can be extended to be applied to 4D-tracking applications consisting of 3D
spatial and 1D temporal dimensions. Improved technology of microscopy and digital image acquisition will make the automatic lineaging more robust. Our approach will be useful to quantitatively study the image sequence of objects that split and migrate. The cell lineage constructed by the proposed method helps to understand the cell behaviour, which in turn helps in understanding the neurogenic process.
7.
REFERENCES
[image:6.595.53.549.296.636.2]Biology. Seminars in Cell and Developmental Biology, vol. 20, no. 8, pp. 894-902, October 2009.
[2] Gahrton G and Bjorkstrand B. Progress in haemotopoietic stem cell transplantation for multiple myeloma. Journal of Internal Medicine, vol. 248(3), pp. 185-201, 2000.
[3] Singec I, Jandial R, Chain A, Nikkhah G and Snyder EY. The leading edge of stemcell therapeutics. Annu. Rev. Medicine 58: 313-328, 2007.
[4] Stem-cell Therapy: Promise and Reality, Consumer reports on health 17.6 (2005): 8-9 Academic Search Premier EBSCO.web 5. Apr 2010.
[5] Sulston JE and Horvitz HR. Post embryonic cell lineages of the nematode Caenorhabditis elegans. Developmental Biology, vol. 56, pp. 110-56, 1977.
[6] Sulston JE and Horovitz HR. Abnormal cell lineages in mutans of the nematode Caenorhabditis elegans, Developmental Biology, vol. 82, pp. 41-55, 1981.
[7] Chalfie R, Horvitz HR, Sulston JE, Mutations that lead to reiterations in the cell lineages of C.elegans, Cell, vol. 24, pp. 59-69, 1981.
[8] Omar Al-Kofahi, Richard J.Radke, Susan K.Goderie, Qin Shen, Sally Temple and Badrinath Roysam. Automated cell lineage construction: A Rapid method to Analyze Clonal Development established with Murine Neural Progenitor Cells. Cell Cycle, Vol. 5, No. 3, pp. 327-335, 2006.
[9] Amalka Pinidiyaarachchi and Carolina Wahlby. Seeded watershed for combined segmentation and tracking of cells. ICIAP-2005 proceeding, pp. 336-343, 2005.
[10] Degerman. J, Faijerson. J, Althoff. K, Thorlin. T, Rodriguez. J.H, and Gustavsson. T. A comparative study between Level set and Watershed image segmentation for tracking stem cells in Time-Lapse Microscopy. MIAAB 06, pp. 1-6, 2006.
[11] Nezamoddin N.Kachouie, Paul Fiehguth and Eric Jervis. Stem Cell Localization: A Deconvolution problem. Proceedings of the 29t Annual International Conference of the IEE EMBS City International, France, pp. 5525-5528, 2007.
[12] Chunming Tang and Ewert Bengtsson. Segmentation and Tracking of Neural Stem Cell. Advances in Intelligent Computing, pp. 851-859, 2005.
[13] Dorini. L.B, Minetto. R and Leite. N.J. White Blood Cell Segmentation using morphological operatorsand Scale-Space analysis. Computer Graphics and Image Processing, pp. 294-304, 2007.
[14] Cecilia D. Ruberto, Andrew Dempster, Shahid Khan and Bill Jarra. Segmentation of Blood images using morphological operators. ICPR '00, Vol.3, 2000.
[15] Langan. D.A, Modestino. J.W, and Zhang. J. Cluster Validation for unsupervised stochastic model based image segmentation. IEEE transaction on Image processing, vol. 7(2), pp. 180-95, 1998.
[16] Theodoros Mouroutis. A.A.B and Stephen J.Roberts. Robust Cell nuclei segmentation using statistical modeling. Journal of Bioimaging, vol. 6(2), pp. 79-91, 1998.
[17] Kittler. J and Illingsworth. J. Minimum Error
Thresholding. Pattern Recognition, vol. 19, no. 1, pp. 41-47, 1986.
[18] Otsu. N. A threshold selection method from gray-level histograms. IEEE Transactions on Systems, Man, and Cybernetics, vol. 9, no. 1, pp. 62-66, 1979.
[19] Wu. K, Gauthier. D, and Levine. M. Live cell image segmentation. IEEE Transactions onBiomedical Engineering, vol. 42, no .1, pp. 1-12, 1995.
[20] Markiewicz. T, Osowski. S, Moszczyshki. L, and Satat. R. Myelogeneous leukemia cell image preprocessing or feature generation. 5t International Workshop on Computational Methods in Electrical Engineering, pp. 70-73, 2003.
[21] Vincent. L. and Soille, P. Watersheds in digital spaces: an efficient algorithm based onimmersion simulations. IEEE Transactions on Pattern Analysis and Machine Intelligence, Vol 13(6), pp. 583 - 598, Jun 1991.
[22] Comaniciu. D and Meer. P. Cell image segmentation for Diagnostic Pathology, Advanced Algorithmic approaches to medical image segmentation: State-of-art applications in cardiology, neurology, mammography nd pathology. Springer 2001, pp. 541-558.
[23] Geusebroek. J.M, Smeulders. A.W.M and Cornelissen. F. Segmentation of cell clusters by nearest neighbour graphs. Proceedings of the third annual conference of the advanced school of computing and Imaging. pp. 248-252, 1997.
[24] Meas-Yedid. V, Cloppet. F, Roumier. A, Alcover. A, Olivo-Marin. J.C, and Stamon. G. Quantitative microscopic image analysis by active contours. VI 2001 Vision Interface Annual Conference - Medical applications, 2001.
[25] Ryoma Bise, Kang Li and Takeo Kanade. Reliably Tracking partially overlapping Neural stem cells in DIC microscopy image sequences. Proceedings of the MICCAI workshop on the Optical tissue image analysis in microscopy, pp. 67-77, 2009.
[26] Tscherepanow. M, Zollner. F, Hillebrand. M, and Kummert. F. Automatic segmentation of unstained living cells in bright field microscope images. Advances in mass Data analysis of Images and Signals in Medicine, Biotechnology, Chemistry and Food industry, pp. 158-172, 2008.
[27] Ilker Ersoy and Kannappan Palaniappan. Multi-feature Contour Evolution for Automatic Live cell Segmentation in Time lapse Imagery. EMBS-2008, Engineering in Medicine and Biology Society, pp. 371-374, 2009.
[28] Braun V, Azevedo RB, Gumbel M, Agapow PM, Leroi AM and Meinzer HP. ALES: Cell lineage analysis and mapping of developmental events. Bioinformatics, vol. 19, pp. 851-8, 2003.
[29] Yasuda T, Bannai H, Onami S, Miyano S and Kitano H. Towards automatic construction of cell lineage of C. elegans from nomarski DIC microscopic images. Genome Inform Ser Workshop, vol. 10, pp. 144-54, 1999.
Springer, 2000.
[33] Zimmer. C, Labruere. E, Meas-Yedid. V, Guillen. N and Olivo-Marin. J.C. Segmentation and tracking of migrating cells in video microscopy with parametric active contours: a tool for cell based drug testing. IEEE Transactions on Medical Imaging, vol. 21(10), pp. 1212-1221, 2002.
[34] Dufour A, Shinin V, Tajbakhsh S, Guillen-Aghion N, Olivo-Marin JC and Zimmer C. Segmenting and tracking fluorescent cells in dynamic 3-D microscopy with coupled active surfaces. IEEE Trans Image Process 2005; vol. 14, pp. 1396-410.
[35] http://www.landesbioscience.com/journals/cc/supple ment/alkofani.zip referred on 20.5.2007.
[36] Serra. J. Image Analysis and Mathematical Morphology. Academic Press, Newyork, NY 1982.
[37] RM.Suresh & N.Jayalakshmi, Quantification and segmentation of progenitor cells in Time-lapse microscopy, International Symposium on Bio computing,
Emerging Technologies and Applications, Technology and Sciences, Vol 1. 2009,60-67.
[41] Beucher, S., and Lantuejoul, C. Use of watersheds in contour detection. In Proc. International Workshop on Image Processing, Real-Time Edge and Motion Detection/Estimation. Rennes, September 1979.
[42] Mehmet Sezgin, Bulent Sankur, Survey over image thresholding techniques and quantitative performance evaluation, Journal of Electronic Imaging 13(1), 2004, 146-165.
[43] RM.Suresh & N.Jayalakshmi, Cell Quantification and Watershed Segmentation in Time Lapse Microscopy, International Conference on Digital Image Processing, Singapore, Proc SPIE Vol.7546, 2010.
[44] Jayalakshmi. N and R.M.Suresh. RM. Analysis of Segmentation and Tracking Algorithms for Time Lapse Microscopic Progenitor Cell Images. International Conference on Signal and Image Processing, IEEE Xplore, Dec 2010.