Review on Implementation of Six Sigma for
Controlling Defects.
Santosh Dabhole1, Anu raje2, Sonal Khandave3, Pavankumar Ghule4, Akash Shinde5 1
Assistant Professor, 2,3,4,5UG Student Department of Mechanical Engineering,PCET’s Nutan Maharashtra Institute of Engineering and Technology, Talegaon Dabhade, Maharashtra.
Abstract: Six Sigma is a highly disciplined process that helps to focus on developing and delivering near-perfect products and services. It is a business process that allows companies to drastically improve their bottom line by designing and monitoring everyday business activities that minimize waste and resources while increasing customer satisfaction.
The lean manufacturing company under consideration recorded the high defect formation for last few years. These defects cause the organization the heavy time loss, production loss and heavy costs of material. This review presents how the six sigma technique helps to identify the cause of defects produced and also will help to minimize them.
Key Words: Six Sigma, Process capability, Normal Distribution, Zero defects, DMAIC
I. INTRODUCTION
In recent years, an increasing number of companies have used different types of quality programs in order to increase internal and external customer satisfaction as well as to reduce quality cost. Process improvement has often been accomplished through an integrated approach, using problem solving techniques such as total quality management (TQM) and classic statistical analysis. Among all these programs, Six Sigma is perhaps the most widely applied. The Define-Measure-Analyze-Improve-Control (DMAIC)approachis followed to solve problems of reducing process variation and the associated high defect rate [1].The Greek
letter σ or ‘sigma’ is a notation of variation in the sense of standard deviation. For a stable process the distance from the process mean tothe nearest tolerance limit should, according to the Six Sigma approach, be at least six times the standard deviation σ of the
process output. However, the process mean is also allowed to vary over time. If the process mean varies at most 1.5 σ from the
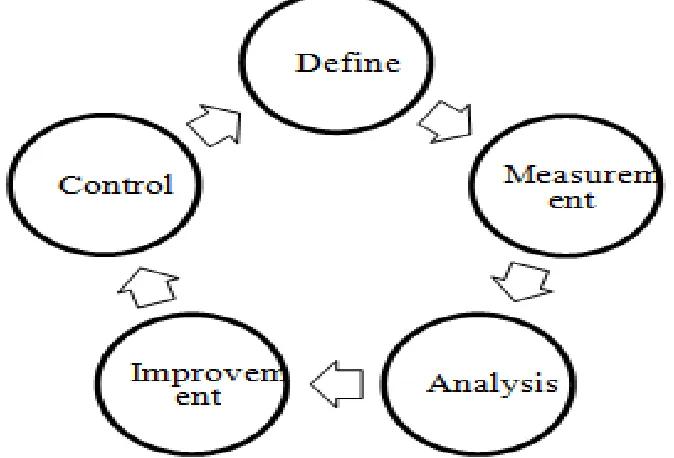
[image:2.612.128.465.480.709.2]target value, then on average at most 3.4 Defectives per Million Opportunities (DPMO)will occur if the output is normally distributed [2].The Six Sigma methodology involves DMAIC phases. The strategy is to use the five phases to provide the framework to improve a process. The five phases are depicted in Figure 1.
A. Phase 1- Define
The define phase involves defining the scope and goals of the improvement project in terms of customer requirements and the process that delivers these requirements represented in a project charter.
Tools and techniques used in define phase:
1) Affinity Diagram,
2) Plan-Do-Check-Act (PDCA)cycle,
3) Supplier Input Process Output Customer (SIPOC) process map.
B. Phase 2 – Measure
This phas involves measuring the current process performance – input, output and process – and calculating the sigma metric for both short and longer-term process capability. One must also ensure that the measuring device and procedure are reproducible and repeatable so that there is confidence in the data collected.
Tools and techniques used in Measure phase:
1) Pareto Chart,
2) Check/Data Sheet,
3) Process Capability,
4) Histogram.
C. Phase 3 – Analyze
The analyze phase involves identifying the gap between the current and desired performance, prioritizing problems and identifying root causes of problems. Benchmarking the process outputs, products or services, against recognized benchmark standards of performance may also be carried out. Depending upon the performance gap found, a decision will be made as to whether the existing process can be improved or whether it should be redesigned.
Tools and Techniques:
1) Cause and Effect Diagram,
2) Multi – vari Charts,
3) Scatter Diagram,
4) Analysis of Variances (ANOVA).
D. Phase 4 – Improve
The improve phase involves generating the improvement solutions to fix the
Problems and prevent them from recurring so that the required financial and other performance goals are met. Creativity will be required to find new ways to do things to the quality, cost and time standards required by the performance improvement goals. Tools and Techniques:
1) Design of Experiment,
2) Deployment Flowchart,
3) Tree Diagram,
4) Failure Mode Effects Analysis (FMEA).
E. Phase 5 – Control
The Control phase involves implementing the improved process in a way that “holds the gains”. Standard Operating Procedures (SOP) will be documented in systems such as ISO9000 and standard measurement procedures will be established using techniques such as statistical process control (SPC). The cycle is repeated, if further performance shortfalls are identified. Tools and Techniques
1) Quality Function Deployment (QFD),
2) Standard Operation Procedure (SOP),
II. LITERATURE REVIEW A. Hsiang-Chin Hung et. al. [3]
Parameter Define Measure Analysis Improve Control
Shrinkage of bun
1.Set goal point
2.Focus on
customer complains
3.Select most
prone object
1.PFD
2.Cause &
Effect Diagram
1.Statistical
Analysis by
ANOVA 2.FMEA 3.Brainstorming
1.Design of
experiments to
investigate best
recipe
2.Revision of
FMEA
1.Train machine
operator
2.Periodic maintenance Plan
3.Incoming Material
Inspection
4.Revised SOP & SPC control chart
Description: Food distribution SMEs have got the potential to implement the quality initiatives if there is an integrated and collaborative approach in alignment with SC objectives and if there is enough knowledge of the terminology, the principles and the tools in quality initiatives.
B. AdanValleset. al. [4]
Parameter Define Measure Analysis Improve Control
Electrical Failures
1.Selection of
critical customer characteristics 2. Selection of response variable
3.Detection of
defects during
testing
1.Normality test of data
2.Analysis of
Process Capability 3.Repeatability & Reproducibility 1.Brainstorming 2.Pareto chart 3.Statistical analysis 4.Variance Test 1.Implementation
of Possible
Solution
2.Implementation
of other
equipment
1.Maintenance Plan 2.Test of Equality
Description: The implementation of this project has been considered as successful because the critical factor for the process were found and controlled. Therefore, the control plan was updated and new operating conditions for the production process. The base line of the project was 3.35 sigma level and the gain 0.37 sigma that represents the elimination of 18,788 PPM’s.
C. Leonard A. Perry [5]
Parameter Define Measure Analysis Improve Control
Process Quality Improvement 1.Problem Definition 2.Project Team 3.Time duration 4.Project Target using SIPOC 1.Measurement Plan 2.Capability Indices 3.Histogram 1.Brainstorming 2.Cause & Effect Diagram 3.FMEA 1.Regulation Diagram 2.Reaction Plan 1.QFD Method 2.Affinity Diagram
III. METHODOLOGY
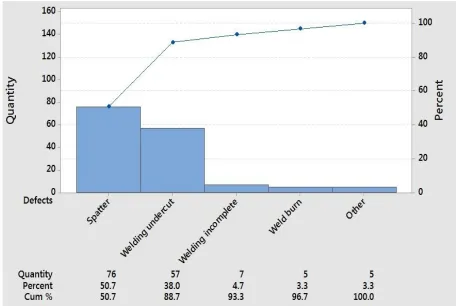
Chassis manufacturing company is considered which does not involve six sigma methodology, that consumes most of the manufacturing cycle time to rework on weld defects of chassis components. Pareto chart for component Main Pipe is drawn on the basis of data check sheet that describes the proportions of each defects occurrence on weekly basis.
A. Check sheet for Component - Main Pipe Defects:
Total no of components inspected= 1000
Sr. No. Defects Quantity of defects
1 Spatter 76
2 Welding undercut 57
3 Welding incomplete 7
4 Weld burn 5
5 Blow holes 3
[image:5.612.122.491.179.374.2]6 Shabby welding 2
Table 1: Check sheet for component- main pipeDefects
B. Pareto Chart for Main Pipe Defect
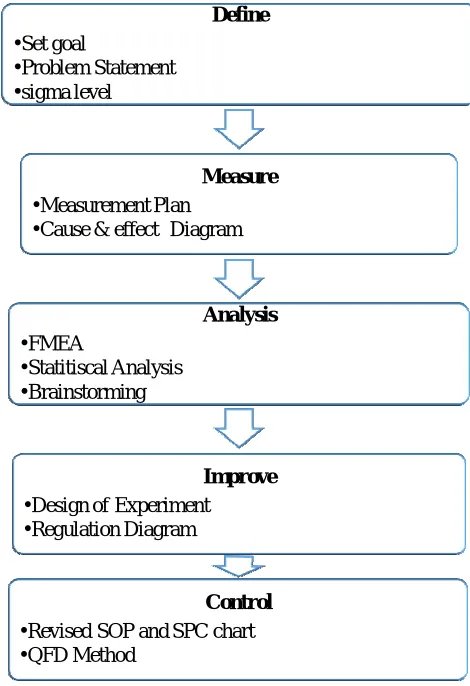
[image:5.612.77.533.404.710.2]C. Process Flowchart of Six Sigma
Figure 3: Methodology proposed
IV. FUTURE SCOPE
There are several tools and techniques used to achieve Six Sigma, following amongst them are proposed to reduce rework of welded components of chassis i.e. Head pipe, main pipe, center pipe.
A. Interrelation Diagram
B. Histogram
C. Pareto Chart
D. Cause and effect diagram
E. FMEA
F. Process capability
In BadveAutocomps Pvt. Ltd. Reworking of welded component consumes most of the manufacturing cycle time. By using above tools and techniques of Six Sigma manufacturing time cycle of chassis is aimed to be reduced.
V. CONCLUSION
In this paper, six sigma tool used for cost reduction during manufacturing of components is studied. These tools, interrelation diagram, Cause and Effect diagram, Pareto chart, FMEA etc, are found to be very effective.
This increase in performance and decrease in process variation lead to defect reduction and improvement in profits, employee morale, & quality of product or services. Six Sigma is a quality control program focused on meeting customer requirements, improving customer retention, and improving and sustaining business products and services. These tools are proposed for reduction
Define
• Set goal
• Problem Statement • sigma level
Measure
• Measurement Plan • Cause & effect Diagram
Analysis
• FMEA
• Statitiscal Analysis • Brainstorming
Improve
• Design of Experiment • Regulation Diagram
Control
in manufacturing cycle time of welded components of two chassis in badveautocomps pvt. Ltd. Six Sigma is a method that provides organizations tools to improve the capability of their business processes.
REFERENCES
[1] Sushil Kumar, “Application of six sigma in Automobile Industry”, Department of Mechanical Engineering, Maharaja Agrasen University, Baddi ,India [2] T. Pfeifer, W.Reissiger, C.Canales, “Integrating Six Sigma with quality management systems”, the TQM Magazine, Vol16, No4, 2004, pp 241-249 [3] Hsiang-Chin Hung and Ming-Hsien Sung, “Applying six sigma to manufacturing processes in the food industry to reduce quality cost”, ISSN 1992-2248
©2011 Academic Journals
[4] AdanValles, Jaime Sanchez, Salvador Noriega, Berenice Gómez Nuñez, “Implementation of Six Sigma in a Manufacturing Process: A Case Study”, Industrial and Manufacturing Engineering Institute of Engineering and Technology Autonomous University of Cd. Juárez Cd. Juarez, Chih. México [5] Leonard A. Perry, “Six Sigma: Concepts, tools, and applications”, Industrial Management & Data Systems, Vol105, No4, 2005, pp 491- 505