Technology (IJRASET)
Classification of Cotton Leaf Spot Disease Using
Enhanced HPCCDD Algorithm
Dr. P. Revathi 1
1Assistant Professor, Department of Computer Science, Maharaja Arts and Science College, Arasur(po), Nellabur-641407.
Abstract: Cotton is the most crucial commercial crop of India and all over the states. Cotton disease analysis using most probably of the environment has been utilizes significant techniques available in image processing , data mining and signal processing areas. The image is converted into pixels to detect the disease correctly and report it to the farmers. This work focusses on new algorithm named improved HPCCDD (Homogeneous Pixel Counting Algorithm for Cotton Diseases Detection) (ie)., feature extraction using PSO algorithm, which recognizes the features available in the affected image by matching the threshold values assigned to the RGB features. Finally performance evaluation is carried out 100 images and 500 images to check the accuracy of the algorithm, with other existing algorithms.
Keywords: Improved HPCCDD Algorithm, Particle swarm optimization algorithm, Image processing, RGB best fitness function. Pest recommendation.
I. INTRODUCTION
The pixel plays the vital role of image processing techniques, in fact most probably pixel is called the color groups of the main object. In this work using improved HPCCDD and PSO is used to identify the main optimum pixels macthing of the diseases in ratio level of RGB features. It has been obtained the prediction and symptoms of the diseases. Finally pest recommendation provided to the farmers.
The particle swarm optimization (PSO) is a heuristic stochastic Optimization method based on the movement and Intelligence of swarms. PSO is the population–based search optimization algorithm based on simulation of the common performance of birds in a flock. It plays a vital role in solving the problem faced in optimization methods and also the feature selection method. PSO uses a number of color features that can be compared for the swarm moving around in the search space looking for the preeminent feature initialized randomly. A swarm consists of Number of color features, where each color feature represents a candidate solution moving around D- dimensional search space. Every one of the color features has a fitness value, which are evaluated by using a fitness function to be optimized, and have velocities which direct the movement of the pixels. The changes to a pixel within the swarm are influenced by the experience or information of its neighbors and every feature adjust its position according to two fitness value, pbest and gbest, to avoid being intent in a local optimum by fine-tuning the inertia weight. best is a local fitness value, whereas best constitutes a global fitness value. If the gbest value is itself intent in a local optimum, a search of every pixel boundary can be mathematically modeled.
A. Common Types of Diseases and Symptoms
The diseases on the cotton leaves are classified as
1) Fusarium wilt,
2) Verticillium wilt.
3) Root rot,
4) Boll rot,
5) Grey mildew,
6) Leaf blight,
7) Bacterial blight
8) Leaf curls.
Symptoms of Cotton leaf Spot Diseases are discussed below:
B. Grey Mildew (Areolate Mildew/ Dahiya) - Ramularia Areola
Technology (IJRASET)
areolate). The lesions are bright with yellowish green on the top surface. As the spots grow older, the leaf tissues turn yellowish brown while a whitish frosty growth appears chiefly on the under surface but occasionally also on the top surface. This is the conidial phase of the causal fungus. Lesions occur on the bracts subtending the bolls. As the leaf becomes chlorotic, the lesion turns reddish brown and defoliation takes place. Early and severe defoliation leads to premature boll opening and immature lint.
C. Bacterialblight (Xanthomonas Axonopodis Pv. Malvacearum)
Dark green, water soaked, angular lesions of 1 to 5 mm across the leaves and bracts, especially on the undersurface of leaves. Hence called angular leaf spot. Occasionally extensive dark green, water soaked lesions along the veins known as vein blight. Symptoms are usually more prevalent on lower leaves than on topper leaves. Lesions dry and darken with age and leaves may be shed prematurely resulting in extensive defoliation. Black lesions on the stem which girdle and spread along the stem or branch known as black arm. Dark green, water soaked, greasy, circular lesions of 2 to 10mm across the bolls, especially at the base of the boll under the calyx crown. As the boll matures the lesions dry out and prevent normal boll opening. This stage of symptom is called as “Boll rot”.
D. Leaf Curl Virus Disease - Gemini Virus
The initial symptom is feature Small Vein Thickening (SVT) on young top leaves of plants. Later, growing curling of leaves occurs due to the not level growth of veinal tissues on the abaxial side of the leaves. Subsequently, the structure of the cup shaped or leaf laminar outgrowth called enations appear on the underside of the leaf. In severe cases and in plants affected at an early age, reduction of inter-nodal length leading to stunting and reduced flowering/fruiting is observed.
E. Alternaria Leaf Spot - Alternaria Macrospora, A. Alternata
Alternaria macrospora causes brown, gray brown or tan lesions 3–10mm in diameter, especially on lower leaves. Sometimes with dark or purple margins and with concentric zones. . Affected leaves develop an abscission layer, sense and drop to the ground. Circular dry brown lesions up to 10mm across may also be seen on the bolls. A. alternata causes usually purple specks or small lesions with purple margins on leaves and bolls.
F. The Structural design of this Paper
A rest of this paper organized as follows as provided section 1. Introduction, Section 2. The related work, Section 3. Motivation , Section 4. Material and methods (presents the two Proposed algorithms namely, HPCCDD Algorithm and Improved HPCCDD and PSO algorithms). Section 5. Results and discussion (Present and analyzes the Performance results of effective proposed algorithms). Section 6.Some final concluding remarks and future study directions are given.
II. RELATED WORK
Technology (IJRASET)
classification algorithms could be used to identify diseases.[14]Early study discussed the mainly owing on concepts of data mining such as Classification, Decision Trees, and Neural Networks.[15] Proposed study discussed the threshold and Triangle threshold methods are used to segment the leaf area and lesion region area respectively. [16] Proposed study discussed the features were then used as inputs to a (SVM) classifier and tests were performed to identify the best classification model. [18] Current work discussed the cotton leaves diseases analysis used in the Eigen features are regularized in a dissimilar way. Hole spacing feature extraction or dimensionality reduction in this work. [19] Previous work discussed the Cotton leaf curl virus analysis used in means ad compared with Duncan’s new multiple range (DMR) test at 0.05-level of significance.
A. Evaluation of Existing Work
Table1: The Evaluation of existing algorithms Accuracy
Table 1: Represent the evaluation of the previous algorithms based on its accuracy in detecting cotton leaf spot diseases. Here Gulhane .V. A et al., and Gujar.A.A (2011), Detection of Diseases on Cotton Leaves and Its Possible Diagnosis, In this paper used SOM and back-propagation neural network techniques achieved an overall accuracy 90% identified the cotton leaf spot diseases. Syed A. Heath et al., Automatic Cleaning and classification of Cotton leaves, bolls and flowers using CMYK color splitting, in this work described this technology are CMYK based image cleaning technique to remove shadows, hands and other impurities from images,and using other two techniques RPM and Dis Bin and compared with the classical PCA based technique. Hui Li, 2011. WEB-Based Intelligent Diagnosis System for Cotton Diseases Control in this paper exposed Back- propagation techniques used to control eight types of the cotton diseases and accuracy was 89.5%. Bernardes. A. A. et al., proposed in this paper focus identification of Foliar Diseases in Cotton crops capitalized wavelet transforms and Support Vector machine has been used to identify three types of cotton diseases.
B. Objective
In this work the input image is captured and the disease is identified using the proposed Image processing techniques is to identify the disease and symptoms and pest recommendation is the final output of result (SMS) based.
The main contribution of this work is to identify the disease correctly, which will help the farmer correct decision to take and minimize their yield loss and increases the economic status of our country, protection of their life.
III. MOTIVATION
Technology (IJRASET)
A. Creating a complicated agricultural environment to support the farmers to easily identify the disease and get control of it (Pest Recommendation).
B. Attempting to automate disease identification process using Advance color image processing.
C. Increase the revenue and security of the farmers life and condense their burden.
D. Time consuming(less).
E. Increase the economic status of our nation.
IV. MATERIAL AND METHODS
The Proposed Structural Design of HPCCDD Algorithm
A. Classification Process was divided into two Phases
1) First Phase: Proposed HPCCDD Algorithm
2) Second Phase: Proposed Improved HPCCDD algorithm
B. HPCCDD Algorithm works follow us
This algorithm is the combination of algorithms various like:
1) Proposed Homogeneous Pixel Counting Algorithm for Cotton Diseases Detection (HPCCDD)
2) Homogeneous Segmentation Based Edge Detection (HSBED) Method
[image:5.612.88.525.313.507.2]3) Statistical Analysis based Pixel Ranging Algorithm (SAPR)
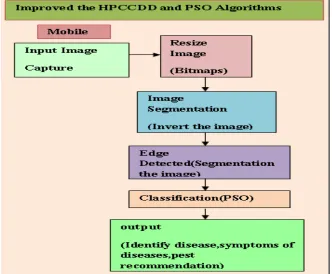
Figure 1: The Architecture diagram of HPCCDD
C. Proposed Homogeneous Pixel Counting Algorithm for Cotton Diseases Detection (HPCCDD) 1) RGB image acquires
2) Create the Color transformation construction
3) Convert the Color values in RGB to the space specified in the Color transformation model.
4) Apply Color Filter
5) Masking green-pixels (damaged part of the leaf)
6) Eliminate the masked cells inside the boundaries of the infected cluster
7) Find Edge detection using (Canny with Sobel homogeneous techniques of HSBED)
8) Calling the Pixel Ranging method to calculate the RGB features (every disease dissimilar)
9) Texture Statistics Analysize (using SAPR method)]\
10) Configuring Disease Reorganization and Pest Recommendation.
D. Homogeneous Segmentation Based Edge Detection (HSBED) Method
Technology (IJRASET)
detector and divides it by the normal value of the part. This division removes the effect of not level lighting in the image. The normal value of a part is available by convolving the part with a mask containing all ones and dividing by the size of the part.
1) Input: A example Image from Segmentatio
2) Output: Detected Edges
a) Agree the input image
b) Apply mask Gx, Gy to the input image
c) Apply Sobel and Canny edge detection algorithm and the gradient (Homogeneous)
d) Masks manipulation of Gx, Gy separately on the input image
e) Results combined to find the absolute magnitude of the gradient
|G| = √ (Gx2+Gy2)
E. Statistical Analysis based Pixel Ranging Algorithm (SAPR)
1) Input: Edge Detected Image, Segmented Image
2) Output: Percentage of damaged area
a) Get the Color Range from segmentation using an edge detected image
b) Check the Pixel values which fall on the disease pixel range
c) If the pixel value falls on the range increment a count value by 1
d) Repeat the step 2 & 3 for all edges detected in the image.
e) Find the percentage from the count value
f) Repeat the percentage.
First Call Function starts Analysis. It has two parameter images, disease color.
F. Second Phase Proposed Improved HPCCDD Algorithm (PSO_HPCCDD)
1) Bitmaps (Resize Image), Edge Detection from Segmentation (Invert Image)
[image:6.612.140.472.430.704.2]2) PSO Algorithm used for Best feature selection and HPCCDD used for Classification (Identification of disease and symptoms of disease, Pest Recommendation).
Technology (IJRASET)
Proposed Improved HPCCDD Algorithm StepsPseudocode for the proposed improved HPCCDD algorithm
1) Input: Mobile captured image
2) Output: disease name, disease symptoms,pest recommendation
3) Process: Classification using PSO-HPCCDD Feature selection using PSO
a) Initialize the particle's best known position to its initial position: pi ← xi
b) Initialization of the particle's position with input feature results from the color variance and edge variance
c) Parameter selection
d)For each particle evaluate the fitness value
e)If (f(pi) < f(g)) update the swarm's best known position: g ← pi
f)Set pbest as gbest g
g)Update particle values
h) Update the particle's velocity: vi,d ← ω vi,d + φp rp (pi,d-xi,d) + φg rg (gd-xi,d)
i) Update the particle's position: xi ← xi + vi
j) If (f(xi) < f(pi)) do:
k) Update the particle's best known position: pi ← xi
l) If (f(pi) < f(g)) update the swarm's best known position: g ← pi
m) Now g holds the best found solution.
n) Get gbest as optimal solute
o) Obtain optimized parameters and feature selecti
p) Else
q) Goto step i
Figure2: Represent the process adopted in our proposed Improved HPCCDD algorithm is illustrated below:
G. Proposed PSO_HPCCDD
In this PSO-HPCCDD classification the feature extraction is performed by splitting the input image into pixels values ,then set the color variance and quantization value of edge detector. But in existing method we performed only the canny edge detector and color splitting only not check the individual pixel wise or block wise color variance ,text variance . Simple edge detection is carried out and blocks with edge pixels inside are judged into the structural category. Then, color variance is calculated in the remaining blocks. Find the variation across the edge with canny edge detector and color splitting methods.Variations in the gray level in a region in the neighborhood of a pixel is a measure of the texture. Here we calculate the feature level fusion to combine the color and texture feature sets after normalization in order to yield a joint feature vector (JFV). Instead of using GA for selection of the best features in the feature vector we use PSO-HPCCDD and selection of the best parameters for both global and local features results. In this algorithm the feature as input to classify the features and finally display the result .Initially select the feature vectors for training , HPCCDD classification algorithm the input file is read by the system , we define the decision function f (K) to classify the feature vectors W ,based on decision function only we classify the training samples into -1 or +1 .If the objective or decision function f (K) is greater than zero then we define the class label as +1 otherwise it is considered as class label of -1 . Finally the Regions classified by the HPCCDD Prediction step as output.
H Economical Benefit
This work assists farmers , to take decision immediately, and they will get the best solution to diseases and suitable pest recommendation in different languages like Tamil, English, Hindi. Through which Production can be improved, Futher the yield loss can also be reduced. The farmers get the ultimate solution and it increases the economic status of the country. The significance of this research work has been protect the life of the crops and reduce the farmers' burden.
V. RESULTS AND DISCUSSION
A. Description of Dataset
Technology (IJRASET)
Fusarium wilt, 4. Root Rot, 5. Boll rot, 6. Leaf spot, 7. Brown Leaf spot, 8.Grey mildew. [image:8.612.190.424.99.182.2]Performance Evaluation
[image:8.612.206.449.254.370.2]Figure 3: Performance Evaluation of HPCCDD Algorithm
[image:8.612.152.455.453.671.2]Table 2: Shows the performance evaluation of proposed HPCCDD algorithm
Table 2: Shows the Performance evaluation of Proposed HPCCDD algorithm has been carried out only 100 images obtained the Sensitivity, Specificity, Accuracy. Figure 3:Represent the Performance Evaluation of HPCCDD Algorithm.
B. Proposed HPCCDD Algorithm Results
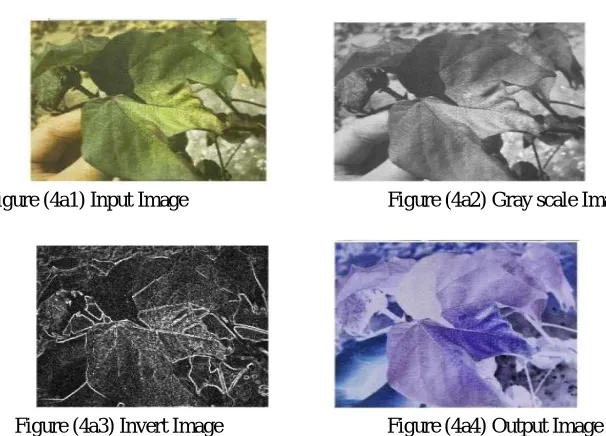
Fusarium Wilt
Figure (4a1) Input Image Figure (4a2) Gray scale Image
Figure (4a3) Invert Image Figure (4a4) Output Image
Fig (4a1) shows the Normal input Image of One type of Cotton disease, FusaiumWilt image is inverted into a grayscale image Fig (4a2). After that Fig (4a3) shows that using homogeneous edge detection techniques (Canny and Sobel with homogeneous operator) and getting white lightning edges identifies the disease boundary of the leaf spot, Fig (4a4) shows that the color filter applied and
Algorithm No.of Images
Sensitivity (%)
Specificity (%)
Accuracy (%)
Proposed
Technology (IJRASET)
owes the dark color of the part is disease affected the leaf image is output.C. Verticillium Wilt
Figure (5b1) Input Image Figure (5b2)Gray scale Image
Figure (5b3) Invert Image Figure (5b4) Output Image
Fig (5b1) shows Normal input Image of another type of Cotton disease, Verticillium Wilt. The image is inverted into a grayscale image Fig (5b2). Fig (5b3) shows that using homogeneous edge detection techniques and getting white lightning identifies the disease boundary of the leaf spot. Fig (5b4) shows that applied the color filter and owes the dark color of the part is disease affected the leaf image is output.
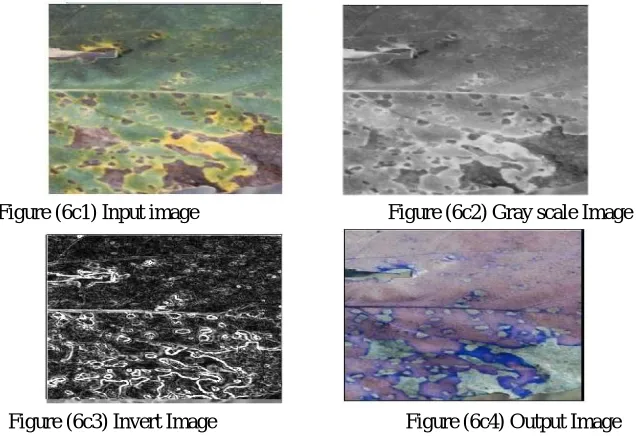
D. Leaf Blight
Figure (6c1) Input image Figure (6c2) Gray scale Image
Figure (6c3) Invert Image Figure (6c4) Output Image
[image:9.612.154.455.102.319.2] [image:9.612.149.467.393.611.2]Technology (IJRASET)
dark is disease affected part.E. Proposed Improved HPCCDD Algorithm
[image:10.612.86.521.118.338.2]The proposed Improved HPCCDD algorithm analyzes the cotton leaf diseases more accurately than other previous algorithms.
[image:10.612.89.526.392.625.2]Fig 7: Report of Farmer and diseases Description
Figure 7: As shown above the output results obtained to the famers final SMS of Diseases name and symptoms of the disease,precaution of the pest recommendations details help to the farmers (Precaution the disease awareness).
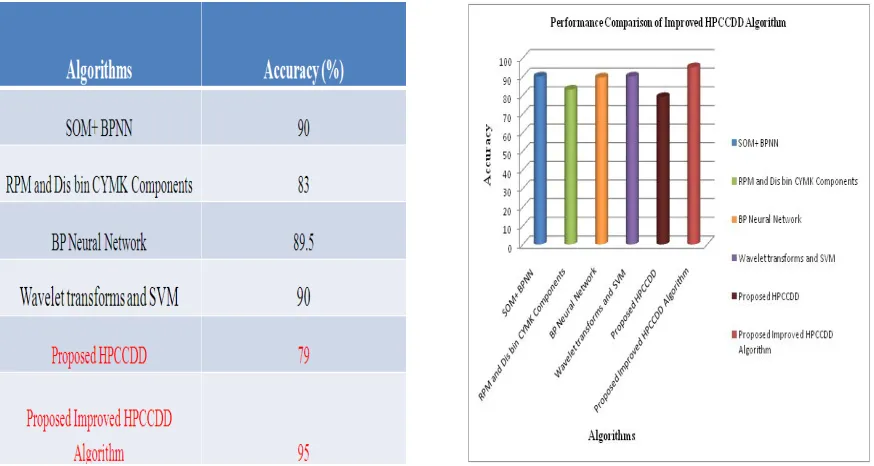
Table 2: Performance Comparison of Improved HPCCDD Algorithm Figure 8 : Performance Comparison chart of Improved HPCCDD Algorithms
Technology (IJRASET)
[image:11.612.84.301.77.304.2] [image:11.612.81.537.78.308.2][image:11.612.182.432.393.553.2]
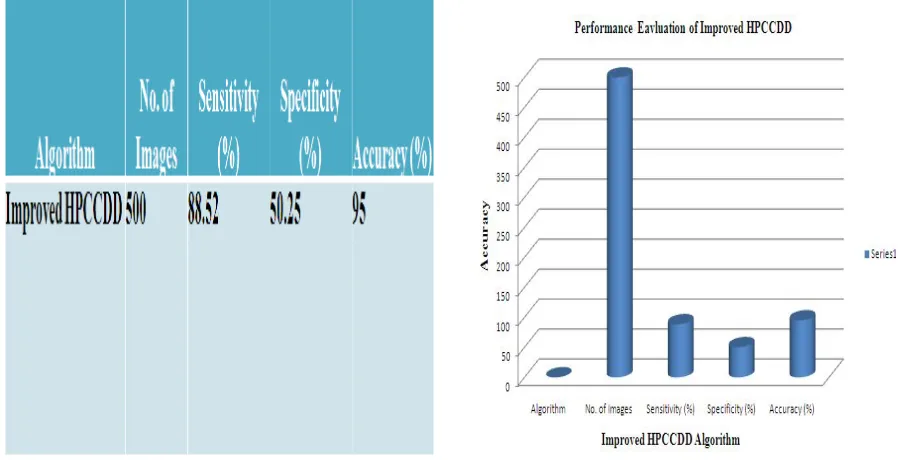
Table 3: Performance Evaluation of Improved HPCCDD Algorithm Figure 9: Performance Evaluation of Improved HPCCDD Algorithm
Table 3 and Figure 9 : Shows the above results are obtained as above shown the Performance Evaluation of Improved HPCCDD Algorithm in this work used a number of images. Finally carried out the accuracy, sensitivity, specificity of the diseases leaf images.
Table 4 .Performance Evaluation of Eight types of diseases
Table 4: Shows the performance Evaluation results of eight types of diseases has been used by Improved HPCCDD Algorithm, here Alternaria leaf blight type-1 disease has been owing the 95.15%precision rate, Leaf Curl disease has been owing 68.5precision rate, Root rot disease has been owing 74.24% precision rate, Fasarium Wilt disease has been owing 85.02 precision rate, Boll rots disease has been owing 75.06% precision rate,Leaf spot disease is owing 87.38% precision rate,Brown Leaf spot disease has been owing 73.76% precision rate,Grew Mildew disease has been 89.25% precision rate and No disease has been owing 13.4 %precision rate. Finally obtained the performance evaluation of overall system has accuracy rate 94.54%.
VI. CONCLUSION
Technology (IJRASET)
Proposed HPCCDD. The Proposed Improved HPCCDD has the overall 95% accuracy(500images). The proposed algorithm is suitable to detect the disease accurately. Endly the performance evaluation of Improved HPCCDD has been obtained the accuracy rate is better than other existing classifiers.
VII.ACKNOWLEDGMENT
I would like to express my special thanks of gratitude to Dr.S.Nakkeeran Savage Perumal, Associate Professor (Pathology) Department of Plant Pathology of Tamil Nadu Agricultural University and thankful to our Karpagam University in to do my Research work. my heartily thankful them for the overall support.
REFERENCES
[1] Chidambaram. P “Integrated Disease Management to Reduce Yield Losses in Quality Cotton” 99-109.
[2] Sion Hannunal, N.Anantrasirichi, Swarna Subrmanian, Suma Prashant, Ashokjhunjhunwala and C. Nishan, Canagarajah.2011.Agriculture Disease Mitigation
System. Intact Journal on Communication Technology: Special Issue on Next Generation Wireless Networks and Applications, 2 ( 2): 364-36
[3] Hui Li, Ronghua Ji, Jianhua Zhang, Xue Yuan, Kaiqun Hu and Lijun oi.2011. WEB-Based Intelligent Diagnosis System for Cotton Diseases Control” IFIP
Advances in Information and Communication Technology, 346:483-490
[4] BernardesA. A, J. G. Rogeri, N. Marranghello and A. S. Pereira, A.F. Araujo and João Manuel R. S. Tavares” Identification of Foliar Diseases in Cotton Crop”
SP, Brazil.
[5] Gulhane.V.A & Dr. A. A. Gurjar2011. Detection of Diseases on Cotton Leaves and Its Possible Diagnosis (IJIP),5 (5): 590-598.
[6] Yan Cheng Zhang, Han Ping Mao, Bo Hu, Ming Xili.2007.Features selection of Cotton disease leaves image based on fuzzy feature selection techniques. IEEE
Proceedings of the 2007 International Conference on Wavelet Analysis and Pattern Recognition, Beijing, China, 2 (4 ).
[7] Syed A. Hayat, Ahsan Abdullah, Muhammad, A.Chaudary, Yasir J. Malik and Waseem Gillani. “Automatic Cleansing and classification on Cotton leaves,
bolls and flowers using CMYK color splitting”.
[8] Meunkaewj inda.A, P. Kumsawat, K. Attakitmongcol and A. Sirikaew .2008.Grape leaf disease Detection n from color imaginary using the Hybrid intelligent
system.Proceedings of ECTI-CON
[9] Verma, Susanta Kumar Satpathy, Lokesh Kumar Sharma.2011.A Step towards Precision Farming of Rice Crop by Estimating Loss Caused by Leaf Blast
Disease Using Digital Image Processing and Fuzzy Clustering IJCTT, 1 (2):1-6.
[10] Al-Hiary.H, S. Bani-Ahmad, M. Reyalat, M. Braik and Z.ALRahamneh.2011.Fast and Accurate Detection and Classification of Plant Diseases. International
Journal of Computer Applications (0975 – 8887) 17(1):31-38
[11] Sannakki S.S., Rajpurohit V.S., Nargund V.B., Arun Kumar R, and Yallur P.S.2011. A Hybrid Intelligent System for Automated Pomegranate Disease
Detection and Grading. International Journal of Machine Intelligence e 3 ( 2): 36-44
[12] Lili N.A, F. Khalid, N.M. Borhan,” Classification of Herbs Plant Diseases via Hierarchical Dynamic Artificial Neural Network after Image Removal using Kernel Regression Framework” International Journal on Computer Science and Engineering (IJCSE), :15-20.
[13] Pydipati.R, T.F. Burks , W.S. Lee,2006.Identification of citrus disease using color texture features and discriminant analysis. Computers and Electronics in
Agriculture 52 : 49–59.
[14] Nithya.A, V. Sundaram,2011.Identifying the Rice diseases using Classification and Biosensor techniques IJART, 1(1):76-81.
[15] Sanjay B. Patil, Dr. ShrikantK.Bodhe.2011.Leaf Disease Severity Measurement Using Image Processing, International Journal of Engineering and Technology
3 (5):297-301
[16] Camargo. A, J.S. Smith.2009. Image Pattern Classification for the identification of diseases causing agents in plants. Computers and Electronics in Agriculture,
66( 2) : 121–125
[17] Phillips D. Image Processing with c-scribed
[18] Ajay A. Gurjar, Viraj A. Gulhane,”Disease Detection On Cotton Leaves by Eigenfeature Regularization and Extraction Technique”, International Journal of
Electronics, Communication & Soft Computing Science and Engineering (IJECSCSE), 1(1): 1-4
[19] Rashida Perveen,Ishaque Fani,Irshad Rasheed,Sobia Chohan,Atiq- ur- Rehman,Saleem Haider,2010.Identification of Cotton leaf curls begomovirus in
Pakistan in different Symptomatic and Asymptomatic Plants through Enzyme-linked Immunosorbent Assay (ELISA), European Journal of Social Sciences .14(4):502-507.
[20] Chomtip Pornpanomchai, Supolgaj Rimdusit,Piyawan Tanasap and Chutpong Chaiyod,2011. Thai Herb Leaf Image Recognition System (THLIRS), Kasetsart