Technology (IJRASET)
©IJRASET 2013: All Rights are Reserved
199
A Novel Object Based Image Retrieval System
Using Expectation Maximization Method
Saeid Mojarrad#1
, Seyyed Hadi Hashemi-Berenjabad*2
Department of Electrical Engineering, University Colleague of Science and Technology Elm o Fann Urmia, Iran
Abstract—Content based image retrieval, the problem of finding images from data base according to their content, has been the subject of a significant amount of research in the last decade. Image retrieval based on region is one of the most promising and active research directions in recent years. As literature prove that region segmentation will produce better results. Human visual perception is more effective than any machine vision systems for extracting semantic information from image, hitherto no specific system has been suggested with the ability of extracting object individually. We introduce a new idea, hence object detection has been obtained as main contribution of this paper and a new feature extraction based on spectral analysis is presented.
Index Terms— Image Segmentation, Spectral Correlation Function, Image Retrieval
I. INTRODUCTION
Inthis paper Expectation Maximization (EM) algorithm is utilized to segment image into different regions. A new image representation which provides a transformation from the raw pixel data to a small set of image regions which are coherent in color and texture space is presented. In addition the EM algorithm performs automatic segmentation based on image features [1]. EM iteratively models the joint distribution of color and texture with a mixture of Gaussians. The resulting pixel cluster memberships provide a segmentation of the image. After the image is segmented into regions, system select the region where contain main object. More over a description of chosen region, based on novel feature extraction is produced [2]. The other option of the proposed system is that the user can access the regions directly in order to see the segmentation of the query image and specify which aspects of the image are important to the query. The deficiency of traditional retrieval systems is due to either both image representation and method of accessing those representations to find images, while users generally want to find images containing particular objects [15]. Most existing image retrieval systems represent images based only on their low-level features, with little regard for the spatial organization of those features. Systems based on user querying are often unintuitive and offer little help in understanding why certain images were returned and how to refine the query. Often the user knows only that he has submitted a query for, say, a horse and retrieved very few pictures of horses in return. For general image collections, there are currently no systems that can automatically classify images or recognize the objects they contain. In particular, this letter demonstrates how the segmentation and new feature extraction can considerably enhance object based retrieval system.
II. MATERIALSANDMETHODS
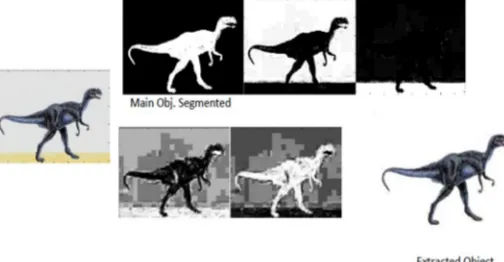
The EM algorithm is used for finding maximum likelihood parameter estimates when there is missing or incomplete data [1]. In our case, the missing data is the region to which the points in the feature space belong. We estimate values to fill in for the incomplete data (the “E-Step”), compute the maximum likelihood parameter estimates using this data (the “M-Step”), and repeat until a suitable stopping criterion is reached. Based on essence of EM algorithm we can segment each image to different parts. Simulation and Fig.1show, 3 Gaussian functions will produce the best result to extract the main object of image. Choosing different number of Gaussian function will show worst segmentation results. After extracting object we apply a novel textural feature extraction method based on spectral correlation function (SCF). SCF is fully studied in [15] [3][5][6].
For feature extraction method, two, one dimensional signals are obtained from image by ordering of pixels row by row and column by column. Then the SCF of each signal is calculated by FAM algorithm [3]. For constructing the feature vector, the Norm-1 Energy and standard deviation are computed separately on each diamond shape region of SCFs from each
Technology (IJRASET)
Fig. 1.Result of Object extraction using EM Algorithm for different Gaussian functions upper line fig 3 functions and lower 2 functions.
̅ = [ , … , ; , … , ; , … , ; , … , ]= =[ , , … , ] (1)
WhereE , i{1,2}, n = 1,2,…,N and , i{1, 2}, n = 1,2,…,N, N is the number of diamond regions at FAM algorithm. Respectively, E and , are the Norm-1 energy and standard deviation of the SCF amplitude that are calculated for the ith signal at the nth region namely D:
= 1 ∑ & ∈ | ( )| (2)
= (1 ∑( ( )− ̅ ( )) ) . (3)
Where Q and ̅ ( ) are the number of estimate points and the mean of spectral correlation function at corresponding D , respectively. Advantages of using cyclostationary analysis are the simplicity of generating features and feature vector dimension. Feature vector dimension is the one of the most important factors that determined the amount of storage space for the vector, the retrieval accuracy and retrieval time (or computational complexity).it will be shown that how simply we extract features from spectral correlation function. The spectral correlation function (SCF), which is the cross spectral of a signal and a frequency shifted version of itself, provides a second-order statistical description in the frequency domain of such signals. The theory and utility of cyclostationary signal models and the SCF, also called the cyclic spectrum, are discussed in references [8][12]. The basic time-smoothing and frequency-time-smoothing methods of spectral correlation analysis were introduced in [8] and proof of their equivalence was given in [9] and [10]. Methods which more fully exploit the computational efficiency of the FFT, namely, the FFT accumulation method (FAM) and the strip spectral correlation analyzer (SSCA) were introduced in [11] and discussed in [13] and [14].
A. Spectral Correlation Function
The SCF for a discrete-time real-valued signal x(n) is defined as the Fourier-series transform of the cyclic correlation function ( ).
( ) =∑ ( ) (2)
( ) = lim → ∑ ( + ) ( ) . [ ( ) ](3)
thus ( )is the cross spectrum of the pair of complex valued frequency-shifted signals x(n) and x(n) where f is the cross spectrum frequency variable and the parameter , called the cyclic frequency, is the relative frequency shift[3][5][6]. If the signal has finite average power then there are at most a countable number of values of for which ( )≠0. For = 0the SCF reduces to the ordinary power spectrum:
( ) = =∑ ( ) (4)
The symmetry relationships and (− ) = ( ) and periodicity associated with discrete time for any integer m and n, ( +
+ /2) = ( )which are easily verified from the defining expressions, imply that the entire function is determined by ( )for
{0≤f≤1/2,0≤ ≤1−2 } where f is the normalized frequency.
Technology (IJRASET)
©IJRASET 2013: All Rights are Reserved
201
paper we utilize one efficient algorithm from time smoothing category namely FAM. We explain only the fundamentals of time smoothing algorithms that tends to FAM method. The precise discussion can be studied at [13]. All time smoothing algorithms are based on the time smoothed cyclic cross periodogram [10].( , ) = < ( , + ) ∗( , − ) >
(5)
In (8), the operation < .>is the time averaging operation defined as follows:
(6)<. >≜ ∫ (. ) , → ∞
and, the operation * is conjugate operator.
The physical interpretation of time smoothed cyclic periodogram is the correlation spectral components of x(n) over a time span of
∆ seconds. The spectral components (n, f + ) and , − are the complex envelopes of narrow-band, bandpass components of a signal and called complex demodulates. For the calculating of ( , ) , a data tapering window of length T slides over the data for a time span of Δ each instant the complex demodulates of the data within the window are computed. After calculation of the complex demodulates, they are correlated to produce estimates of the cyclic spectrum function. Correlation is done by time averaging of conjugate products over an interval of Δ seconds. To estimate the spectrum at the point ( , ), demodulates separated in frequency by an amount and centered about a midpoint of are correlated. The quantity Δt and Δfare referred to as the time and frequency resolutions of the point estimate. Mathematically, computation of the complex demodulates is expressed as:
( , ) =∑ ( ) ( − ) ( )(7)
Where a(r) is a data tapering window of length T = NTs . Then, the complex demodulates are correlated over a time span of Δ
seconds: (n, ) =∑ ( , ) ∗( , ) ( − ) (8)
Whereg(n) is a data tapering window of widthΔ = NTs ; = + and = - . It is shown in [16] that the time smoothed cyclic cross period gram converges to the cyclic cross spectrum in the limit, as Δt→∞ followed by Δf →0 , if the time windows a(n) and g(n) are properly normalized. Therefore, if∑ ( ) =∑ ( ) = 1 Then,
lim → lim → ( , ) = ( )(9)
In the FAM algorithm, time smoothing is done by Fourier transform. If frequency is shifted from to + , the output of the system is given by:
( , ) =∑ ( , ) ∗( , ) ( − )
(10)
If several values of ε are desired, evaluation of the sum can be simplified by discretizing the values of ε to be ε = qΔ . In this case the output of the algorithm is expressed as:
( , ) =∑ ( , ) ∗( , ) ( − ) (11)
In which the sum can be evaluated with an N-point FFT. Thus, point estimates with constant cycle frequency can be computed in blocks by Fourier transforming the product sequences instead of averaging the product sequences individually. For complete coverage of the bifrequency plane a bank of bandpass filters is required to produce the necessary complex demodulates. An efficient method for producing the required complex demodulates is based on a sliding FFT [7]. In this approach the frequencies of the filter
bank are discretized to: = , =− … −1 (12)
The locations of SCF estimation associated with the pairs of complex demodulates are ( , ) where the frequency coordinates
are: = = ( ) (13)
And the cycle frequency coordinates are:
= − = ( −1)( )(14)
Technology (IJRASET)
regions (one quadrant of the bifrequency plane)[2]. The more details of the FAM algorithm can be studied at [13].
III. RESULTANDDISCUSSION
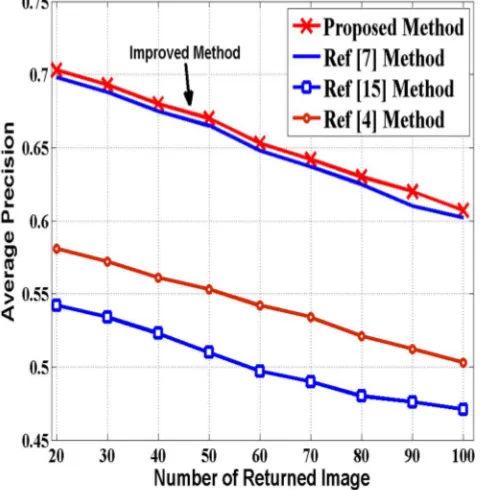
To demonstrate the efficiency of system, sub set of Corel date base containing 600 image (grouped into six classes each consisting of 100 images) was used for query images in a simulated analysis. For experimentation, the images have been categorized into six classes. For each class, the performance is evaluated, as a percentage of the correct number of returned images and is presented in Table I. Average precision in present method significantly is better than simplicity and edge based methods in all categories. Comparison between present method and Horng Lin method demonstrate to some extend same results and average precision at four categories from six increased. Main advantage of present system is computation complexity which is the least one among different methods. TableIIdemonstrate Comparison of accuracy (ACC%) of retrieved image.Fig.1show result of Object extraction using EM Algorithm for different Gaussian functions.Upper line of Fig.1, present three functions and lower two functions. Meanwhile, Fig.2 display Average precision of different methods on Image set.
[image:5.612.185.425.267.512.2]It is also interesting to notice that the proposed method has a high speed performance, which is faster than presented method in [7]. Moreover, unlike the proposed method in [7]the proposed method has a simple structure.
Fig. 2.Average precision of different methods on Image set. TABLE I
Comparison of average precision (%) with proposed method and other standard retrieval systems [15][4] [7]when 100 image returned
Semantic name of Class
Simplicity [15]
Edge Based [4]
Horng Lin Method[7]
Present Method
Building 35% 35% 36% 42%
Bus 36% 60% 69% 67%
Dinosaur 95% 95% 96% 99% Elephant 38% 25% 55% 64%
Flower 42% 65% 89% 69%
Horses 72% 65% 70% 75%
Technology (IJRASET)
©IJRASET 2013: All Rights are Reserved
203
TABLE IICOMPARISON OF ACCURACY (ACC %) OF RETRIEVED IMAGE ON IMAGE SET Returne
d Image
1 3 4 5 10 30 50 100
Simplici ty [15]
60.3 64.
7 73.
0
78.1 79.5 85.4 88. 0
90.7
Edge Based
[4]
62.4 74.
8 76.
6
79.0 84.0 90.2 92. 3
94.6
Lin[7] 85.5 92. 3
93. 2
93.6 95.1 97.7 98. 9
99.2
Present Method
88.3 93. 9
94. 4
94.6 95.7 98.1 99 99.3
IV. CONCLUSION
Presented is a full-automatic tool for object-based content retrieval through the structure of EM algorithm and spectral analysis. Novel features extraction based on spectral correlation function has been introduced. Subsequently, statistical information from spectral correlation function descriptors are retrieved and matched accordingly. The use of defined objects rather than the entire image leads to increase the flexibility of the system, it make simple to search for an object in an already prepared different kind of objects. Object-based image retrieval is not limited by the averaging properties associated with analyzing the entire image and can use local properties.
REFERENCES
[1] Gustavo Carneiro, Antoni B. Chan, Pedro J. Moreno, and NunoVasconcelos.,”Supervised Learning of Semantic Classes for Image Annotation and Retrieval” IEEE TRANSACTIONS ON PATTERN ANALYSIS AND MACHINE INTELLIGENCE, VOL. 29, NO. 3, MARCH 2007
[2] Amirani Mehdi chehel. Beheshti, A., “Evaluation of Texture Analysis using Spectral Correlation Function” FundmentaInformatica,Volume 95 , Issue 2-3 pp: 245-262 (April 2009).
[3] J. Antoni, “Cyclic Spectral Analysis in Practice,” in Mechanical systems ans signal processing Elsevier , pp. 597-630, Feb. 2007.
[4] M.Banerjee, M,K,Kundu and P.K.Das, “Image Retrieval with Visually Prominent Features using Fuzzy set theoretic Evaluation”, ICVGIP 2004, India, Dec 2004.
[5] William A. Gardner, Cyclostationarity in Communications and Signal Processing. IEEE Press,1994.
[6] William A. Gardner, “Exploitation of Spectral Redundancy in Cyclostationary signals ”, IEEE Magazine, April 1991.
[7] Chuen-Horng Lin, Rong-Tai Chen, Yung-Kuan Chan “A smart content-based image retrieval system based on color and texture feature” Image and Vision Computing Elsevier Vol. 27, pp 658–665, 2009.
[8] W.A.Gardner,”The Spectral Correlation Theory of Cyclostationary Time Series,” Signal Processing, vol.11. pp.13-36, July 1986.
[9] W.A.Gardner, “Measurement of Spectral Correlation,” IEEE Trans. Acoust.,Speech,Signal Processing, vol.ASSP-34,pp. 1111-1123, Oct. 1986. [10] W.A.Gardner,Statistical Spectral Analysis: A Nonprobabilistic Theory, Englewood Cliffs, NJ: Prentice-Hall,1987.
[11] W.A.Browm,” On the Theory of Cyclostationary Signals, Ph.D.dissertation,Univ.California,DAVIS,Sept.1987.
[12] W.A.Gardner, W.A.Brown, and C.K. Chen, ”Spectral Correlation of Modulated Signals: Part II-Digital modulation,” IEEE Trans. Commun. , vol. COM-35,pp.595-601,June 1987.
[13] W. A. Brown and H. Loomis, Jr., “Computationally Efficient Algorithms for Cyclic Spectral Analysis,” IEEE Signal Processing Mag., vol. 8. no. 2. pp, 38-49, Apr. 1991.
[14] R. S. Roberts, W. A. Brown, and H. H. Loomis, Jr.,” Digital Implementation of Spectral Correlation Analyzers,”in Proc. IEEE Fourth Annu. ASSP Workshop Spectrum Estimation Modeling, pp. 264-270. Aug. 1988.
[15] J. Li, J.Z. Wang, and G. Wiederhold, “IRM: Integrated Region Matching for Image Retrieval,” in Proc. of the 8th ACM Int. Conf. on Multimedia, pp. 147-156, Oct. 2000.