Technology (IJRASET)
©IJRASET 2015: All Rights are Reserved
378
Improved Marker Controlled Watershed
Algorithm for Novel Applications
G.K. Rajini1, Shaik Naseera2, A. Sharmila3
1,3
Assistant Professor, School of Electrical Engineering, VIT University, Vellore, India.
2
Associate Professor, School of Computing Science and Engineerin, VIT University, Vellore, India.
Abstract— Counting objects is primary task in biomedical field, food & beverage industry. To overcome this issue we present a
marker controlled watershed algorithm and thresholding which provides 99.9% results. Watershed algorithm technique is segregating the similar objects in an image and thresholding to count the objects in an image. However, watershed algorithm does not perform due to noise and irregularities in edges. To overcome this disadvantage, segmentation using markers i.e. internal marker by using opening and closing functions and in turn external marker pixels belongs to the background.
Keywords— Image Segmentation, watershed, marker, thresholding, pixels and background.
I. INTRODUCTION
Segmentation subdivides an image into its constituent regions or objects. i.e., Segmentation should stop performing when objects or region of interest in an application have been detected. Watershed transform has been widely used for fast computing and high accuracy in locating weak edges of adjacent regions in the field of image segmentation. It is a region based segmentation method based on mathematical morphology. Watershed transform was used for segmenting the topographic basins into connected components with good accuracy.
[image:2.612.229.393.506.621.2]Mathematical morphological functions efficiently deals with watershed segmentation oriented features such as size, shape area or connectivity for automatic image segmentation. The basic steps used for the segmentation process were simplification, marker extraction and boundary detection. Simplification is the removal of unwanted details from the image by using area morphology for extracting better segments. The markers based on luminance and colors were extracted to precisely locate the boundary of regions of interest. Marker extraction and boundary detection methods utilized color measurement [3]. The result of the watershed transform is degraded by the background noise and produces the over segmentation. Also, under segmentation is produced by low contrast edges generate small magnitude gradients, causing distinct regions to be erroneously merged. Different approaches may be employed to use the watershed principle for segmentation. Local minima of the gradient of an image may be chosen as markers, in this case an over-segmentation.
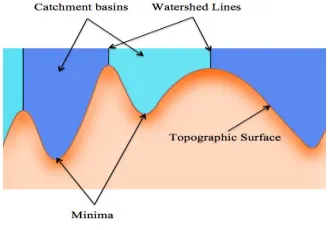
Fig 1. Watershed Transform Image
Let M1, M2… MR be the sets to denote the coordinates of the points in the regional minima of an image As indicated typically a gradient image, C(Mi) be a set denoting the coordinates of the points in the catchment basin associated with regional minimum Mi.
The notation min and max will be used to denote the minimum and maximum values of g(x,y). Finally let T[n] represent the set of coordinates (s,t) for which g(s,t)< n.
Technology (IJRASET)
©IJRASET 2015: All Rights are Reserved
379
Geometrically, T[n] is the set of coordinates of points in g(x,y) lying below the plane g(x,y)=n. The topography will be flooded in integer flood increments, from n = min+1 to n = max+1. At any step n of the flooding process, the algorithm needs to know the number of points below the flood depth. Conceptually, suppose that the coordinates in T[n] that are below the plane g(x,y) = n are marked black, and all other coordinates are marked white. Then when we look “down” on the xy-plane at any increment n of flooding, a binary image in which in which black points correspond to points in the function that are below the plane g(x,y)=n. This interpretation is quite useful in helping clarify the following discussion [2].
Let Cn(Mi ) denote the set of coordinates of points in the catchment basin associated with minimum Mi that are flooded at stage n. With reference to Cn(Mi) may be viewed as a binary image.
(1.1.2)
Cn(Mi)=1 at location (x,y) if (x,y) C(Mi) and (x,y) T[n]; otherwise Cn(Mi)=0. The geometrical interpretation of this result is straight forward and are simply using the AND operator to isolate at stage n of flooding the portion of the binary image in T[n] that is associated with regional minimum Mi.
1. is empty.
2. Contains one connected component of C[n-1].
3. Contains more than one connected component of C[n-1].
Construction of C[n] from C[n-1] depends on which of these three conditions holds. Condition 1 occurs when a new minimum is encountered, in which connected component q is incorporated into C[n-1] to form C[n]. Condition 2 occurs when q lies within the catchment basin of some regional minimum, in which q is incorporated into C[n-1] to form C[n]. Condition 3 occurs when all ridges separating two or more catchment basins is encountered. Further flooding would cause the water level in these catchment basins to merge. Thus a dam must be built within q to prevent overflow between catchment basins.
Segmentation is the process of partitioning a digital image into sets of identical pixels. Partitioning of the images is important in food processing industries to segregate products of characteristics. In tis paper, we consider the images pertaining to food processing industry for isolating products of same properties.
The main objective of this study is to
To locate and analyze boundaries present in an image To extract features based on the optimal thresholding To count the objects present in an image
II. METHODOLOGY
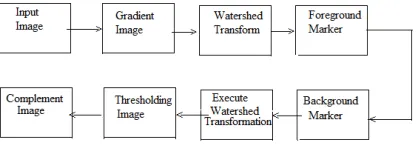
[image:3.612.205.413.593.667.2]The application of watershed algorithm is greatly influenced by the noise and other local .irregularities in an image. This leads to over-segmentation of regions to an extent that the segmented image itself looks like a noisy image most of the times and .hence can be useless for diagnosing the abnormality by a doctor. This is the major drawback of watershed algorithm. To avoid this problem markers are used for segmentation. A marker is a connected component belonging to an image. The markers which are connected components do possess the same .intensity values and are treated as regional minima. Markers can be classified as internal foreground or external background depending on its location from region of interest. The use of markers gives a priori knowledge about segmentation. This knowledge often consists in the number and the positions of the regions through the definition of some markers, and thus simplifies the problem of over-segmentation.
Fig. 2. Block diagram to count objects in an image.
Technology (IJRASET)
©IJRASET 2015: All Rights are Reserved
380
methodology for image segmentation and counting of products having the same properties using marker controlled algorithm.
III.MARKERCONTROLLEDALGORITHM
The marker-controlled watershed segmentation has been shown to be a robust and flexible method for segmentation of objects with closed contours. The marker image used for watershed segmentation is a binary image consisting of either single marker points or larger marker regions, where each connected marker is placed inside an object of interest. Each initial marker has a one-to-one relationship to a specific watershed region, thus the number of markers will be equal to the final number of watershed regions [4].
IV.RESULTS
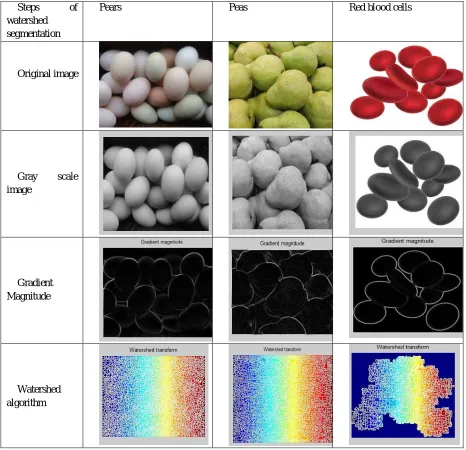
[image:4.612.74.540.257.707.2]Counting number of objects in an image easily by using marker controlled watershed algorithm and thresholding which includes Pears image, Peas image and Red blood cells image. Table 1. Shows the segregation of objects using watershed algorithm with marker’s for various images related to the food processing industry.
Table 1: Watershed Algorithm, Thresholding and Complementing Image.
Steps of
watershed segmentation
Pears Peas Red blood cells
Original image
Gray scale
image
Gradient Magnitude
Technology (IJRASET)
©IJRASET 2015: All Rights are Reserved
381
Opening function
Opening-closing
Background marker
Applied watershed algorithm
Thresholding
Complementin g image
V. CONCLUSIONS
We have counted the number of objects in an image using thresholding along with marker controlled watershed segmentation. The accuracy of the method was tested with various types of images. The method works well in both same color and different color objects. This method gives better result with high definition images. Another shortcoming of the method is that when the particles are of different tones of colors, it takes bright objects as object and darks objects are considered as background. Future analysis and work can be done to overcome the issue. If objects are of same color tone test result gives almost perfect counting.
REFERENCES
[1] Noor. A. Ibraheem, Hasan M. M., Khan R. Z., and Mishra P. K., “Understanding Color Model: A Review”, ARPN Journal of Science and Technology, pp. 265-275, May 2012.
[2] Lijun Ding, Ardeshir Goshtasby, “On the Canny Edge Detector”, The Journal of Pattern Recognition 34(2001), pp. 721-725, Jan.2000.
Technology (IJRASET)
©IJRASET 2015: All Rights are Reserved
382
[4] K. Ngan and H. Li, “Image/Video Segmentation: Current Status, Trends, and Challenges,” in Video segmentation and its applications, pp. 1–24, New York: Springer, 2011.
[5] A. Tremeau and P. Colantoni, “Regions adjacency graph applied to color image segmentation.,” IEEE Transactions on Image Processing, vol. 9, no. 4, pp. 735–744, 2000.
[6] J. Shi and J. Malik, “Motion segmentation and tracking using normalized cuts,” in Computer Vision, 1998. Sixth International Conference on, 1998.
[7] W. Tao, H. Jin, and Y. Zhang, “Color image segmentation based on mean shift and normalized cuts,” Systems, Man, and Cybernetics, Part B: Cybernetics, IEEE Transactions on, vol. 37, pp. 1382–9, Oct. 2007.
[8] E. Tuncel and L. Onural, “Utilization of the Recursive Shortest Spanning Tree Algorithm for Video-Object Segmentation by 2-D,” Circuits and Systems for Video Technology, IEEE Transactions on, vol. 10, no. 5, pp. 776–781, 2000.
[9] A. Sanin , C. Sanderson and B. Lovell "Shadow detection: A survey and comparative evaluation of recentmethods," Pattern Recognition., vol. 45, no. 4, pp.1684 -1695, 2012.