Technology (IJRASET)
Smoothening of Hybrid Photovoltaic (PV) and
Wind Power Generation Fluctuations Using Bess
Arun.S1, Dr. K.A.Palaniswamy2 1
PG Scholar, 2Dean R&D, Department of EEE, SNS College of Engineering Coimbatore India
Abstract---In this paper, a smoothening control method and a novel real-time battery energy storage station (BESS) based power allocation are proposed to reduce wind/PV hybrid output power fluctuations and regulating battery SOC under the typical conditions. The BESS is the present and classic means of smoothening wind- or solar power generation fluctuations. Such BESS-based hybrid power systems require a suitable control strategy that can effectively regulate power output levels and battery state of charge (SOC). To improve smoothening performance of the wind/PV/BESS hybrid power generation and the effectiveness of battery SOC control, the wind/PV/BESS hybrid power generation simulation analysis is undertaken and the results are presented in this paper.
I. INTRODUCTION
Climate change and the need to manage diminishing fossil fuel reserves are today two of the biggest challenges in the planet. In order to secure the future for ourselves and generations to follow, it is widely accepted that we must act now to conserve energy consumption and substantially cut greenhouse gases, such as carbon dioxide. In the world’s second-most populous country, it is unsurprising that the topic of energy supply should be a key issue and, in particular, its sustainability The most important application for new alternative energy resources, such as wind, solar, micro-hydel, biomass and waste, is in the area of electric power generation. Wind energy, solar, thermal as well as photovoltaic electric energy (that which comes from solar radiation) have substantial potential in India. Due to intermittent nature of wind energy, standalone wind system requires energy storage system to form a hybrid system [1]. Wind power can be generated from the energy potential of on-shore wind flow on a cost-competitive basis, but only at a low-load factor of about 20%. Solar thermal energy, on the other hand, is an economically feasible option mainly for water heating. The solar photovoltaic power is still a high-cost option, with cost per unit being in the range of Rs. 15 to 20. However, the development of solar thermal power involving the use of high temperature collectors with mirrors and lenses, and steam turbine is underway and could add substantial potential power generation in the future. However, whenever a large number of renewable-power generating stations access a power grid, the necessity of maintaining the power quality of utility- and micro-grid power systems demands that the following issues receive significant consideration and study:1) stabilization of power quality of islanding/interconnected systems, 2) smoothening of output fluctuation in Photovoltaic (PV) and WP generation, 3) quantifying of economics of new-energy generation, 4) effective integration with intelligent multiuser power system, and, 5) determination of optimal energy generation/storage capacity, among others. Indeed, WP and PV generations alone might not be sufficient to satisfy the power-quality requirements in the modern power system. These days, the issue of how power fluctuations in PV and wind power generation are to be smoothed has attracted widespread interest and attention. And even as this issue is being resolved, another one, that of the application of an energy storage system such as BESS, has arisen. When using BESS to control PV and wind power fluctuations, there is a trade-off between battery effort and the degree of smoothness. That is, if one is willing to accept a less smooth output, the battery can be spared some effort. Thus far, although various effective BESS-based methods of smoothening power fluctuations in renewable power generation systems have been proposed [2], [3], [4], smoothing targets for grid-connected wind and PV farms generally have not been formulated.
II. MODELING OF POWER SOURCES
A. Modeling of Wind Power Generation System
Technology (IJRASET)
Research and Test Center (NWIC) in Zhangbei, China. The detailed parameters of the SL3000 are available at website http://www.cwei.org.cn/windpowerfor/Product_Content.aspx?ID=40.
B. Design of BESS
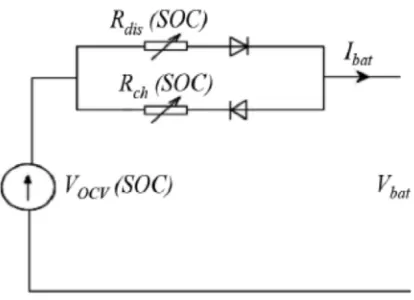
[image:3.612.208.415.165.315.2]A 100-kWh lithium iron phosphate (LiFePO4) lithium–ion BESS has been modeled in reference to the model presented in [10]– [13]. The schematic diagram of battery equivalent circuit model is shown in Fig. 1.
Fig 1 Battery equivalent circuit
In general we know that can be expressed as (1). The battery SOC is calculated by using (4) and (5) and the is calculated depending on battery charging/discharging status. The charging power of BESS is indicated by the “ ” symbol and the discharging power of BESS is indicated by the “ ” symbol, respectively. In this paper, 1-MWh BESS is considered by integrating five 200-kWh LiFePO4 lithium–ion BESSs in parallel. Specification of 1-MWh BESS is shown in Table I.
= − 1
where
= ( ) 2
= = ( ) ℎ
= ( ) ℎ
3
= − 4
=
⎩ ⎨
⎧ =
− ℎ
= − ℎ
5
Design temperature: The location where batteries are stored should be designed to minimize fluctuations in battery temperature. For this application the design temperature is assumed to be 25 degrees C.
B1-Days of storage desired/required (autonomy). The loss of electricity for the residence in this application, although undesirable, would not be catastrophic.
Technology (IJRASET)
B2-Allowable depth-of-discharge limit (decimal). The maximum fraction of capacity that can be withdrawn from the battery as specified by the designer. Note that the battery selected must be capable of this limit or greater depth of discharge. For this application the allowable depth- of-discharge is 0.8.
B3-Required battery capacity. The required battery capacity is determined by first multiplying the total amp-hours per day (A1) by the days of storage required (B1), and then dividing this number by the allowable depth of discharge limit( 2). [( 1) (( 1) / ( 2))]
B4-Amp-hour capacity of selected battery. Once the required number of amp-hours has been determined (B3), batteries or battery cells can be selected using manufacturers’ information. Exide 6E95-11 industrial grade batteries are selected for this application because of their long cycle life and rugged construction. Table 3 shows that Exide 6E95-11’s capacity for a 5 day rate is 478 amp-hours. Since battery capacity may vary with the rate of discharge, the amp-hour capacity that corresponds to the required days of storage should be used.
B5-Number of batteries in parallel. The number of batteries or battery cells needed to provide the required battery capacity (B3) by the amp-hour capacity of the selected battery is ( 4). ( 3) / ( 4).
B6-Number of batteries in series. The number of batteries needed to provide the necessary dc system voltage is determined by dividing the battery bus voltage (A2) by the selected battery or battery cell voltage (taken from manufacturer’s information). (A2) / battery voltage
B7-Total Number of batteries. Multiplying the number of batteries in parallel (B5) by the number of batteries or battery cells in series (B60 determines the total number of batteries needed. ( 5) ( 6).
B8-Total battery amp-hour capacity. The total rated capacity of selected batteries is determined by multiplying the number of batteries in parallel (B5) by the amp hour capacity of the selected battery ( 4). ( 5) ( 4).
B9-Total battery kilowatt-hour capacity. Based on the selected batteries, the kWh or energy capacity is determined by first multiplying the total amp-hour capacity (B8) times the battery bus voltage (A2), and then dividing this number by 1000.
[( 8) ( 2)] / 1000.
B10-Average daily depth of discharge. The actual daily depth of discharge to be expected on the average for the selected battery subsystem is determined by first multiplying 0.75 by the total amp-hour demand per day (A1), and then dividing this number by the total battery amp-hour capacity (B8). The 0.75 factor is used by assuming that the PV array meets the load during peak sun hours or 0.25 of the day and the batteries supply the load for the other 0.75 of the day. For the lighting load profile that operates only at night this factor would be 1.0, due to the load being entirely supplied by the batteries. [0.75 ( 1)] / ( 8).
III. SOC-BASED SMOOTHING CONTROL STRATEGY
This paper proposes a new control strategy for smoothing of wind and PV power fluctuations by means of feedback control of SOC and a large-scale BESS. First, the smoothing problem is formulated based on the power fluctuation rate. The power fluctuation rate can be considered as an assessment indicator for PV and WP generation equipment that is connected to the power grid. As (6)–(15) indicate, the power fluctuation rates over the investigated time period are used to evaluate the control effect of PV and WP smoothing both with and without the BESS. That is, as shown in equations (6)–(15) at the bottom of the page. In general, in order to operate the BESS continuously, the battery SOC needs to be controlled within a certain range. As a result, it can prevent the forced shutdown of the BESS due to overcharge or over-discharge of batteries. Moreover, control strategies for BESS and smoothing applications need to be developed to efficiently dispatch real-time total power demand of BESS between each PCS. Meanwhile, if the individual storage unit of SOC is higher or lower, the adaptive coordination of the smoothing level and of the power distribution between energy storage units should be considered based on the SOC and the maximum available charge or discharge power constraints of battery energy storage systems. In this paper, accordingly, the following four stages have been proposed based on the above-noted power fluctuation rate indicators for determination of the target power of the BESS and of each PCS.
Stage 1: Determine Initial Target Power of BESS: Method 1: The initial power of the BESS is calculated based on the dynamic filtering controller (DFC), as shown in the following:
Technology (IJRASET)
( )≤ 7
( ) = ( ) 8
( ) > 9
( ) = ( − ∆ ) ∆ ⁄ + ∆ ( ) 10
Method 2: The initial power of the BESS is calculated based on the proposed dynamic rate limiter; that is, the rate of power change at time is calculated by
( ) = ( ) ( ∆)
∆ 11
Then, the smoothing power is determined using the following rules:
≤ ( )≤ 12
( ) = ( ) 13
( ) > 14
( ) = ( − ∆ ) +∆ . 15
( ) < 16
( ) = ( − ∆ ) +∆ . 17
Further, the above-specified parameter values for the rise/ drop rate limits were determined as follows:
= × 18
= × 19
Finally, the smoothing power of WP and PV generation and the initial power of the BESS were calculated as follows:
( )= ( ) 20
( )= ( )− ( ) 21
Stage 2: Determine Target Power of Each PCS : The initial target power of each PCS is calculated by using (22) and (23). If is greater than zero (that is, the BESS is in discharge mode), is determined as
=
∑ ( ) 22
Technology (IJRASET)
Fig 2 Flowchart of process for meeting allowable power constraints of each BESS unit.
> 0 < 0
_
is sorted in descending order. Then set to
_
is sorted in descending order. Then set to
= 1& = 1 = 1& = 1
≤
= + 1 = + 1
> >
= =
=
∑
_ −
= + 1
≤
=
∑
_ −
= + 1
is calculated based on and that is
= or = (according to discharge or charge status of unit i)
End
No No
No No
No No
Yes Yes
Technology (IJRASET)
2) lower limit model: if the SOC is less than [in the present study, was set to 0.1, as shown in (28)], is set to 0.2, thereby preventing the battery energy storage system from operating in the low-SOC region; 3) upper-limit model: if the SOC is larger than [in the present study, was set to 0.9, as shown in (28)], is set to 0.8, thereby preventing the battery energy storage system from operating in the high-SOC region. These functions were realized by State flow software in the present study.
4) Stage 4: Determine Target Power for Each Unit: With reference to the above-noted states 1 to 3, the initial power of each PCS and that of the BESS are modified according to
_ = +∆
29
_ =∑ _
30
Then, _ is redetermined based on the current allowable charge/discharge power constraints for each .
If _ is greater than zero (that is, the BESS is in discharge mode), _ initially is sorted in descending order and is indicated by ; then, is refreshed, as shown in the following:
=
∑
_ − ∑
31
in descending order and is indicated by ; then, is renewed, as follows:
=∑ _ − ∑ 32A detailed flowchart of the above process is provided in Fig. 2.
Finally, the target power of can be calculated based on and as shown in Fig. 2. As a result, the target power of the BESS and that of PV and WP output smoothing can be determined as follows:
=∑ 33
= + 34
IV. SIMULATION RESULTS
[image:7.612.195.424.567.669.2]The power variations in the output of the existing system can be reduced by changing the controller. Fig 3 shows the simulation diagram of the modified system. A combined PI and PID controllers are used in the proposed system. This improvement in controllers is reflected in the output as shown in Fig 4 and Fig 5.
Fig 3 Battery Energy Storage Station
Technology (IJRASET)
[image:8.612.184.427.98.311.2]controller. Transformation from abc to dq with rotating reference frame is done to synchronize the output of BESS to the grid.
Fig 4 Output without BESS
Fig 5 Output with BESS
V. CONCLUSION
A SOC-based control strategy has been applied for smoothening the output fluctuation of a WP and PV hybrid generation system has been proposed in this project. The problem is simulated using Matlab Simulink software. The simulation results demonstrate that the control strategy manages BESS power and SOC within a specified target region without compromising the smoothening of PVGS and WPGS output. The proposed control strategy is efficient while using for a medium power application. The battery requirement increases with increase in output power fluctuations. Although a smoothened output is obtained in medium power applications the system is not efficient in large power systems and further research is to be done in this field to clear these shortcomings and get a better quality output.
REFERENCES
[1] C.Wang and M. H. Nehrir, “Power management of a stand-alone wind/photovoltaic/fuel cell energy system” IEEE Trans. Energy Convers., vol. 23, no. 3, pp. 957–967, Sep. 2008.
[2] M. E. Baran, S. Teleke, L. Anderson, A. Q. Huang, S. Bhattacharya, and S. Atcitty, “STATCOM with energy storage for smoothing intermittent wind farm power” Proc. Power and Energy Soc. General Meeting—Conv. and Delivery of Elect. Energy in the 21st Century, Jul. 2008, pp. 1–6.
[3] C. Abbey, K. Strunz, and G. Joós, “A knowledge-based approach for control of two-level energy storage for wind energy systems” IEEE Trans. Energy Convers., vol. 24, no. 2, pp. 539–547, Jun. 2009.
[4] K. Yoshimoto, T. Nanahara, and G. Koshimizu, “New control method for regulating state-of-charge of a battery in hybrid wind power/battery energy storage system” Proc. IEEE Power Syst. Conf. and Exposition, 2006, pp. 1244–1251.
[5] X. Li, “Fuzzy adaptive Kalman filter for wind power output smoothing with battery energy storage system,” IET Renew. Power Generation, vol.6, no. 5, pp. 340–347, Sep. 2012.
[6] Li, X., Li, N., Jia, X., and Hui, D. Fuzzy logic based smoothing control of wind/PV generation output fluctuations with battery energy storage system. In Electrical Machines and Systems (ICEMS), 2011 International Conference on (pp. 1-5). IEEE.
[7] Foley, A. M., Leahy, P. G, Marvuglia, A and McKeogh, E. J.”Current methods and advances in forecasting of wind power generation”Renewable Energy, 37(1), 1-8. 2012
[8] Díaz-González, F., Sumper, A, Gomis-Bellmunt, O, and Villafáfila-Robles, R.“A review of energy storage technologies for wind power applications” Renewable and Sustainable Energy Reviews 16(4), 2154-2171 2012.
[9] Xiangjun Li , Dong Hui and Xiaokang Lai “Battery Energy Storage Station (BESS)-Based Smoothing Control of Photovoltaic (PV) and Wind Power Generation Fluctuations” ieee transactions on sustainable energy, vol. 4, no. 2, april 2013
[10] X. Li, L. Xu, J. Hua, X. Lin, J. Li, and M. Ouyang, “Power management strategy for vehicular-applied hybrid fuel cell/battery power system” J. Power Sources, vol. 191, no. 2, pp. 542–549, Jun. 2009.
[11] X.Li, J. Li, L.Xu,M.Ouyang, X.Han, L. Lu, and C.Lin, “Online management of lithium-ion battery based on time-triggered controller area network for fuel cell hybrid vehicle applications,” J. Power Sources, vol. 195, no. 10, pp. 3338–3343, May 2010.
[12] X. Li, Y. Li, X. Han, and D. Hui, “Application of fuzzy wavelet transform to smooth wind/PV hybrid power system output with battery energy storage system” Energy Proceedings, vol. 12, pp. 994–1001, 2011.