5
IV
April 2017
Technology (IJRASET)
Effect of Shear Wall and Bracing on Seismic
Performance of Vertical Irregular Reinforced
Concrete Buildings
Avadut A. Patil1,Yogesh T. Jadhav 2, Sumit B. Raut3, Shrikant S. Baravakar 4, Eknath B. Mane 5
1, 3,4,5
Student of final year, B. E. Civil, Sanjay Ghodawat Institutions, Atigre, Shivaji University, Kolhapur, India
2
Student of final year M. E. Civil, Sanjay Ghodawat Institutions, Atigre, Shivaji University, Kolhapur, India
Abstract: the structural performance of buildings subjected to lateral forces due to earthquake excitation improved by lateral load resisting system in form bracing and shear wall system. Multi-storied structures are gaining wide popularity now days. The main objective of this project is to study different techniques for resisting lateral forces acting on structure. The seismic behavior of buildings is strongly affected by the arrangement of shear walls, the rigidity of floors and the connections of floors to the walls. Arrangement of shear walls are in such a way that they resist lateral loads most effectively. Therefore, in the present study the structural behavior of the buildings with shear walls at different locations has been investigated and compared in terms of storey drift, average displacement and member forces induced in the various members of the buildings. To resist earthquake and wind force a braced building is designed. Frames are in concentric in nature. It is concluded that lateral strength and stiffness increases due to shear walls and bracings.
Keywords— sap 2000, is 1893:2002, rc-structure, bracings, shear wall, lateral stiffness, ordinary moment resisting frame, special moment resisting frame.
I. INTRODUCTION
Nowadays, the great disaster in building is earthquake. Many damages caused due to earthquake in both Asia and other continent. So it is very necessary to keep in mind the hazards due to seismic effects and should adopt the necessary assumptions before design. Shear Walls are additional structural element to slabs, beams and columns. These walls generally start at foundation level and are continuous throughout the building height. Their thickness can be as small as 150mm, or as more as 400mm in high rise buildings. Shear walls are normally provided along both width and length of structure. Shear walls are vertically-oriented wide beams that carry earthquake loads downwards to the foundation. Properly designed and detailed buildings with shear walls have shown very good performance in past earthquakes .in direction of shear wall orientation it give great strength and lateral stiffness to frame, which significantly reduces lateral sway of the building and thereby reduces damage to structure and its contents. Shear walls should be provided both length and width. The braces are usually placed in vertically aligned spans. It is very effective for existing structure because it give increases lateral stiffness .The concentric bracings augment the lateral stiffness of the building frame , thus augmented the natural frequency and also usually decreasing the lateral drift. However, large in the stiffness may attract a greater inertia force due to earthquake load.
II. DETAILS OF BUILDING MODELS FOR ANALYSIS
Table-1 Properties Of Building Frame
Structural elements Properties
Number of Stories G+3
Storey Height 3 m
Number of Bays along X-direction 4
Number of Bays along Y-direction 3
Bay Width along X-direction 5 m
Bay Width along Y-direction 5 m
Size of Column 450 mmX450 mm
Technology (IJRASET)
Based on table 1,it was observed that the relevant properties are almost same in all frames of both systems namely shear wall And steel bracing systems. A further consideration will be taken to make the analysis objective more elaborate by change the Position shear wall and bracing system such as single bracing and cross bracing from plinth and foundation also shear wall from plinth level only. The selected frame has some identical characteristics. There is no diaphragm discontinuity in the selected frame.
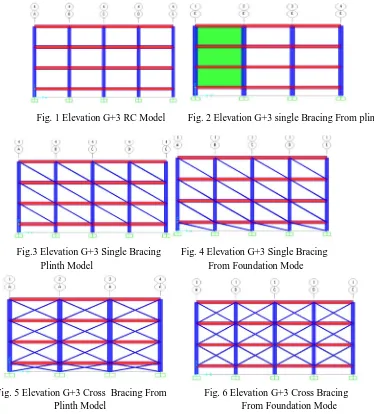
[image:3.612.134.508.198.612.2]Fig. 1 Elevation G+3 RC Model Fig. 2 Elevation G+3 single Bracing From plinth model
Fig.3 Elevation G+3 Single Bracing Fig. 4 Elevation G+3 Single Bracing Plinth Model From Foundation Mode
Fig. 5 Elevation G+3 Cross Bracing From Fig. 6 Elevation G+3 Cross Bracing Plinth Model From Foundation Mode
Figure 1 shows that the elevation G+3 RC building. Figure 2 single shear wall along X-direction has been provided from plinth level. Meanwhile, shows the position is at the side portion. Figure 3 and figure 4 shows single bracing from plinth level and from foundation level respectively. Figure 5 and figure 6 clearly represent that cross bracing from plinth and from foundation respectively.
III. METHODOLOGY
To achieve the objective of the current study several analytical shear wall, bracings and conventional building models are planned. The planned Analytical models are G+3.The analytical models will analyze by nonlinear static analysis using relevant available
Depth of Slab 150 mm
Bracing section ISLB75
Shear wall section 100mmX100mm
Technology (IJRASET)
software’s.(SAP 2000 V15). It is a part of process of structural design, and structural assessment in regions where earthquakes are prevalent FEMA 356 code has been adopted to implement the analytical parameters study. The behavior against seismic forces by shears wall and steel bracing building is main purpose of this study. The seismic analysis was very complicated portion in the field of structural engineering whereas it needs to adopt the exact process to analyze a certain structural frame considering its corresponding characteristics related to earthquake.
Below two types of structural analysis:
A. Static Analysis
This method is also called equivalent static method, in that the seismic force is calculated in a general way. From building weight base shear is calculated in this method.
B. Dynamic Analysis 1) Push over analysis
2) Time history analysis
3) Response spectrum analysis
[image:4.612.130.477.442.574.2]The Pushover analysis method has been adopted in present research. The details of parameters are show in Table 2
Table 2: Seismic Analysis parameters
Parameter value
Assumed Soil strata HARD (I)
Damping Ratio 5%
Structural importance 1
Scale factor 0.3234
IV. ANALYTICAL RESULT AND DISCUSSION
A. Comparision of Time Periods
Table 3: Comparison of G+3 R.C Model And G+3 Shear Wall From Plinth Model
Table 4: Comparison Of G+3 R.C Model And G+3 SINGLE Bracing from Plinth Model
Time Period G+3 R.C Model Time Period G+3 Single Bracing
From Plinth Model
Time Period G+3 Single Bracing From Foundation Model Time period by
modal analysis
Time period by IS1893 :2002
Time period by modal analysis
Time period by IS1893 :2002
Time period by modal analysis
Time period by IS1893 :2002
X Y X Y X Y X Y X Y X Y
0.5374 0.54595 0.2052 0.2370 0.4859 0.5462 0.2052 0.2370 0.3780 0.5347 0.2052 0.2370
Time Period G+3 R.C Model Time Period G+3 Shear Wall From
Plinth Model
Time period by modal analysis
Time period by IS1893 :2002
Time period by modal analysis
Time period by IS1893 :2002
X Y X Y X Y X Y
[image:4.612.52.559.609.706.2]Technology (IJRASET)
Table 5: Comparison Of G+3 R.C Model And G+3 SINGLE Bracing from Foundation Model
Time Period G+3 R.C Model Time Period G+3 cross Bracing
From Plinth Model
Time Period G+3 cross Bracing From Foundation Model
Time period by modal analysis
Time period by IS1893:2002
Time period by modal analysis
Time period by IS1893 :2002
Time period by modal analysis
Time period by IS1893 :2002
X Y X Y X Y X Y X Y X Y
0.5374 0.54595 0.2052 0.2
370 0.5342 0.5462 0.2052
0.237
0 0.3780 0.4459 0.2052 0.2370
Table 3. Shows that time period of frame model without shear wall and with shear wall from modal analysis is greater than empirical formula from codal. as compare with frame without shear wall, time period in x and y direction is greater than frame with shear wall .
Table 4. it is clearly represent that time period of frame without single bracing is greater than frame with single bracing from plinth and foundation respectively.
Table 5. Shows that that time period of frame without cross bracing is greater than frame with cross bracing from plinth and foundation respectively.
B. Comparision Of Displacement
[image:5.612.114.502.322.479.2]
Fig.7 Comparison Of G+3 R.C Model And G+3 Shear Wall From Plinth Model
1 2 3 4 5
0.00 0.02 0.04 0.06 0.08 0.10 J O IN T D IS P L A C E M E N T ( m ) JOINT BARE FRAME SB FROM PLINTH SB FROM FOUNDATION
Push X (x-direction)
1 2 3 4 5
0.00 0.02 0.04 0.06 0.08 0.10 J OI N T D IS P L A C E M E N T ( m ) JOINT BARE FRAME SB FROM PLINTH SB FROM FOUNDATION
[image:5.612.113.504.511.693.2]Push Y (y-direction)
Fig.8 Comparison Of G+3 R.C Model And G+3 Single Bracing Mode
1 2 3 4 5
0.00 0.02 0.04 0.06 0.08 0.10 J O IN T D IS P L A C E M E N T ( m ) JOINT BARE FRAME SW FROM PLINTH
Push X (x-direction)
1 2 3 4 5
0.00 0.02 0.04 0.06 0.08 0.10 J O IN T D IS P L A C E M E N T ( m ) JOINT BARE FRAME SW FROM PLINTH
Technology (IJRASET)
Fig.9 Comparison Of G+3 R.C Model And G+3 Cross Bracing Model
Fig 7 shows that the lateral (joint) displacement for bare frame than the frame with shear wall from plinth is more which represent that Stiffness of bare frame is less than that of frame with shear wall for both load cases i.e. For push x and push y in x and y direction respectively. Also similar from fig.8 and fig.9 we justify that the stiffness of bare frame is less than single bracing and cross bracing from plinth and foundation for both load cases i.e. For push x and push y in x and y direction respectively.
C. Comparision of Storey Drift
0 2 4 6 8 10 12
0.000 0.002 0.004 0.006
STOREY DRIFT (m)
S TO R E Y H E IG H T (m ) BARE PRAME SW FROM PLINTH
Push Y (x-direction)
0 2 4 6 8 10 12
0.000 0.002 0.004
STOREY DRIFT (m)
S T O R E Y H E IG H T ( m ) BARE PRAME SW FROM PLINTH
[image:6.612.124.491.339.501.2] [image:6.612.117.500.527.699.2]Push Y (y-direction) Fig.10 Comparison of G+3 R.C Model And G+3 Shear Wall From Plinth Model
Fig.11 Comparison Of G+3 R.C Model And G+3 Single Bracing Model
1 2 3 4 5
0.00 0.02 0.04 0.06 0.08 0.10 J O IN T D IS P L A C E M E N T ( m ) JOINT BARE FRAME CB FROM PLINTH CB FROM FOUNDATION
Push X (x-direction)
1 2 3 4 5
0.00 0.02 0.04 0.06 0.08 0.10 J O IN T D IS P L A C E M E N T ( m ) JOINT BARE FRAME CB FROM PLINTH CB FROM FOUNDATION
Push Y (y-direction)
0 2 4 6 8 10 12
0.000 0.002 0.004 0.006
STOREY DRIFT (m)
S T O R E Y H E IG H T ( m
) BF SB FROM PLINTH
SB FROM FOUNDATION
Push X (x-direction)
0 2 4 6 8 10 12
0.000 0.002 0.004
STOREY DRIFT (m)
S T O R E Y H E IG H T ( m ) bf sbfp sbff
Technology (IJRASET)
0 2 4 6 8 10 12
0.000 0.002 0.004 0.006
STOREY DRIFT (m)
S
T
O
R
E
Y
H
E
IG
H
T
(
m
)
BARE PRAME CB FROM PLINTH CB FROM FOUNDATION
Push Y (x-direction)
0 2 4 6 8 10 12
0.000 0.002 0.004
STOREY DRIFT (m)
S
T
O
R
E
Y
HE
IG
H
T
(
m
)
BARE PRAME CB FROM PLINTH CB FROM FOUNDATION
[image:7.612.120.498.79.276.2]Push Y (y-direction) Fig.12 Comparison of G+3 R.C Model And G+3 Of Cross Bracing Model
Fig 10 shows that the storey drift for bare frame is more than the frame with shear wall from plinth which represent that bare frame has more displacement capacity than that of frame with shear wall for both load cases i.e. For push x and push y in x and y direction respectively.
Also similar from fig.11 and fig.12 we justify that storey drift of bare frame is more than single bracing and cross bracing from plinth and foundation .
V. CONCLUSION
Based on the analysis and design of multi-storied building the following conclusions are made:
A. Codal empirical formula to calculate time period is less compare with time period by modal analysis, imposing higher spectral acceleration which results in conservative design,
B. Base shear have been increased because of bracing and shear wall indicating increased resistance to lateral loading
C. Shear wall and bracings are the effective modes of increasing the resistance to lateral loads
D. Story drift and displacements have been reduced due to shear walls and bracing and hence reduced lateral forces and bending moments in the elements
E. Due to bracing and shear wall P-delta are reduced.
VI. ACKNOWLEDGEMENT
The author thankfully acknowledge to Asst. Prof. V. S. Patil(Guide), Mr. Yogesh Jadhav(P.G.student), Dr. S. M. Shiyekar (HOD), Sanjay Ghodawat Institute, Atigre, Kolhapur, Maharashtra.
REFERENCES
[1] Mohdatif, Prof. Laxmikant vairagade, Vikrant Nair “Comparative Study On Seismic Analysis Of Multi-storey Building Stiffened With Bracing And Shear Wall” From Paper Published In International Research Journal Of Engineering And Technology (IRJET), Aug-2015 (pages 1185-1170)
[2] S.R.Thorat and P.J. SalunkeJ “Seismic Behaviour Of Multistory Shear Wall Frame Versus Braced Concrete Frames” published in International Journal of Advanced Mechanical Engineering (Jul’ 07), (Pages 323-330)
[3] Yaseer Alashkar, Sohaib Nazar, Mohammad Ahmed “ A Comparative Study of Seismic Strengthening of RC Buildings by steel bracing and concrete shear wall” published in International Journal of Civil and Structural Engineering Research Issue 2, march-2015), (pages 24-34)
[4] C.V.Alkunte,M.V.Dhimate,M.B.Mahajan,S.Y.Shevale,S.K.Shinde&A.A.Raskar “Seismic Analysis of Multi-storey Building having Infill Wall, Shear Wall and Bracing.” published in Imperial Journal of Interdisciplinary Research (IJIR) (April -2016), (Pages 1522-1524).
[5] Z.A. Siddiqi, Rashid Hameed, UsmanAkmal“Comparison of Different Bracing Systems for Tall Buildings” published in Pak. J. Engg. & Appl. Sci. Vol. 14 (Jan- 2014), (Pages 17-26)
[6] M. Ghalehnovi1,M.Miri and H.Hemati Prof “Comparison Of Perfomance Of Thin Steel Shear Walls And Concentric Braces By Capacity Spectrum Method” published in The 14 World Conference on Earthquake Engineering (Oct’ 2008), (Pages 116-125).
[7] Er. Raman Kumar, Er. Shagunveer Singh Sidhu, Er. ShwetaSidhu, Er. Harjot Singh Gill “Seismic Behavior Of Shear Wall Framed Buildings” published in International Journal of Engineering Technology, Management and Applied Sciences (July 2014), (Pages 28-38)
[8] Ian N Robertson, Tadashi Kawai, James Lee and Brian Enomoto (2000) “Seismic Performance of Flat-Slab Shear Reinforcement” Proc. of the 12th World Conference of Earthquake Engineering, (12WCEE), New Zealand,February 200
[9] IS: 456(2000), Plain Reinforced Concrete-code of practice, Bureau of Indian standards, India.