R E S E A R C H
Open Access
Free-breathing myocardial T2* mapping
using GRE-EPI and automatic Non-rigid
motion correction
Ning Jin
1*, Juliana Serafim da Silveira
2, Marie-Pierre Jolly
3, David N. Firmin
4,5, George Mathew
4, Nathan Lamba
2,
Sharath Subramanian
6, Dudley J. Pennell
4,5, Subha V. Raman
2,6and Orlando P. Simonetti
2,6,7,8Abstract
Background:Measurement of myocardial T2* is becoming widely used in the assessment of patients at risk for
cardiac iron overload. The conventional breath-hold, ECG-triggered, segmented, multi-echo gradient echo (MGRE) sequence used for myocardial T2* quantification is very sensitive to respiratory motion and may not be feasible in patients who are unable to breath-hold. We propose a free-breathing myocardial T2* mapping approach that combines a single-shot gradient-echo echo-planar imaging (GRE-EPI) sequence for T2*-weighted image acquisition with automatic non-rigid motion correction (MOCO) of respiratory motion between single-shot images.
Methods:ECG-triggered T2*-weighted images at different echo times were acquired by a black-blood, single-shot GRE-EPI sequence during free-breathing. A single image at a single TE is acquired in each heartbeat. Automatic non-rigid MOCO was applied to correct for in-plane respiratory motion before pixel-wise T2* mapping. In a total of 117 patients referred for clinical cardiac magnetic resonance exams, the free-breathing MOCO GRE-EPI sequence was compared to the breath-hold segmented MGRE approach. Image quality was scored independently by 2 experienced observers blinded to the particular image acquisition strategy. T2* measurements in the interventricular septum and in the liver were compared for the two methods in all cases with adequate image quality.
Results:T2* maps were acquired in all 117 patients using the breath-hold MGRE and the free-breathing MOCO
GRE-EPI approaches, including 8 patients with myocardial iron overload and 25 patients with hepatic iron overload. The mean image quality of the free-breathing MOCO GRE-EPI images was scored significantly higher than that of the breath-hold MGRE images by both reviewers. Out of the 117 studies, 21 breath-hold MGRE studies (17.9 % of all the patients) were scored to be less than adequate or very poor by both reviewers, while only 2 free-breathing MOCO GRE-EPI studies were scored to be less than adequate image quality. In a comparative evaluation of the images with at least adequate quality, the intra-class correlation coefficients for myocardial and liver T2* were 0.868 and 0.986 respectively (p < 0.001), indicating that the T2* measured by breath-hold MGRE and free-breathing MOCO GRE-EPI were in close agreement. The coefficient of variation between the breath-hold and free-breathing approaches for myocardial and liver T2* were 9.88 % and 9.38 % respectively. Bland-Altman plots demonstrated good absolute agreement of T2* in the interventricular septum and the liver from the free-breathing and breath-hold approaches (mean differences -0.03 and 0.16 ms, respectively).
Conclusion:The free-breathing approach described for T2* mapping using MOCO GRE-EPI enables accurate
myocardial and liver T2* measurements and is insensitive to respiratory motion.
Keywords:Cardiac, T2*, Mapping, Free-breathing, Iron overload, GRE-EPI, Motion correction
* Correspondence:[email protected]
1Siemens Medical Solutions USA, Inc, 460 West 12th Ave, Room 311, OH
43210 Columbus, OH, USA
Full list of author information is available at the end of the article
Background
Cardiac failure and arrhythmia induced by myocardial iron overload is the leading cause of death in thalassemia major patients and in other patients who receive chronic blood transfusions [1, 2]. Since iron induced cardiomy-opathy is treatable and reversible if intensive chelation treatment is appropriately utilized [3–5], a reliable tech-nique to quantify the extent of myocardial iron depos-ition is critical to assess the risk of cardiac complications and to effectively manage these patients. In the presence of iron, T2* is shortened and inversely related to tissue iron levels; as a result, myocardial T2* measurement is becoming widely used in the assessment of patients at risk for cardiac iron overload [6–8]. T2* values can be derived from a series of T2*-weighted gradient echo im-ages sampled at different echo times (TE). Myocardial T2* below 20 ms has been shown to indicate iron over-load in the heart, and overover-load is considered to be severe when T2* is under 10 ms as shown by the associated in-creased risk of developing congestive cardiac failure within the ensuing 12 months [6, 9].
Conventionally, T2* in the heart is measured in a region of interest (ROI) manually delineated in the interventricular septum to avoid the susceptibility gradients that can be se-vere in other segments of the left ventricular myocardium. The mean pixel value within the septal ROI of each T2*-weighted image is calculated, and then a mono-exponential decay curve is fit to these mean values across the multiple TE images. Pixel-wise T2* mapping is another approach that is gaining popularity based on the recent success of similar approaches to myocardial T1 mapping and T2 map-ping. Pixel-wise mapping involves curve fitting on individ-ual pixels; while this process is more prone to noise than ROI fitting, it can be totally automated and recent studies comparing region-based and pixel-wise methods for cardiac T2* quantification have demonstrated that pixel-wise T2* mapping reduces inter- and intra-observer variability [10].
A breath-hold, ECG-triggered, segmented, multi-echo gradient echo (MGRE) sequence is commonly used to ac-quire the series of images at multiple echo times needed to quantify myocardial T2* [6–8, 11]. As with any seg-mented k-space acquisition, data are acquired over multiple heart beats and patient breath-hold is required to avoid re-spiratory motion artifacts. Unfortunately, this strategy fails in patients unable to breath-hold. As is the case for other cardiovascular magnetic resonance (CMR) applications like cine and late gadolinium enhancement imaging, an alterna-tive free-breathing approach would be useful for myocardial T2* measurement in patients unable to breath-hold. More-over, myocardial iron overload could occur at a very early age in children who have hereditary thalassemia and receive chronic blood transfusions [12, 13]. For those children, their first CMR evaluation could be as early as 6 years old and is normally performed under general anesthesia. The
free-breathing approach offers the potential to scan chil-dren with minimal or no anesthesia.
Free-breathing methods for myocardial relaxation param-eter mapping have been previously described using the combination of single-shot image acquisition and non-rigid motion correction (MOCO). Single-shot image acquisition, which acquires an entire image within one heartbeat, is inherently less sensitive to artifacts from respiratory and cardiac motion, while non-rigid MOCO ensures proper alignment of images from different respiratory positions to enable signal averaging and pixel-wise curve fitting. These methods have been successfully applied in myocardial T1 [14, 15] and T2 mapping [16, 17]. Recently, Kellman et al. [18] described a technique for free-breathing myocardial T2* mapping using a similar approach based on MOCO single-shot highly accelerated MGRE acquisition with mul-tiple averages to improve signal-to-noise ratio (SNR). How-ever, because this technique acquires the data for multiple images in an interleaved fashion within each heartbeat, the temporal resolution is poor (345 ms) and therefore may be prone to cardiac motion artifact in patients with higher heart rate.
In this work, we propose a different approach for free-breathing myocardial T2* mapping using a single-shot gradient-echo echo-planar imaging (GRE-EPI) sequence for T2*-weighted image acquisition, and automatic non-rigid MOCO tailored for myocardial T2* mapping. A sin-gle image at a sinsin-gle TE is acquired in each heartbeat, using a segmented EPI readout to greatly accelerate each T2*-weighted image acquisition, therefore reducing the potential sensitivity to cardiac and respiratory motion artifact. Furthermore, because each T2*-weighted image at each different echo time is acquired independently in a single heart beat; the choice of echo times used in the curve fitting is more flexible than in the multi-echo GRE approach; i.e., the TEs are not restricted by echo spacing. We compared myocardial and hepatic T2* measurements using free-breathing GRE-EPI and breath-hold MGRE ap-proaches in a cohort of patients referred for clinical CMR in two different imaging centers, The Ohio State Univer-sity Richard M. Ross Heart Hospital (OSU) in Columbus, OH and The Royal Brompton Hospital (RBH) in London, England. We hypothesize that the combination of single-shot GRE-EPI and motion correction will enable free-breathing myocardial T2* mapping with results comparable to the standard, breath-hold, MGRE, segmented k-space technique.
Methods
Imaging sequences
(ETL) of 5 and a centric k-space reordering scheme [19] to minimize the shortest achievable TE. Seven TEs ranging from 1.9 ms up to a maximum of 14 ms were acquired; a repetition time (TR) of 19.2 ms was used for all images; this was the minimum TR required to accommodate the lon-gest TE. A 10°, rapid 1-1 binomial water excitation pulse [20] was used to suppress off-resonance artifacts caused by fat. A dark-blood, double inversion recovery preparation was applied at the R-wave trigger and the inversion time set to extend into diastole to minimize the contamination of myocardial signal by the adjacent blood pool [11, 21, 22]. A GRAPPA acceleration [23] rate of 2 with 14 integrated reference lines was used to further accelerate the acqui-sition. An imaging matrix of 86 x 192 resulted in an ac-quisition window of less than 200 ms. The sequence was triggered every second cardiac cycle as is typical for sequences using the double inversion preparation to
allow for magnetization recovery and more effective blood nulling. Each of the seven T2*-weighted images was acquired in mid to late diastole in a single heart-beat; this was repeated 4 times and averaging was used following motion correction to increase SNR. The total acquisition time was 64 heartbeats with all of the data acquired during free breathing.
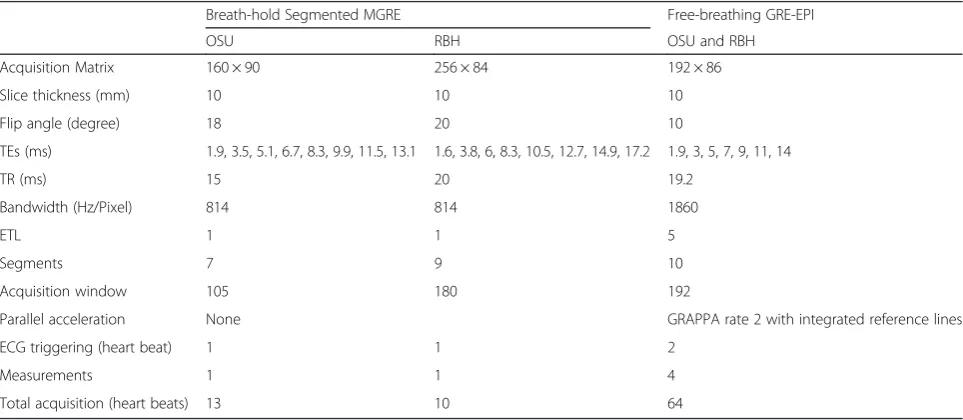
A breath-hold, ECG-triggered, black-blood, segmented MGRE sequence with gradient fly-back for mono-polar readout was used as the reference standard. In every TR, eight echoes were acquired to form eight T2*-weighted images, each at a different echo time. Seven to nine k-space lines (segments) were acquired in each cardiac cycle, resulting in a typical scan time of ten to thirteen heartbeats. Two different imaging matrix sizes were used depending on the site where the data were acquired. The detailed imaging protocols are listed in Table 1.
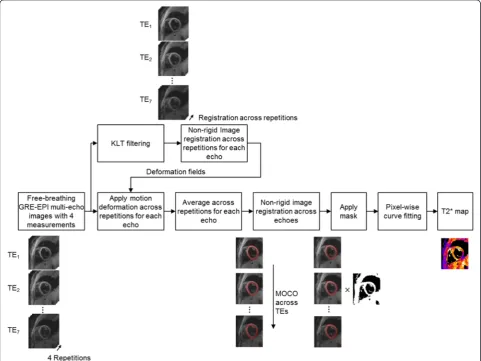
[image:3.595.57.539.88.239.2]Fig. 1Sequence diagram for a black-blood, single-shot GRE-EPI which acquires a series of ECG-triggered T2*-weighted images at different echo times (TEs) during free-breathing
Table 1Imaging protocols
Breath-hold Segmented MGRE Free-breathing GRE-EPI
OSU RBH OSU and RBH
Acquisition Matrix 160 × 90 256 × 84 192 × 86
Slice thickness (mm) 10 10 10
Flip angle (degree) 18 20 10
TEs (ms) 1.9, 3.5, 5.1, 6.7, 8.3, 9.9, 11.5, 13.1 1.6, 3.8, 6, 8.3, 10.5, 12.7, 14.9, 17.2 1.9, 3, 5, 7, 9, 11, 14
TR (ms) 15 20 19.2
Bandwidth (Hz/Pixel) 814 814 1860
ETL 1 1 5
Segments 7 9 10
Acquisition window 105 180 192
Parallel acceleration None GRAPPA rate 2 with integrated reference lines
ECG triggering (heart beat) 1 1 2
Measurements 1 1 4
[image:3.595.57.539.522.732.2]Image processing
Free-breathing, T2*-weighted images from the ECG-triggered, dark-blood, single-shot GRE-EPI sequence were motion corrected using automatic non-rigid image registration [24] to correct for in-plane respiratory mo-tion. MOCO was applied in two steps: first across the four images acquired at each TE prior to averaging, and then across the averaged images at different TEs prior to gener-ating the T2* map. The workflow is summarized in Fig. 2. All of the acquired T2*-weighted images (across all TEs and repetitions) were first passed through a Karhunen-Loève Transform (KLT) filter [25, 26] to enhance SNR prior to image registration. The KLT-filtered images were then registered using a non-rigid image motion correction algo-rithm [24], with the first measurement of the 4 repetitions at each TE selected as the reference image. The algorithm estimates the deformation field that minimizes the sum of squared differences (SSD) between the reference and target images. The deformation was modeled as a smooth vector field that gives for each pixel in the reference image its
corresponding location on the target images. The algorithm recovers the deformation by applying small displacements, incrementally maximizing the similarity criterion. To speed-up the convergence and avoid local optima, an it-erative multi-scale coarse-to-fine image pyramid was cre-ated, which contained a set of images with low-to-high image resolutions in different layers. Once the deform-ation field was estimated, it was used to warp the corre-sponding unfiltered images using a subpixel spline-based interpolation. Applying the KLT filter before image regis-tration improved image SNR and hence the robustness of the estimation of the deformation fields, while warping the raw unfiltered images prevented any unwanted image blurring introduced by the filtering process from propa-gating through to the T2* map. After image registration, the four motion-corrected images acquired at each TE were averaged. The SSDs between the motion-corrected images and the target image were calculated and served as weighting factors for averaging; the inverse of the SSD was used as the weighting factor in order to minimize the
[image:4.595.57.539.341.702.2]impact of images corrupted by arrhythmias or poor ECG gating. The intermediate result at this stage was a motion-corrected, averaged image at each TE. The MOCO algo-rithm was then applied again to the averaged images across the different TEs, with the image at the shortest TE (i.e., the image with highest signal) selected as the reference image. A deformation field was estimated to maximize the local cross-correlation (LCC) between the reference and uncorrected images. The LCC criterion was used instead of SSD as it is more robust in the presence of image inten-sity and contrast changes, as is the case for images with varying TEs. The end result of this two-stage process was a series of motion corrected, averaged images aligned across the different TEs in preparation for T2* map calculation.
To remove noise regions (air in the lungs and outside of the body) in the T2* maps, an automatic binary mask was generated based on the maximum intensity projec-tion across the images at different TEs using the iterative Otsu threshold [27]; this technique performs clustering-based thresholding to separate an image into foreground (mask value = 1) and background (mask value = 0, i.e., noise) components. The images were multiplied by this mask prior to T2* fitting to reduce calculation time. A T2* map was then generated pixel-wise by fitting a two-parameter mono-exponential model S(TEi) = S(0)
exp(-TEi/T2*), where S(TEi) is the signal intensity at the ith
echo and TEi is the echo time. A robust iteratively
re-weighted fitting was used [28, 29], in which the signal at each TE is iteratively weighted to reflect its fidelity to a mono-exponential decay curve. This method reduces the influence of points further from the ideal relaxation curve. The entire image processing (motion correction, filtering, averaging, and pixel-wise fitting) was done automatically on the scanner.
Patient experiments
Imaging was performed on two identical 1.5 T clinical scanners (MAGNETOM Avanto, Siemens Healthcare, Erlangen, Germany), with maximum gradient amplitude of 45 mT/m, and maximum slew rate of 200 mT/m/ms. Body matrix array and spinal array coils were used for signal reception.
A total of 117 patients (56 males) 47.7 ± 17.1 years, ran-ging from 9 to 82, referred for clinical CMR exams that in-cluded evaluation of myocardial T2* were studied to evaluate the effectiveness of this new technique and to compare image quality and quantitative T2* results with the standard, segmented k-space method. Eighty-eight of the patients were referred for evaluation of cardiomyopathy and were imaged at OSU. Twenty-nine patients with known thalassemia referred to CMR specifically for evalu-ation of myocardial and hepatic iron were imaged at RBH. All patients underwent T2* imaging using both the conven-tional segmented MGRE sequence during breath-hold, and
the new MOCO GRE-EPI sequence during free-breathing. Identical scan parameters were used for the MOCO GRE-EPI sequence at both centers. The breath-hold MGRE protocol used at RBH had a somewhat higher image matrix than the protocol used at OSU (256 × 84 vs. 160 x 90); this minor difference only reflected the standard clinical scan parameters employed by each site. A single mid-ventricular short axis slice was acquired in all patients. The study was approved by the local Institutional Review Boards in both sites; informed consent was waived.
Image quality comparison
Qualitative comparisons were made between the images acquired using the breath-hold MGRE and the free-breathing GRE-EPI sequences. For each acquisition strat-egy in each patient, the first 7 T2*-weighted images (with echo times ranging from 1.9 ms to 14 ms) were displayed on a single slide for the purpose of image quality scoring. The order of display was randomized with regard to both subject number and acquisition strategy. Image quality was scored independently by 2 experienced observers blinded to the particular image acquisition strategy. A 5-point scoring system was used to assess image quality based on artifact level: 1 - Very poor image quality with unusable images; 2 - Less than adequate image quality with substantial artifact; 3 - Adequate image quality with moderate artifact; 4 - Good image quality with minimal artifacts; 5 - Excellent image quality with no significant artifact. The image quality scores for the breath-hold and free-breathing techniques from the two reviewers were compared separately using the pairwise Wilcoxon signed rank test with a significance level of 0.05.
Quantitative T2* results comparison
was compared with the corresponding free-breathing T2* using a pairwise Student’st-test with significance level of 0.05.
Calibration curves relating liver T2* to liver iron content have been reported [31–33] and allow for esti-mation of liver iron concentration (LIC). Based on the equation provided in [33], LIC was estimated as LIC = 28.02/T2* - 0.454.
Results
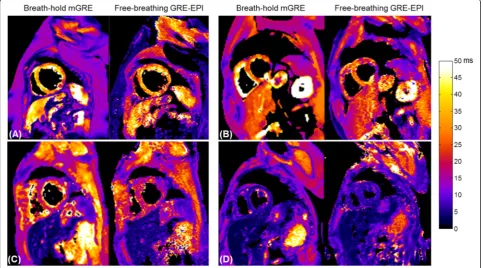
T2* maps were acquired in all 117 patients using the breath-hold MGRE and the free-breathing MOCO GRE-EPI approaches. Eight patients presented myocardial iron overload, as determined by the standard MGRE technique. Myocardial overload was mild in 6 cases (14 ms≤T2* < 20 ms), moderate in 1 case (10 ms≤T2* < 14 ms,) and severe in 1 case (T2* < 10 ms). Hepatic iron overload was present in 25 patients. Mild hepatic iron bur-den (3.8 ms≤T2* < 11.4 ms, 2.0 mg/g≤LIC < 7.0 mg/g) [34] was present in 12 patients, moderate overload (1.8 ms≤ T2* < 3.8 ms, 7.0 mg/g≤LIC < 15.0 mg/g) [34] was present in 9 patients and severe overload was present in 4 patients (T2* < 1.8 ms, LIC≥15.0 mg/g) [34]. All patients who had myocardial iron overload also had hepatic iron overload. Representative examples of T2* maps acquired using the conventional breath-hold MGRE and the new free-breathing MOCO GRE-EPI in 4 patients are shown in
Fig. 3. All four of these patients were able to hold their breath successfully during the breath-hold MGRE exam. In these examples, both techniques produced T2* maps of good image quality and myocardial and hepatic T2* were comparable between the techniques. Patient 1 and patient 2 (Fig. 3a and b) had normal hepatic T2* (T2* > 11.4 ms) and myocardial T2* (T2* > 20 ms). Patient 3 (Fig. 3c) had both mild hepatic (3.8 ms≤T2* < 11.4 ms) and myocardial iron (14 ms < T2* < 20 ms). Patient 4 (Fig. 3d) had moder-ate hepatic (1.8 ms≤T2* < 3.8 ms) and severe myocardial iron overload (T2* < 10 ms).
Figure 4 shows examples in two patients who failed to hold their breath during the breath-hold MGRE T2* scan. T2*-weighted source images acquired at three TEs and their corresponding T2* maps are shown for both the breath-hold (Fig. 4a and c) and the free-breathing (Fig. 3b and d) techniques. Both patients had normal hepatic and myocardial T2* with no indication of iron overload. Severe ghosting and image blurring artifacts caused by respiratory motion during image acquisition are clearly evident in the T2*-weighted images acquired with segmented MGRE; the corresponding T2* maps were also corrupted by respiratory motion. In Fig. 4a, even though the interventricular septum is still visible in the T2* map from the breath-hold seg-mented MGRE acquisition, severe T2* variations are ob-served. On the other hand, in this patient the single-shot MOCO GRE-EPI acquisition effectively froze respiratory
[image:6.595.57.541.427.695.2]motion during the image acquisition and produced artifact-free T2* maps during artifact-free-breathing.
In the four patients with severe hepatic iron overload, both breath-hold and free-breathing techniques did not provide reliable T2* measurements in the liver. Figure 5
shows one example of T2*-weighted source images of the first three echoes and their corresponding T2* maps in a patient with normal heart but severe hepatic iron over-load. Images were acquired using breath-hold MGRE and free-breathing GRE-EPI approaches. There is almost no
Fig. 4Examples of the T2*-weighted source images and their corresponding T2* maps in two patients (top and bottom) who failed to hold their breath during the breath-hold MGRE T2* scan: Severe ghosting and image blurring artifacts caused by respiratory motion during image acquisition are evident in the T2*-weighted images acquired with segmented MGRE; the corresponding T2* maps were also corrupted by respiratory motion (aandc), while the single-shot MOCO GRE-EPI acquisition effectively froze respiratory motion during the image acquisition and produced artifact-free T2* maps during free-breathing (bandd)
[image:7.595.60.539.87.311.2] [image:7.595.58.539.465.682.2]signal evident in the liver in any of the source images due to the very short T2*. Figure 5c shows a plot of the mean signal intensity within the ROI in the liver (red circle in Fig. 5a and b) vs. echo times, showing that the signal is below the noise level even in the earliest echo images. Hence, the fitting for T2* failed and T2* in the liver was automatically set to zero in the T2* maps for both techniques.
The mean image quality of the free-breathing MOCO GRE-EPI images was scored significantly higher than that of the breath-hold MGRE images by both reviewers (p= 0.0101 and 0.0324 respectively). The average image quality scores from reviewer #1 were 3.34 ± 1.40 and 3.72 ± 0.71 for breath-hold MGRE and free-breathing MOCO GRE-EPI, respectively. The average quality scores from review #2 were 3.82 ± 1.31 and 4.10 ± 0.74 for breath-hold MGRE and free-breathing MOCO GRE-EPI, respectively. Both reviewers agreed that image quality was more variable in the T2*-weighted images acquired using breath-hold MGRE due to the low image quality that resulted from failed breath-hold in some patients. Out of the 117 studies, reviewer #1 scored the image quality of 21 breath-hold MGRE studies (17.9 % of all the pa-tients) to be below average or very poor (image quality score≤2); while reviewer #2 scored 36 breath-hold MGRE studies (30.7 % of all the patients) to be below average or very poor, including the same 21 patients as reviewer #1. Only 2 free-breathing MOCO GRE-EPI studies were scored to be less than adequate image quality, while the MGRE images of one patient were scored to be very poor image quality by both reviewers due to failed breath-hold.
The 37 patients whose image quality was scored as less than adequate image quality by at least one reviewer for either technique were excluded from the comparison of quantitative T2* results. Out of the 80 patients with ad-equate image quality from both breath-hold MGRE and free-breathing MOCO GRE-EPI techniques, 17 patients did not have a large enough homogeneous liver region within the ventricular short axis image to permit meas-urement. 4 patients had severe hepatic iron overload and both techniques failed to measure T2* in the liver. Thus, the T2* values measured in the interventricular septum and in the liver using both techniques were compared in 80 patients and 57 patients, respectively. The ICCs, for myocardial and hepatic T2*, were 0.868 and 0.986 re-spectively (p< 0.001), indicating that the T2* measured by breath-hold MGRE and free-breathing MOCO GRE-EPI were very consistent. The CoVs between the breath-hold and free-breathing approaches for myocardial and hepatic T2* were 9.88 % and 9.38 % respectively. As demonstrated in the Bland-Altman plots shown in Fig. 6a and b, T2* in the interventricular septum (Fig.6a) and the liver (Fig. 6b) from free-breathing MOCO GRE-EPI
showed good absolute agreement with the breath-hold measurements without significant bias. Likewise, the pairwiset-test showed that there were no significant dif-ferences between the breath-hold and free-breathing ap-proaches in either myocardial or hepatic T2* (p= 0.937 and 0.598 respectively).
Discussion
Myocardial T2* is sensitive to iron deposition in the heart and has become an important diagnostic tool used to assess the risk of cardiac complications and to guide appropriate iron-chelation therapy in thalassemia patients. However, the segmented MGRE sequence commonly used for myo-cardial T2* quantification is exquisitely sensitive to respira-tory motion and requires a steady breath-hold during the image acquisition. Thus, the standard technique may not be feasible in anyone unable to comply with breath-hold commands. In 117 patients who underwent T2* mapping, we found that 17.9 % of the T2* measurements using the standard segmented sequence were scored by both reviewers to be non-diagnostic due to failed breath-hold. To overcome this limitation in the applicability of the conventional segmented MGRE acquisition, we de-veloped a new free-breathing myocardial T2* mapping approach that combines a single heartbeat T2*-weighted image acquisition with automatic correction of respiratory motion between single-shot images. The measured T2* in the myocardial septum and the liver were in good agree-ment with the standard breath-hold segagree-mented MGRE technique in those patients who were capable of breath-holding, and the new free-breathing technique produced higher image quality than the standard method in patients unable to breath hold.
for the new free-breathing technique is slightly longer compared to the breath-hold approach, it may still reduce the overall MR table time and increase patient throughput. This may be particularly useful in Middle-Eastern or Asian countries where there is higher incidence of thalassemia and the MRI table time for each patient is typically limited. The multi-shot EPI-based k-space sampling approach with an EPI factor of 5 provides the efficiency needed to achieve a very short acquisition window (< 200 ms) with-out pushing the parallel acceleration beyond a factor of 2 thereby avoiding excessive g-factor SNR loss. This acquisi-tion speed is fast enough to avoid respiratory induced arti-facts, and motion correction is utilized to compensate for in-plane respiratory motion between images secondary to variable diaphragm positions during acquisition. Com-pared to the free-breathing T2* mapping technique re-cently described in [18], which uses highly undersampled single-shot MGRE with respiratory motion corrected aver-aging, the temporal footprint of each T2*-weighted image using our technique is much shorter (<200 ms vs. 345 ms). This shorter acquisition window should render our tech-nique less sensitive to motion-induced image blurring or the loss of spatial resolution, especially in subjects with higher heart rates; however a head-to-head comparison of these two free-breathing techniques is required to verify whether this theoretical advantage is significant. Fur-thermore, our single heartbeat GRE-EPI sequence pro-vides more flexibility in defining TEs. In the conventional MGRE sequence, as well as the other recently described free-breathing sequence [18], multiple gradient echoes are sampled after each RF excitation, with the choice of TEs restricted by a fixed echo spacing. In our proposed free-breathing GRE-EPI sequence, each T2*-weighted image is acquired independently in a single heartbeat; a centric reordered echo train permits a choice of TEs that is not limited by echo spacing. This may provide advantages in terms of optimal selection of echo times for curve
fitting under conditions of very low T2* although this must be evaluated.
Automatic non-rigid image registration was used to cor-rect for in-plane respiratory motion. Clinical myocardial T2* maps are commonly acquired in the mid-ventricular short axis view in which it has been previously demon-strated that through-plane motion is not significant [35]. Since only 4 measurements were acquired per TE and a weighted averaging based on SSD was used to improve the MOCO quality, no measurements were discarded. If long-axis imaging orientations, such as the four-chamber view or transverse view are required, through-plane re-spiratory motion would have to be taken into account. It has been demonstrated for T2 mapping that navigator gat-ing and prospective slice correction combined with non-rigid registration can be used to provide complementary compensation of both through-plane and in-plane motion [16]. This same approach could be applied to the GRE-EPI sequence to avoid through-plane motion and allow for free-breathing T2* measurements in four-chamber and trans-axial orientations.
Image quality scoring was performed intentionally using the T2*-weighted source images rather than the resulting T2* maps. Motion ghosting and other artifacts tend to be more visible in the original T2*-weighted images and may not be as obvious in the T2* maps. For example, in Fig. 3a, severe ghosting artifacts are observed in the T2*-weighted images across multiple TEs, but the impact of these arti-facts is less visible in the reconstructed T2* map. In this example, the interventricular septum in the T2* map ap-pears to be relatively unaffected by artifacts, however, the source images are clearly contaminated and the resulting T2* value should not be trusted. This also emphasizes the point that when using any parameter mapping technique, the original source images should always be reviewed.
An iterative robust fitting algorithm that reweighted the signal intensity at all TEs to reflect fidelity to
[image:9.595.59.540.87.242.2]exponential decay was used to fit the T2* curves. Pixel-wise T2* estimation using this method has been previously compared with ROI-based T2* assessment using commer-cially available validated software (CMRTools, Cardiovas-cular Imaging Solutions, Ltd., London, UK). It was found that the mean T2* within the ROI of the interventricular septum was highly correlated with the ROI-based T2* es-timation [28]. Recently, alternative pixel-wise T2* curve fitting methods have been proposed to improve the accur-acy and precision of T2* estimates in images with low SNR, as can be the case when the T2* is severely short-ened. Feng et al. [36] applied nonlocal means filtering to reduce noise in T2*-weighted images while maintaining the intrinsic signal. This method was compared with low-pass Gaussian filtering and found to be more robust with superior noise suppression and detail preservation. San-dino et al. [37] recently extended the automatic truncation method [38] to reduce T2* overestimation due to noise bias by using an SNR-scaled image reconstruction and truncating low SNR measurements on a pixel-wise basis. Both methods are compatible with our proposed free-breathing T2* mapping approach. While beyond the scope of this study, the evaluation of different curve fitting ap-proaches that may improve the accuracy and precision of our free-breathing technique are warranted.
The primary limitation of this study was that relatively few patients with significant myocardial iron overload were included. A larger systematic study will be necessary to compare and evaluate the performance of the conven-tional breath-hold and new free-breathing myocardial T2* mapping techniques in patients with low T2* in the heart. Regarding liver T2* it should be noted that both the breath-hold and free-breathing protocols failed to measure very short T2* (<1.8 ms) in patients with severe hepatic iron overload. In the breath-hold MGRE protocols used at the two test centers, the earliest echo time sampled was 1.6 or 1.9 ms and the echo spacing between TEs was 2.2 or 1.6 ms determining by the imaging matrix (256 vs. 160) and readout bandwidth (814Hz/Pixel). Due to the very fast T2* decay, as shown in Fig. 3, there are not enough points (<3) sampled at early echoes where the signal is above the noise bias. In order to quantify very short T2* in the liver with severe iron overload, it would be necessary to reduce the minimum TE and the echo spacing in the MGRE se-quence by using a smaller readout matrix with increased readout bandwidth. In the free-breathing GRE-EPI se-quence, centric reordering [19] of the echo train was im-plemented, acquiring the central portion of k-space with the first echo. A fast 1-1 binomial water excitation pulse [20] was used to suppress the off-resonance artifacts caused by fat. With this combination of centric reordering and a 1-1 binomial water excitation pulse, the minimum TE achievable by the sequence (1.9 ms) was comparable to that of the segmented MGRE protocol in this study. It
might be possible to further reduce the minimum TE by using other fat suppression techniques, such as a fat satur-ation preparsatur-ation pulse [39]. While the technique may not be accurate at extremely low liver T2*, values lower than 1.8 ms already indicate an exceptionally high level of liver iron, and accurate quantification at such high levels may not be critical. The technique is able to determine whether liver iron is extremely high, and that may already provide adequate clinical information to guide chelation therapy until the liver iron is lowered to a measureable level. How-ever, if it is necessary to quantify liver iron at a high level where T2* fails, for example in chelation therapy clinical trials, some alternative methods such as liver R2 (rather than R2*) measurement [31, 40] or biopsy may be used. Furthermore, as our free-breathing GRE-EPI sequence ac-quires each T2*-weighted image at a different TE inde-pendently in a single heartbeat, the echo spacing between the echo times is no longer restricted by the readout matrix or bandwidth as in the MGRE sequence. In the fu-ture, we will explore this feature of the sequence to deter-mine whether the measurement accuracy of very short T2* (<1.8 ms) in the severe hepatic iron overload patients is improved by reducing echo spacing and acquiring add-itional early echoes. The GRE-EPI acquisition can be sen-sitive to off-resonance artifacts, and while in this study the GRE-EPI acquisition resulted in good image quality in 115 out of 117 patients, some residual fat artifacts may be ex-pected if B0field homogeneity is poor or there is excessive
adipose tissue in the FOV. Advanced, volume selective shimming procedures may be applied to further improve B0 field homogeneity and reduce off-resonance artifacts
from fat [41] or local field inhomogeneity. It should also be noted that the GRE-EPI sequence is mixing the signal from different echo times into each image, and this might be expected to corrupt the relationship between T2* and TE, where the effective TE is defined by the echo used to sample the center of k-space. By keeping the echo train relatively short (5 echoes) and the echo spacing tight (0.9 ms), we did not observe any negative impact from in-corporating multiple TEs within each image; the measured T2* was in good agreement with the standard approach when breath holding was not an issue.
Conclusion
We have developed a technique for T2* mapping using MOCO GRE-EPI that enables accurate myocardial and hepatic T2* measurements and is insensitive to respiratory motion. The approach is fully automatic and could be especially beneficial for patients who are unable to breath-hold during the T2* exam.
Abbreviations
LCC: Local cross-correlation; LIC: Liver iron concentration; MGRE: Multi-echo gradient echo; MOCO: Motion correction; OSU: The Ohio State University; RBH: The Royal Brompton Hospital; ROI: Region of interest; SNR: Signal-to-noise ratio; SSD: Sum of squared difference; TE: Echo time; TR: Repetition time.
Competing interests
NJ is employed by Siemens Medical Solutions USA, Inc. SVR and OPS receive research support from Siemens.
DJP is a consultant for ApoPharma, Novartis, Shire and Bayer and a shareholder in Cardiovascular Imaging Solutions.
Authors’contributions
OPS and NJ conceived of the study, participated in its design and coordination, and drafted the manuscript. NJ contributed to sequence development and image reconstruction, performed processing and analysis. JSS and SS were responsible for quality analysis. MPJ contributed to the formulation of algorithms. NL contributed to image analysis. DNF, GM, DJP and SVR contributed to human studies. All authors participated in revising the manuscript and read and approved the final manuscript.
Author details 1
Siemens Medical Solutions USA, Inc, 460 West 12th Ave, Room 311, OH 43210 Columbus, OH, USA.2Davis Heart & Lung Research Institute, The Ohio State University, Columbus, OH, USA.3Imaging & Computer Vision, Siemens Corporation, Corporate Technology, Princeton, NJ, USA.4NIHR Cardiovascular Biomedical Research Unit, Royal Brompton and Harefield NHS Trust, London, UK.5National Heart and Lung Institute, Imperial College, London, UK. 6Department of Internal Medicine–Division of Cardiovascular Medicine, The Ohio State University, Columbus, OH, USA.7Department of Biomedical Engineering, The Ohio State University, Columbus, OH, USA.8Department of Radiology, The Ohio State University, Columbus, OH, USA.
Received: 5 August 2015 Accepted: 9 December 2015
References
1. Zurlo MG, De Stefano P, Borgna-Pignatti C, Di Palma A, Piga A, Melevendi C, et al. Survival and causes of death in thalassaemia major. Lancet. 1989; 2(8653):27–30.
2. Olivieri NF, Nathan DG, MacMillan JH, Wayne AS, Liu PP, McGee A, et al. Survival in medically treated patients with homozygous beta-thalassemia. N Engl J Med. 1994;331(9):574–8.
3. Aldouri MA, Wonke B, Hoffbrand AV, Flynn DM, Ward SE, Agnew JE, et al. High incidence of cardiomyopathy in beta-thalassaemia patients receiving regular transfusion and iron chelation: reversal by intensified chelation. Acta Haematol. 1990;84(3):113–7.
4. Wacker P, Halperin DS, Balmer-Ruedin D, Oberhansli I, Wyss M. Regression of cardiac insufficiency after ambulatory intravenous deferoxamine in thalassemia major. Chest. 1993;103(4):1276–8.
5. Tanner MA, Galanello R, Dessi C, Smith GC, Westwood MA, Agus A, et al. Combined chelation therapy in thalassemia major for the treatment of severe myocardial siderosis with left ventricular dysfunction. J Cardiovasc Magn Reson. 2008;10:12.
6. Anderson LJ, Holden S, Davis B, Prescott E, Charrier CC, Bunce NH, et al. Cardiovascular T2-star (T2*) magnetic resonance for the early diagnosis of myocardial iron overload. Eur Heart J. 2001;22(23):2171–9.
7. Carpenter JP, He T, Kirk P, Roughton M, Anderson LJ, de Noronha SV, et al. On T2* magnetic resonance and cardiac iron. Circulation. 2011;123(14):1519–28.
8. Westwood M, Anderson LJ, Firmin DN, Gatehouse PD, Charrier CC, Wonke B, et al. A single breath-hold multiecho T2* cardiovascular magnetic resonance technique for diagnosis of myocardial iron overload. J Magn Reson Imaging. 2003;18(1):33–9.
9. Kirk P, Roughton M, Porter JB, Walker JM, Tanner MA, Patel J, et al. Cardiac T2* magnetic resonance for prediction of cardiac complications in thalassemia major. Circulation. 2009;120(20):1961–8.
10. Saiviroonporn P, Viprakasit V, Boonyasirinant T, Khuhapinant A, Wood JC, Krittayaphong R. Comparison of the region-based and pixel-wise methods for cardiac T2* analysis in 50 transfusion-dependent Thai thalassemia patients. J Comput Assist Tomogr. 2011;35(3):375–81.
11. He T, Gatehouse PD, Kirk P, Tanner MA, Smith GC, Keegan J, et al. Black-blood T2* technique for myocardial iron measurement in thalassemia. J Magn Reson Imaging. 2007;25(6):1205–9.
12. Yang G, Liu R, Peng P, Long L, Zhang X, Yang W, et al. How early can myocardial iron overload occur in beta thalassemia major? PLoS One. 2014;9(1), e85379.
13. Berdoukas V, Nord A, Carson S, Puliyel M, Hofstra T, Wood J, et al. Tissue iron evaluation in chronically transfused children shows significant levels of iron loading at a very young age. Am J Hematol. 2013;88(11):E283–5. 14. Xue H, Shah S, Greiser A, Guetter C, Littmann A, Jolly MP, et al. Motion
correction for myocardial T1 mapping using image registration with synthetic image estimation. Magn Reson Med. 2012;67(6):1644–55. 15. Xue H, Greiser A, Zuehlsdorff S, Jolly MP, Guehring J, Arai AE, et al.
Phase-sensitive inversion recovery for myocardial T1 mapping with motion correction and parametric fitting. Magn Reson Med. 2013;69(5):1408–20. 16. Giri S, Shah S, Xue H, Chung YC, Pennell ML, Guehring J, et al. Myocardial T2
mapping with respiratory navigator and automatic nonrigid motion correction. Magn Reson Med. 2012;68(5):1570–8.
17. Giri S, Chung YC, Merchant A, Mihai G, Rajagopalan S, Raman SV, et al. T2 quantification for improved detection of myocardial edema. J Cardiovasc Magn Reson. 2009;11:56.
18. Kellman P, Xue H, Spottiswoode BS, Sandino CM, Hansen MS, Abdel-Gadir A, et al. Free-breathing T2* mapping using respiratory motion corrected averaging. J Cardiovasc Magn Reson. 2015;17(1):3.
19. Beck G, Li D, Haacke EM, Noll TG, Schad LR. Reducing oblique flow effects in interleaved EPI with a centric reordering technique. Magn Reson Med. 2001;45(4):623–9.
20. Lin HY, Raman SV, Chung YC, Simonetti OP. Rapid phase-modulated water excitation steady-state free precession for fat suppressed cine cardiovascular MR. J Cardiovasc Magn Reson. 2008;10:22.
21. He T, Gatehouse PD, Smith GC, Mohiaddin RH, Pennell DJ, Firmin DN. Myocardial T2* measurements in iron-overloaded thalassemia: An in vivo study to investigate optimal methods of quantification. Magn Reson Med. 2008;60(5):1082–9.
22. Smith GC, Carpenter JP, He T, Alam MH, Firmin DN, Pennell DJ. Value of black blood T2* cardiovascular magnetic resonance. J Cardiovasc Magn Reson. 2011;13:21.
23. Griswold MA, Jakob PM, Heidemann RM, Nittka M, Jellus V, Wang J, et al. Generalized autocalibrating partially parallel acquisitions (GRAPPA). Magn Reson Med. 2002;47(6):1202–10.
24. Guetter C, Xue H, Chefd’hotel C, Guehring J. Efficient symmetric and inverse-consistent deformable registration through interleaved optimization. In: Proc. IEEE Int. Symp. Biomed. Imag. 2011, p. 590–3.
25. Ding Y, Chung YC, Raman SV, Simonetti OP. Application of the Karhunen-Loeve transform temporal image filter to reduce noise in real-time cardiac cine MRI. Phys Med Biol. 2009;54(12):3909–22.
26. Mihai G, Ding Y, Xue H, Chung YC, Rajagopalan S, Guehring J, et al. Non-rigid registration and KLT filter to improve SNR and CNR in GRE-EPI myocardial perfusion imaging. J Biomed Sci Eng. 2012;5(12A):871–7. 27. Otsu N. A threshold selection method from gray-level histograms. IEEE
Transactions on Systems, Man, and Cybernetics. 1979;9:62–6.
28. Shah S, Xue H, Greiser A, Weale P, He T, Firmin DN, et al. Inline myocardial t2* mapping with iterative robust fitting. J Cardiovasc Magn Reson. 2011;13 Suppl 1:308.
29. Holland PW, Welsch RE. Robust regression using iteratively reweighted least-squares. Commun Stat Theory Methods. 1977;6(9):15.
30. Fleiss JL, Shrout PE. Approximate interval estimation for a certain intraclass correlation coefficient. Psychometrika. 1978;43(2):259–62.
31. Wood JC, Enriquez C, Ghugre N, Tyzka JM, Carson S, Nelson MD, et al. MRI R2 and R2* mapping accurately estimates hepatic iron concentration in transfusion-dependent thalassemia and sickle cell disease patients. Blood. 2005;106(4):1460–5.
32. Garbowski MW, Carpenter JP, Smith G, Roughton M, Alam MH, He T, et al. Biopsy-based calibration of T2* magnetic resonance for estimation of liver iron concentration and comparison with R2 Ferriscan. J Cardiovasc Magn Reson. 2014;16:40.
33. Hankins JS, McCarville MB, Loeffler RB, Smeltzer MP, Onciu M, Hoffer FA, et al. R2* magnetic resonance imaging of the liver in patients with iron overload. Blood. 2009;113(20):4853–5.
35. Kellman P, Larson AC, Hsu LY, Chung YC, Simonetti OP, McVeigh ER, et al. Motion-corrected free-breathing delayed enhancement imaging of myocardial infarction. Magn Reson Med. 2005;53(1):194–200.
36. Feng Y, He T, Feng M, Carpenter JP, Greiser A, Xin X, et al. Improved pixel-by-pixel MRI R2* relaxometry by nonlocal means. Magn Reson Med. 2014;72(1):260–8.
37. Sandino CM, Kellman P, Arai AE, Hansen MS, Xue H. Myocardial T2* mapping: influence of noise on accuracy and precision. J Cardiovasc Magn Reson. 2015;17(1):7.
38. He T, Zhang J, Carpenter JP, Feng Y, Smith GC, Pennell DJ, et al. Automated truncation method for myocardial T2* measurement in thalassemia. J Magn Reson Imaging. 2013;37(2):479–83.
39. Meyer CH, Pauly JM, Macovski A, Nishimura DG. Simultaneous spatial and spectral selective excitation. Magn Reson Med. 1990;15(2):287–304. 40. St Pierre TG, Clark PR, Chua-anusorn W, Fleming AJ, Jeffrey GP, Olynyk JK, et
al. Noninvasive measurement and imaging of liver iron concentrations using proton magnetic resonance. Blood. 2005;105(2):855–61.
41. Schär M, Kozerke S, Fischer SE, Boesiger P. Cardiac SSFP imaging at 3 Tesla. Magn Reson Med. 2004;51(4):799–806.
• We accept pre-submission inquiries
• Our selector tool helps you to find the most relevant journal
• We provide round the clock customer support
• Convenient online submission
• Thorough peer review
• Inclusion in PubMed and all major indexing services
• Maximum visibility for your research
Submit your manuscript at www.biomedcentral.com/submit